1. Introduction
Adverse population distributions, arbitrary colonial borders, and deficient transport networks limit state capacity in Africa and are blamed to impede good governance and economic development on the continent (e.g., Herbst, Reference Herbst2000). However, empirical tests of this reasoning lag behind its frequent use as we lack geographically disaggregated and time-varying data on African states’ capacity to estimate its effect on local development. This research note introduces such panel data on local state capacity proxied by travel times to regional and national capitals. With these data, I document a generally positive, robust association between improving local state capacity and development.
The new data of state capacity builds on previous measures that have, after an initial focus on the country-level (Hendrix, Reference Hendrix2010), captured important subnational variation in state capacity (Boone, Reference Boone2003). However, their reliance on either surveys (Wig and Tollefsen, Reference Wig and Tollefsen2016) or age-heaping in censuses (Lee and Zhang, Reference Lee and Zhang2017) limits spatio-temporal coverage and availability in low-capacity states. As a remedy, I develop a continent-wide, yearly proxy of local state capacity based on travel times to post-independence regional and national capitals between 1966 and 2016.Footnote 1 I compute these travel times for a 5 × 5 km grid of the continent using new panel data on administrative geographies and road networks digitized from the Michelin map corpus. The data are validated with information on local state capacity from the Afrobarometer (2018).
I use the new data to estimate the effect of local state capacity on development. Previous studies provide cross-sectional evidence that locations farther away from capitals experience more conflict (e.g., Tollefsen and Buhaug, Reference Tollefsen and Buhaug2015), suffer from corruption (Campante and Do, Reference Campante and Do2014; Krishna and Schober, Reference Krishna and Schober2014), and exhibit lower levels of development (Acemoglu et al., Reference Acemoglu, García-Jimeno and Robinson2015; Henn, Reference Henn2020), an effect that is historically persistent (Pierskalla et al., Reference Pierskalla, Schultz and Wibbels2017).Footnote 2 I address potential cross-sectional endogeneity of administrative geographies by focusing on variation within locations and country-years. I find that reductions in travel times to capitals are associated with increases in education and infant survival rates, as well as nightlight emissions. These results are not explained by spurious migration, differential pre-trends, endogenous road construction, improvements in economic market access, or ethnic favoritism and conflict.
2. State capacity and development
State capacity denotes states’ ability to enforce their will by monitoring and steering citizens’ behavior (Mann, Reference Mann1984; Migdal, Reference Migdal1988). It consists of their administrative capacity, military strength, and ability to tax individuals (Hendrix, Reference Hendrix2010). Physical access to citizens through transport infrastructure is a key determinant of state capacity (Boulding, Reference Boulding1962; Mann, Reference Mann1984; Herbst, Reference Herbst2000; Acemoglu et al., Reference Acemoglu, García-Jimeno and Robinson2015).
Four mechanisms link physical accessibility via local state capacity to development. First, low transport costs between states’ headquarters and the population enables bureaucrats and police officers to enforce law and order, thereby triggering the developmental effects of centralized state institutions (Huntington, Reference Huntington1968; Campante and Do, Reference Campante and Do2014). Second, states’ provision of services such as health care and education depends on their capability to monitor demand and control agents, both of which increases with local state capacity (Krishna and Schober, Reference Krishna and Schober2014; Henn, Reference Henn2020). In addition, citizens’ access to specialized services (e.g., hospitals and courts) increases near the administrative capitals that typically harbor them. Third, smooth local accessibility increases citizens knowledge of and ability to tap into private rents from the state such as public sector jobs or subsidies (Ades and Glaeser, Reference Ades and Glaeser1995; Banerjee et al., Reference Banerjee, Hanna, Kyle, Olken and Sumarto2018).
A fourth mechanism that links state capacity with citizens’ welfare consists of taxation. As states become locally more capable, they are able to collect more taxes, which will, ceteris paribus, decrease citizens’ material welfare. With that, the net effect of state capacity depends on whether the exchange of taxes for state-provided good is generally beneficial for citizens (Timmons, Reference Timmons2005) or not (Scott, Reference Scott2017). While unable to disentangle the above theorized four mechanisms, the empirical analysis below sheds light on the overall effect of state capacity on local development.
3. Approximating state reach
Because physical accessibility is a necessary (but not sufficient) condition for state capacity, I proxy local state reach with the weighted sum of travel times to a locations’ national and regional capitals:Footnote 3


where state reach on a level of administrative hierarchy u toward point p at time t is calculated as the travel time (in hours) on the shortest path between p and its capital C p,u,t on the road network at time t.Footnote 4 The log-transformFootnote 5 captures the convex relation between travel times to capitals and state capacity (Figure 2). Weights ω u denote the impact of times to capitals on level u. Because ω u likely varies across different state activities, I estimate ω u for each development outcome separately. I measure state reachp,u,t with time-varying data on regional and national administrative geographies and road networks.Footnote 6
First, I collect comprehensive panel data on the boundaries and capitals of first-level (regional) administrative units since African countries’ independence. Drawing on diverse secondary sources, the dataset covers 1763 unique region-periods between independence and 2016 (Appendix A). Data on national borders and capitals come from Cshapes (Weidmann and Gleditsch, Reference Weidmann and Gleditsch2010). Changes in administrative unit designs and capital locations lead to temporal variation in state reachp,u,t.
Second, I transform the corpus of Michelin road maps into a digital road atlas akin to a time-varying Google Maps.Footnote 7 Scanned maps are available at a scale of 1:4 millionFootnote 8 for 23 years between 1966 and 2014. Following Müller-Crepon et al. (Reference Müller-Crepon, Hunziker and Cederman2021), pixels that depict roads are classified with a fully convolutional neural network, vectorized, and transformed into a planar graph that covers the African landmass at a resolution of 0.0417 decimal degrees (≈5 km; Appendix B). Each edge on the network is associated with a travel time derived from the quality of roads observed on the Michelin maps. With these data on roads and administrative units, I can compute the travel time on the shortest path from each location in Africa to its corresponding national and regional capitals in a given year. Doing so results in the measure state reachp,u,t for the grid cells of an Africa-wide raster with a 0.0417 decimal degree resolution for every year between 1966 and 2016 as depicted in Figure 1.
State reach in Africa, 1966–2016.

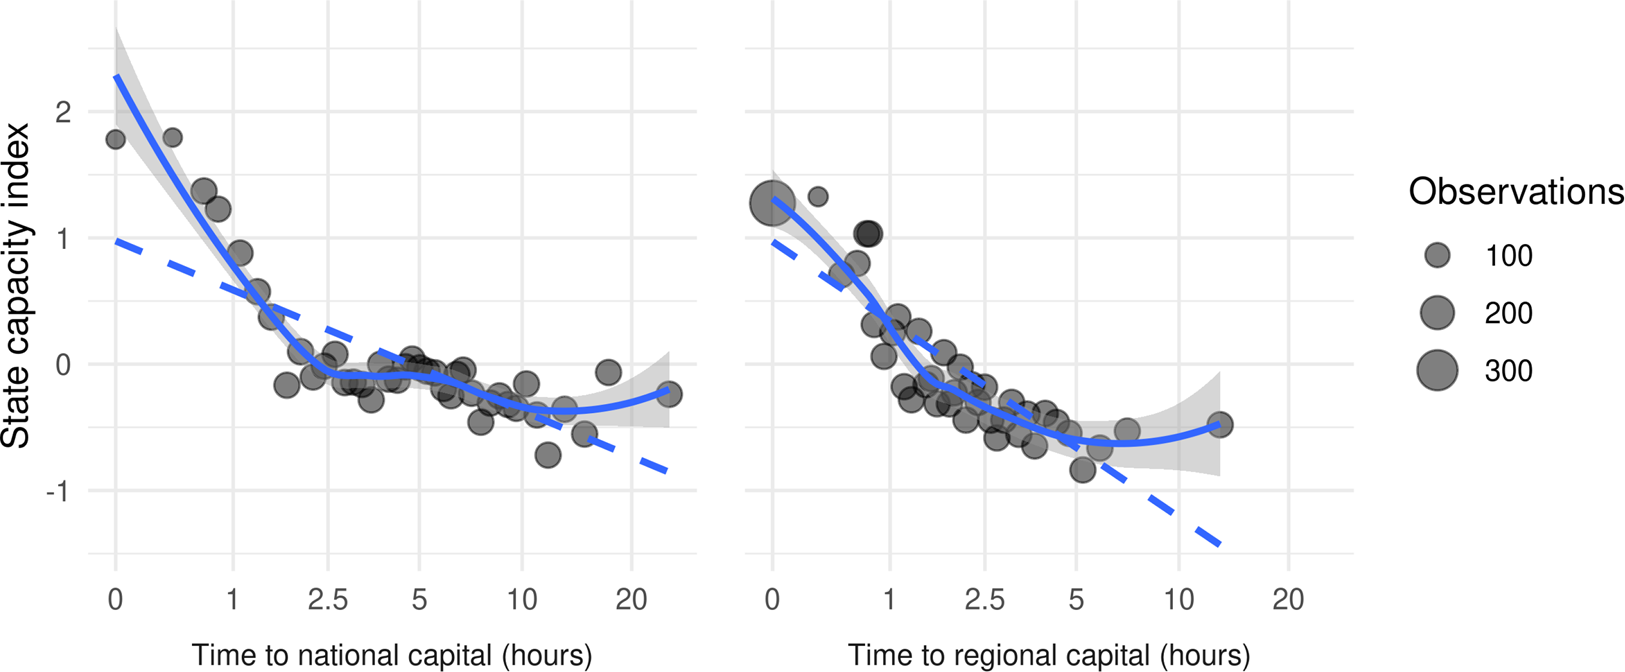
I validate the data as a proxy for local state capacity using a state capacity index constructed from data on Afrobarometer's (2018) enumeration areas. The survey provides geocoded data on the presence of the police and military, post offices, schools, and hospitals, as well as public services such as water, sewage, and electricity. I aggregate this information via the first component of a Principal Component Analysis, capturing 36.2% of the data's variation. Figure 2 shows that travel times to capitals correlate strongly with the resulting state capacity index. Travel times also fit the index better than mere geodesic, as-the-crow-flies distances (Appendix C.1). In sum, travel times to capitals are a valid proxy of local state capacity.
Travel times to national and regional capitals and state capacity index. Values are demeaned by country × survey round and averaged within 40 x-axis quantiles.

3.1 State reach in Africa: weak, growing, and unequal
African states’ reach has increased since their independence (Figure 3). Travel times between national capitals and citizens have decreased from a 1966 average of 11.7 hours to 9.3 hours in 2016, a change of 20.3 percent. Travel times to regional capitals decreased from 5.1 to 3.5 hours.
Decreasing travel times to regional and national capitals in Africa 1960–2015. Population-weighted averages based on HYDE population estimates (Goldewijk et al., Reference Goldewijk, Beusen and Janssen2010) and travel times to capitals. (a) Average time to national capital. (b) Average time to regional capital.

Three trends underlie this development (Appendix C.2). First, administrative geographies have changed. Côte d'Ivoire, Nigeria, and Tanzania have relocated their national capitalsFootnote 9 and most governments have created new administrative regions (Grossman and Lewis, Reference Grossman and Lewis2014; Grossman et al., Reference Grossman, Pierskalla and Dean2017).Footnote 10 Second, transport infrastructure has improved, with quality-weighted mileage increasing by about 50 percent since independence. Lastly, many citizens moved closer to capitals as urbanization rates doubled from 20 to 40 percent (World Bank, 2018).
The maps in Figure 1 show that travel times to capitals exhibit substantive variation within and across countries. In contrast to small Rwanda, travel times to the DR Congo's capital Kinshasa vary between 0 and 50 hours, with a high median of 34.3 hours, reflecting the country's “difficult geography” (Herbst, Reference Herbst2000) and sparse infrastructure. Changes in travel times since 1966 are marked by similar variation. States and regions that seceded or relocated their capital experienced the largest improvements. These changes exhibit substantive spatial variation because changes in administrative geographies and road networks have spatially varying effects. My empirical strategy exploits this fact.
4. Data on local development
The empirical analysis examines whether changes in African states’ reach affected local development, measured with data on education, infant mortality, and nightlight emissions.Footnote 11 To measure primary education, I rely on the Demographic and Health Survey (DHS, 2018). The DHS encodes the educational achievement of all members of sampled households. Assuming that they live where they were raised, I model the level of education of 2.1 million individuals older than 15 as having been influenced by the travel time to their capitals at age 6. An “attended primary school” dummy serves as the main outcome, capturing the arguably most important component of educational services and avoiding the skewed distribution of individuals’ education levels.Footnote 12
The DHS also measures the under-1 mortality of 2.9 million infants born to women aged 15–49. I model infants’ deaths as depending on the travel time to their mothers’ capitals at their birth. Infant mortality and education rates exhibit local temporal variation because children and household members sampled in the same place have been born and schooled at different times. In modeling this variation, I assume that migration decisions do not respond to changes in state reach in a manner that correlates with the observed outcomes and show that results hold among non-migrants.
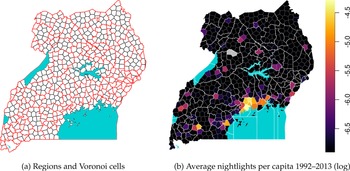
To mitigate the uneven survey coverage and counter concerns about migration biases, I also proxy local development with nightlight emissions (Weidmann and Schutte, Reference Weidmann and Schutte2017) derived from satellite images (1992–2013; National Geophysical Data Center, 2014). I measure nightlights within centroidal Voronoi cells (400 km2)Footnote 13 that are nested within administrative regions (Figure 4 and Appendix D.1). In contrast to quadratic cells that frequently overlap with (changing) administrative borders, travel times can be consistently aggregated to the Voronoi cells. Nightlights are log-transformed after adding a constant of 0.001.Footnote 14
Voronoi cells, regions, and nightlights in Uganda 1992–2013. Panel (a) plots all regional borders between 1992 and 2013 (red) and Voronoi cells (black). Unpopulated cells in (b) in grey.

5. Empirical strategy
The empirical analysis estimates the effect of travel times to capitals on local development. To account for any cross-sectional endogeneity from, e.g., strategic road, capital, and border placements and geographical confounders, I only study temporal variation in travel times and development within the same location:

where β 1 and β 2 are the effects associated with travel times to point p's regional and national capitals at time t. In parallel to weights ω u in Equation 1, the sum of β 1 and β 2 proxies the total effect of state capacity. The units of analysis i are individuals in the education and infant mortality analyses and Voronoi cells in the examination of nightlight emissions. DHS respondents i are nested in location p and year t.Footnote 15 p is synonymous with i where Voronoi cells are the units of analysis. The model controls for all constant attributes of locations/Voronoi cells, country-years, and surveys through fixed effects α p, λ c,t, and μ s. Individual-level controls X i in the education models consist of respondents’ sex, age, and its square. Infant mortality models include mothers’ age at birth and its square, infants’ birth-order, and its square, as well as female and twin dummies. I add no time-varying covariates to the baseline nightlight model. I cluster standard errors on the point and country-year levels.
Relying on this two-way fixed-effect estimator,Footnote 16 I assume that changes in travel times to capitals are exogenous to local development outcomes observed thereafter. Robustness checks account for potential violations of this assumption, in particular non-parallel trends, endogenous roadbuilding, spurious correlations with changes in economic market access, or potential omitted variables such as ethnic inclusion or civil war.
6. Results
The results show that reductions in travel times toward regional and national capitals are, first, robustly associated with increasing primary education rates. Second, infant mortality rates improve as travel times to national, but not regional capitals decrease. Lastly, nightlight emissions significantly increase with declining travel times to regional capitals. Their relation to changes in the time to national capitals is of roughly similar size but statistically more unstable. Interpreting the sums of β 1 and β 2 as total effect of state capacity reveals its consistently positive, meaningful, and statistically significant association with local development.
Table 1 presents the baseline results. Interpreting coefficients in substantive terms, Model 1 indicates that a reduction of travel times to national (regional) capitals from 2 to 1 hours is associated with a precisely estimated increase in primary education rates by 1.1 (0.54) percentage points. Model 2 shows that infant mortality rates decrease by 0.38 percentage points when the time to the national capital decreases from 2 to 1 hours. In contrast, there is no evidence for a meaningful association of infant mortality with regional capital accessibility. The respective coefficient is close to zero and statistically insignificant.
Changes in time to national/regional capital and local development

Notes: OLS linear models. Individuals are the units of the education and infant mortality analyses, Voronoi cells those of the nightlight analyses. Control variables for models with primary education as the dependent variable consist of responents’ age and age squared, as well as a female dummy. Where infant mortality is the dependent variable, models include an infant's mother's age at birth and its square, the birthorder and its square, as well as a female and twin dummy. Standard errors clustered on the point and country-year levels. Significance codes: *p < 0.1; **p < 0.05; ***p < 0.01.
Distinguishing the effects of relocations of national capitalsFootnote 17 from those of road network changes reveals that national capital relocations primarily drive the effects on education and infant mortality rates (Appendix E.1). Changes due to road networks have a smaller, but statistically significant effect on primary education and no effect on infant mortality.
Lastly, Model 3 yields a significant association of travel times to regional capitals with nightlight emissions. As the local distance to the regional capital decreases from 2 to 1 hours, per-capita nightlight emissions increase by 1.8 percent. The same change in the distance to its national capital is associated with a similar increase in nightlights, which is however affected by differential pre-trends (Appendix E.3). The estimate's noisiness is related to the short coverage of the data (1992–2013) with changes of national capitals in newly independent South Sudan (2013) and Eritrea (1992), each with only one pre-/post-treatment year. Thus, changes in road networks with their more diffuse impact on development drive the estimate.
Figure 5 presents the results of robustness checks fully discussed in Appendix E. First, I find that the effects of travel times to capitals hold among non-migrant DHS respondents. Second and evidence against reverse causality, I find no significant effect of differential pre-trends, except for those that affect the nightlight model. Third, the results are not caused by potentially endogenous road building accounted for by time-varying local road density-measures or by computing travel times on time-invariant road data from 1966. Fourth, a potentially spurious correlation of travel times to capitals with economic market access to the 1530 biggest African cities does not drive the results. Fifth, the results are not due to potential omitted variables, in particular ethno-political inclusion, exposure to ethnic civil wars, regional and national capital dummies, and population density controls. Lastly, Appendix E.6 demonstrates robustness across alternative outcome specifications.
Robustness checks. Coefficient estimates with 95 percent CIs.

These analyses suggest generally positive developmental effects of increases in state capacity as proxied by estimated aggregate effects of travel times to national and regional capitals. Where national and regional administrations move closer to the citizens they govern, education rates improve. Infant mortality rates increase with travel times to national but not regional capitals. Lastly, nightlights become brighter when regional capitals move closer. Pre-trends partially drive the developmental effects of closer national capitals on nightlights, raising concerns about reverse causality.
7. Conclusion
One important constraint of states’ capacity and their ability to foster development is their physical access to the population (Herbst, Reference Herbst2000). Measuring African states’ varying success in making their citizens accessible, this research note has introduced new spatio-temporal data on travel times between administrative capitals and citizens as a proxy for post-colonial state capacity. The new data show a generally positive association between increases in local state capacity on various indicators of citizens’ wealth and well-being. Difficult geographies with hard-to-access populations thus impede governance and economic development on the continent. At the same time, the results reject geographic determinism since states can and do improve their reach and thereby foster local development.
Offering new data and empirical results, this research note opens up avenues for future research. A first set of questions concerns the effects of state capacity on different state-provided goods and under different institutional settings. Second, there might be important heterogeneity in the mechanisms through which and when local state capacity matters most for citizens’ welfare. Crises such as droughts, floods, or violent conflicts may exacerbate the effects of weak statehood. Lastly, researchers could use the new measure of state capacity to study state–society interactions more generally, ranging from resource extraction, over accountability, to conflict processes.
Acknowledgements
I thank Lukas Dick and Benjamin Füglister for excellent research assistance. I am grateful to two anonymous reviewers, Lars-Erik Cederman, Robert H. Bates, Simon Hug, Philipp Hunziker, Horacio Larreguy, Clara Neupert-Wentz, Yannick Pengl, Ryan Saylor, and audiences at the APSA Annual Meeting 2019, the AFK workshop in Hamburg, and ETH Zurich for very helpful comments and feedback. I acknowledge support from the Swiss National Science Foundation under grant P0EZP1_165233.
Supplementary material
The supplementary material for this article can be found at https://doi.org/10.1017/psrm.2021.60.