I. Introduction
Wine is often the focal point of many discussions at social gatherings where, in addition to refreshment and relaxation, it often serves as a symbol of sophistication and knowledge. For many consumers, wine is also veiled in mystery and intrigue given the bewildering number of choices and decisions regarding brands, production regions, grape varietals, production year; numerous packaging attributes including labels, product descriptors, and package closures; and prices. Consumer perceptions of wine quality are also typically muddled because reliable quality information is often missing, ambiguous, limited, costly, or, when available, generally inconsistent across expert analysts (Hodgson Reference Hodgson2008, Reference Hodgson2009a, Reference Hodgson2009b).
Wine purchase decisions are similar to that of other highly differentiated consumer products for which quality information is not readily available. That is, consumers often resort to an evaluation of observable product characteristics—including both prices as well as physical product traits—as a proxy for quality expectations. Limited quality information and the relative opportunity costs of gathering it (especially for low-priced goods) requires consumers to quickly infer an expected quality level based on a product's observable characteristics and their perceptions about the correlation of those characteristics to quality. Then, they must decide how to incorporate those assessments into purchase decisions.
We use wine sales as means for evaluating revealed consumer choices when decision-making processes involve uncertain quality. We posit that when quality uncertainty exists, consumers will use observable product characteristics to establish an expected quality level. To test our hypothesis, we assess revealed prices-paid variation in consumer wine markets, because these markets are characterized by a high degree of product heterogeneity and high opportunity costs (relative to the product price) of acquiring reliable quality information. We use weekly Nielsen scanner-level wine purchase data—which represent revealed market outcomes rather than elicited consumer preferences—from ten large U.S. markets between 2009 and 2012. The data represent wine transaction prices in grocery stores and supermarkets, which account for approximately 70% of U.S. wine sales. However, because these retail locations typically provide little information about wine quality, consumers must assess expected quality and make purchase decisions based on this assessment.
We use wine sales scanner data to empirically investigate the dynamics between wine prices and expected quality by exploiting the variation in transaction prices of wines that have a specific, visible, and exogenously-determined product characteristic—a cork or a screw cap. The bottle closure characteristic is particularly useful because individual vintners determine the type of bottle closure during the bottling process based on a number of production cost factors, rather than demand signals from the retail market (Macku and Reed, Reference Macku and Reed2011). Additionally, direct grocery store consumer-to-vintner signals regarding bottle closure demand are opaque as a result of the historically-established U.S. wine supply chain system, which mandates a three-tier producer–distributor–retailer structure. The structure prevents producers from observing consumers' purchasing behavior based on detailed information such as packaging characteristics. Furthermore, retailers do not stock wines nor have sophisticated pricing strategies that are based on specific bottle closure types, and consumers cannot directly determine producers' or retailers' reasons for marketing wines with certain packaging traits. As such, the retail marketplace appears to consumers as offering a plethora of wine products with different closure types.
The identification provided by the U.S. wine distribution system and the relatively independent nature of vintners' decisions to implement a particular bottle closure allows us to empirically assess the extent to which wine characteristics affect consumers' purchase behaviors when product quality is uncertain. Specifically, we use pooled ordinary least squares (OLS) and quantile regressions to estimate reduced-form hedonic models of wine sales prices. The models control for numerous observable product attributes and include individual product-level fixed effects, which account for unobserved heterogeneity in product quality and other factors that may be specific to consumer expected quality assessments. That is, product-level fixed effects account for actual quality differences across wines, such that the estimated marginal effects of the bottle closure type indicate the extent to which consumers value this packaging trait as a signal of expected quality. Estimation of quantile regressions allows for an hedonic assessment of bottle characteristics across the price distribution, which provides an opportunity to evaluate whether bottle characteristics are differentially related to sales prices under the condition that prices may themselves act as quality signals.
We find that U.S. consumers pay, on average, 7.7% more (approximately $1.00 per bottle) for table wines that contain cork closures rather than screw cap closures. Additionally, we find this premium increases for lower-priced wines and decreases for more expensive wines. This suggests that for relatively low-priced wines—for which prices provide little or highly uncertain information of expected quality—consumers place more value on cork closures relative to the sales price. When choosing among competing products with relatively high prices—which reveal a higher degree of quality certainty—consumers tend to be more sensitive to differences in prices and place a lower relative value on observable product characteristics (i.e., closure type) that could be suggestive of quality differences.
II. Identification: The U.S. Wine Market Structure
In 2017, U.S. consumer food expenditures totaled $1.8–$2.0 trillion, with more than $200 billion spent on alcoholic beverages (USDA ERS, 2017). Wine consumption in the United States has almost doubled since 1996, and in 2012, the United States became the largest wine consuming country in terms of total volume. In 2016, U.S. wine consumption totaled 949 million gallons with an estimated retail value of almost $60 billion (Wine Institute, 2016). The United States produced 806 million gallons of wine in 2016, exported 133 million gallons, and imported almost one-third of total consumption. Wine and beer are the most widely available and most consumed alcoholic beverages in the United States (i.e., the proportion of beer and wine consumption is approximately the same (Jones, Reference Jones2013)).
A. Quality Uncertainty in the Retail Space
Within the table wine sector, a wide range of products, prices, packaging, varietals, sourcing, aging, and marketing strategies exist, and most wine consumers have limited information regarding wine quality and, at retail grocery stores, often make quick purchasing decisions. These quality information constraints occur because standardized systems for evaluating wine do not exist. While wine “experts” publish some quality ratings, they do so for only a small number of products each year. And, many stores do not provide quality information to consumers at the time a purchase decision is made. Moreover, wine consumer tastes and preferences are heterogeneous, change over time, and may differ from those of wine experts. These complications are especially pertinent for consumers of relatively low-priced wines sold at grocery stores, where nearly 70% of all U.S. wine sales occur and where little educational assistance is provided (Teague, Reference Teague2004; Zikmund and Babin, Reference Zikmund and Babin2007; Davis and Brown, Reference Davis and Brown2011).Footnote 1 Thus, most consumers must determine quality based on observable product characteristics, colloquialisms, experience, preconceptions, and other factors such as recommendations or brand loyalties. Consumers also likely use prices to develop quality expectations because actual wine quality depends on input quality and production technologies. Janssen and Roy (Reference Janssen and Roy2010) note that consumers are most likely to use prices as a signal of quality in product sectors where large variations in product quality result from differences in these two factors. Oczkowski and Doucouliagos (Reference Oczkowski and Doucouliagos2014) provide evidence of this behavior in wine markets.
One of the most obvious wine product characteristics that may influence consumers' quality perceptions, but which is exogenous to retail consumers' behavior, is the type of bottle container closure.Footnote 2 Several bottle closure mechanisms are used including natural corks, technical corks, synthetic corks, and screw caps. Each closure mechanism has advantages and disadvantages. Natural cork closures have been used to seal amphorae since at least the sixth century bc (Joncheray, Reference Joncheray1976), providing a nearly air-tight seal while allowing wine to develop its “characteristics.” Natural cork seals can fail, however, causing cork taint, oxidation, leakage, and deposits. While synthetic closures eliminate cork taint, they often cause wines to age more quickly and can create cork extraction problems. Screw caps, which have been increasingly used since the beginning of the 21st century, eliminate cork taint and reduce oxidation because they are lined with a tin/Saran™ product that includes a polyvinylidene chloride layer to inhibit oxygen transmission. The general consensus in the oenological literature is that screw caps preserve wine quality better than corks (e.g., see Mas et al., Reference Mas, Puig, Llado and Zamora2002; Godden et al., Reference Godden, Francis, Field, Gishen, Coulter, Valente, Høj and Robinson2001; Skouroumounis et al., Reference Skouroumounis, Kwiatkowski, Francis, Oakey, Capone, Duncan, Sefton and Waters2005).
Although wine bottle closures can have a substantial impact on wine quality, consumers generally lack knowledge about this research and may have relatively strong preconceptions about the link between closures and wine quality. For example, results from Brajkovich et al.'s (Reference Brajkovich, Tibbits, Peron, Lund, Dykes, Kilmartin and Nicolau2005) sensory panels showed that consumers were unable to delineate differences in wine attributes between natural cork and screw cap closures. However, Marin and Durham (Reference Marin and Durham2007) found that consumers expected to pay less for a bottle of wine that contained a screw cap relative to a corked wine. Thus, the closure mechanism affected expectations of wine prices indirectly through consumer perceptions of wine quality. These results appear to indicate that consumer preferences run counter to oenological research: while screw caps provide a more consistent preservation of wine quality, consumers perceive this type of closure as a signal of lower quality, or at least, a poorer wine experience.
B. Independence of Consumers' Purchase and Vintners' Bottle Closure Decisions
While economic research on bottle closures is somewhat limited in scope and reliant on stated rather than revealed preference data, the findings suggest that bottle closure choices can affect consumer perceptions of quality. Bottle closures can provide a particularly useful identification for testing consumer perceptions because of the relatively large initial fixed costs for firms to switch to screw cap closure technologies and the complexity of the wine marketing channel. These create sufficient temporal and information transfer separation between consumers' retail purchasing behaviors and wine makers' bottle closure decisions.
There are several reasons to conclude that vintners' bottle closure choice is exogenous to consumer purchase decisions. First, wine bottlers' decisions to use corks or screw caps depend on numerous personal and technical factors, but often financial trade-offs have the largest influence on the decision-making process (Macku and Reed, Reference Macku and Reed2011). Typically, screw caps are significantly less expensive per unit than corks, regardless of whether the corks are natural or synthetic. In bulk, screw cap prices are $0.30–$0.50 lower than corks, which represents a 25–85% reduction in bottle closure costs.Footnote 3 However, changing closure methods requires large fixed startup costs. Cork closure techniques are well known, new and used cork closure equipment is widely available, and there is a large supply of professionals for adjusting and repairing this equipment (Macku and Reed, Reference Macku and Reed2011). Screw cap equipment is relatively new and can, therefore, have higher initial bottling equipment acquisition costs as well as higher monetary and opportunity costs for operation and maintenance. Therefore, a large component of the decision to use cork or screw cap bottle closures is driven by supply-side considerations rather than as a direct response to demand-side signals.
Second, a three-tier alcohol marketing and distribution system almost certainly eliminates direct interdependence between consumer purchase decisions and bottle closure choice.Footnote 4 This structure requires producers to sell alcohol products to wholesale distributors, who then sell to retailers; only retailers are permitted to sell products to consumers. For many grocery and alcohol beverage retailers that are part of regional or national chains, product procurement decisions are even further removed from local consumer behavior because most store stocking decisions are centrally managed.Footnote 5 The choice of wines to procure and pricing strategies are also largely made without particular attention to bottle characteristics. Goodman (Reference Goodman2010) found that profit margins and ease of dealing with upstream suppliers were consistently ranked as the most important influences on retailers' wine stocking decisions.Footnote 6
Third, the three-tier marketing system and the relatively limited opportunities for retailers to actively respond to local consumer purchase behaviors largely mutes the potential contemporaneous interdependence that may exist between consumers and wineries. That is, many producers make bottle closure decisions independently of market signals because the three-tier distribution structure constrains sophisticated, detailed signals—such as final-use consumers' responses to bottle closures—to be communicated to producers (i.e., any changes in contributors' demand for certain wines would appear as a random process vis-à-vis bottle closures). Similarly, consumers purchasing wine at a retail location cannot directly determine producers' reasons for choosing a particular bottle closure type (i.e., bottle closures appear as random assignments across a selection of products). As such, bottle closures provide appropriate identification to estimate demand-side responses perceived quality indicators.Footnote 7
In summary, the highly regulated and complex nature of the U.S. wine distribution channel provides natural, sufficient informational and temporal separation between bottling and final purchase decisions. That is, at the time of a final retail purchase by a consumer, firms' bottle closure choices have already been made, and thus, cannot be affected by the behavior of the final consumer. Econometrically, this would imply that the contemporaneous error terms would not be correlated with the pre-determined decisions made in the distribution process. Arguably, the decision regarding closure type is also made by wineries many months, if not years, before a wine is sent to a wholesaler, then to a retail location, and finally, purchased by a consumer. As noted by Anderson and Hsiao (Reference Anderson and Hsiao1981) and later by Arellano and Bond (Reference Arellano and Bond1991), decisions occurring at a sufficiently distant time are likely uncorrelated with contemporaneous error terms.Footnote 8
III. Data and an Empirical Model of Wine Purchases
We estimate the relationship between wine sale prices and observable wine product characteristics using data obtained from the Nielsen Beverage Data Network, which provide weekly scanner-level wine sales data from grocery stores and supermarkets that have total annual sales of at least $1 million. These data are then aggregated to a regional level using Nielsen-defined geographic regions termed Scantrack Syndicated Major Markets (SSMMs). The data represent ten geographically-dispersed SSMMs—Atlanta, Boston, Chicago, Dallas, Los Angeles, Miami, New York, Phoenix, San Francisco, and Seattle—between September 2009 and August 2012. These ten markets were chosen to provide geographically diverse consumer bases and are each among the largest 15 U.S. metropolitan areas according to the 2010 U.S. Census. For each SSMM, the scanner data provide information regarding a wine's name, grape varietal, country of origin, packaging type and size, bottle closure type (cork or screw cap), and average weekly price for that wine across grocery stores and supermarkets within an SSMM.Footnote 9
The original data set consists of more than 2 million observations. To minimize outlier bias, we exclude certain categories of sales from our empirical assessment. First, we exclude wine sales that occurred during promotions or sold at promotional prices. Second, we only consider wines that are sold in 750 milliliter bottles (which accounts for 81% of the sample) and those that are sold at prices equal to or less than $30 per bottle. The latter condition is imposed for several reasons. Over 94% of wines sold in U.S. grocery stores were priced at or below $30 per bottle, indicating that most consumers do not purchase more expensive wine products at such outlets.Footnote 10 Our objective is to evaluate decisions of “casual” wine consumers who are likely to have a limited understanding or, perhaps, limited interest in differentiating wine quality and rely on various observable characteristics as a signal of quality. Additionally, almost no wines with screw caps (0.3% of the sample) were sold at a price that exceeded $30 per bottle, making it difficult to evaluate variation in this observable characteristic. We supplement the wine purchase data with SSMM-level information about numbers of consumers, average incomes, and consumers' expenditures on food and alcohol products from the Bureau of Labor Statistics Consumer Expenditure Survey.Footnote 11
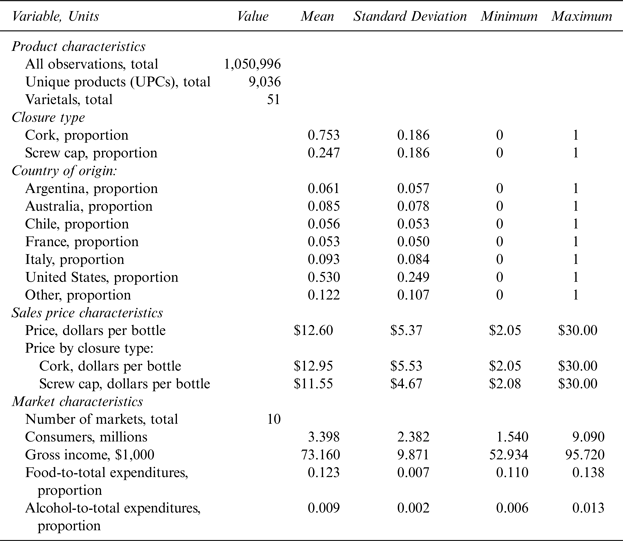
Table 1 presents descriptive statistics for our sample. After organizing the data as noted earlier, we retained more than 1 million wine purchase observations that represent more than 9,000 unique products (measured using universal product codes (UPCs)) purchased at grocery stores in ten markets.Footnote 12 Approximately 53% of these wines were produced in the United States, with Italian and Australian wines representing the next largest sources. Each of the ten markets has, on average, 3.34 million consumers with a relatively high gross (pre-tax) per capita annual income of $73,000. Between 2009 and 2012, these consumers spent approximately 12% of their total annual expenditures on food and just under 1% on alcoholic beverages. Across the ten markets, the variation in expenditures on food and alcohol is relatively low.
Descriptive Statistics for Wine Purchase Data, September 2009–August 2012

Notes: UPC is the acronym for Universal Product Codes. Wine characteristic and observed price at purchase are from AC Nielsen Scantrack data. Markets represent Scantrack Syndicated Major Markets (Atlanta, Boston, Chicago, Dallas, Los Angeles, Miami, New York, Phoenix, San Francisco, and Seattle), which are defined by AC Nielsen. Consumer characteristics are from the Bureau of Labor Statistics' Consumer Expenditure Survey data. The standard deviation for the binary variables is calculated as Std = p(1 − p), where p is a variables proportion in the sample.
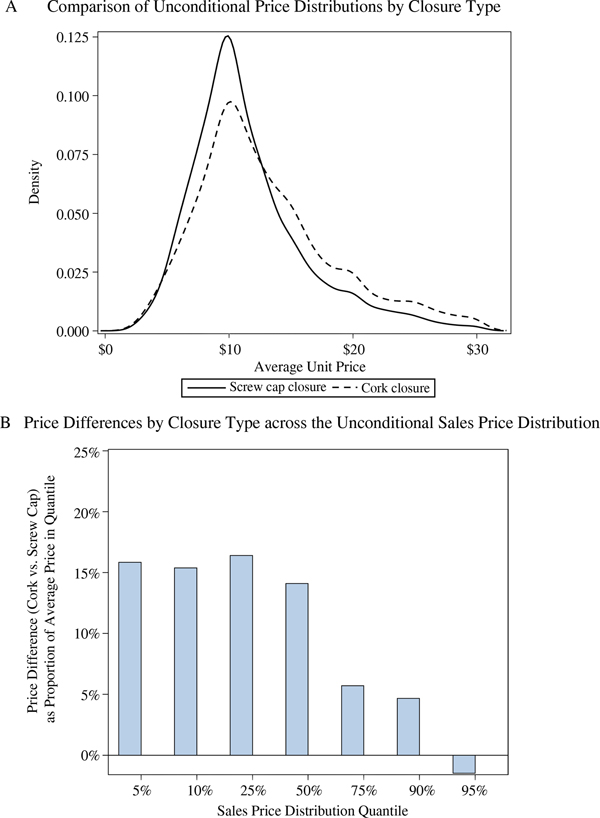
For wines that sold for less than or equal to $30 per bottle, the average price was $12.60 per bottle. Across these wines, approximately 75% had a cork closure and 25% had a screw cap closure. The average sales price of wines with cork closures is $12.95 per bottle, while wines with screw caps were sold for an average of $11.55 per bottle. Figure 1 provides a visual summary of the unconditional sales price distributions by closure type. Figure 1(A) shows that, in general, the sales price distributions for both closure types have similar shapes, but a higher likelihood that higher-priced wines have cork closures. Figure 1(B) shows that for lower-priced wines (those below the first price quartile), the relative difference in the prices of wines with a cork and screw cap closure is more than 15% of the quartile's average sales price. However, price differences gradually decrease for higher-priced wines. For the highest-priced wines, the data in our sample suggest that corks may even be marginally discounted. This provides some initial evidence that consumers' evaluation of expected quality (as measured by the closure type) is related to product price.
Properties of the Wine Sales Price Distribution

As a means for quantifying the difference between the value of wine which contain corks versus screw cap closures, we use a reduced form, hedonic model of the natural logarithm of the average sales price for wine i in market j in week t:
 $$\ln p_{ijt} = \; \beta _0 + \beta _1Cl_{ijt} + {\bi W}_{\bi i}{\bi \beta }^{\bi W} + {\bi H}_{\bi t}{\bi \beta }^{\bi H} + {\bi D}_{{\bi jt}}{\bi \beta }^{\bi D} + \theta _i + \varepsilon _{ijt}\; .$$
The natural logarithm transformation is used because the unconditional price distribution is skewed to the left, which is common in data that measure hedonic price characteristics. Each observation p ijt represents a weekly (t) average price for a specific wine product (i) sold at grocery stores (with annual sales of more than $1 million) that belong to the Nielsen Beverage Data Network in each market (j). The term Cl ijt represents the binary variable of interest that specifies whether a bottle has a cork or screw cap closure. The vector Wi contains binary variables that describe a wine's country of origin (Argentina, Australia, Chile, France, Italy, and all other countries excluding the United States) and the grape varietal. The term Ht represents a vector that contains binary variables for weeks during which major U.S. holidays occur and during which differential food and beverage consumption is likely (Valentine's Day, St. Patrick's Day, Cinco de Mayo, Mother's Day, Memorial Day, Fourth of July, Labor Day, Thanksgiving, Christmas, and New Year's). The vector Djt in Equation (1) has two components. The first contains market-level consumer characteristics that include the natural logarithm of the number of consumers, mean household income, the proportion of household income spent on food, and the proportion of household income spend on alcoholic beverages. The second component consists of market-level binary indicators (ten markets) that help account for other differences across markets that may not be captured by the consumer characteristics.
Finally, θ i represents product-level fixed effects that account for other unobservable factors that may influence consumers' decisions to purchase a specific wine at a particular price, such as bottle shapes, noticeable brand names or taglines, printed vineyard or winery histories, and previous purchase experience. Additionally, it is important to re-emphasize that even though quality differences may exist among wines, consumers rarely know about these explicit differences because the information simply may not exist for many wines (e.g., wine quality experts only assess a small subsection of each year's wine supply) and that information is often not displayed by grocery stores.Footnote 13 As such, the product-level fixed effect controls for perceived quality differences, any actual quality differences that are either signaled to a consumer or remain unknown, and potential selection bias that may arise due to, for example, certain varieties or wineries being more likely to have corks or screw caps.
Using Equation (1), we estimate a pooled OLS estimator with heteroskedasticity-robust standard errors that are clustered at the SSMM level. Because we control for unobservable product-level differences such as actual quality, the estimated coefficient β 1 quantifies the extent to which consumer perceptions regarding wine quality are based on closure type and manifest in realized price differences. That is, if the average marginal effect associated with the two observable closure types is not statistically different from zero or the difference approximately represents the cost savings of using caps, then the hypothesis would be rejected. Otherwise, the empirical results would support the hypothesis that for relatively low-priced, highly heterogeneous products for which quality is uncertain, consumers use observable product characteristics to evaluate expected quality and incorporate that valuation in their willingness to pay.
We also examine potential differences in the marginal effects across the conditional distribution of revealed sales prices. One approach would be to subsample the dependent variable, lnp ijt, into φ-number of quantiles and estimate a pooled OLS regression within each quantile. However, Hausman and Wise (Reference Hausman and Wise1977) and Heckman (Reference Heckman1979) show that this results in a φ-number of truncated distributions, for which OLS estimators would yield marginal effects that are biased and inefficient. Furthermore, more complex estimators may lead to incorrect insights because relevant information would be omitted during the subsampling process.
Instead, we use quantile regressions (Koenker and Bassett, Reference Koenker and Bassett1978). This approach is also used by Constanigro, McCluskey, and Goemans (Reference Constanigro, McCluskey and Goemans2010), who exploit the variation in revealed wine purchase decisions across a distribution of prices and observable product characteristics. Quantile regressions estimate marginal effects at different quantiles of the conditional price distribution, but do so through a weighting algorithm (rather than subsampling) that assigns different weights and a different conditional quantile function for each φ th sample quantile. We estimate quantile regressions using the simplex algorithm (Barrodale and Roberts, Reference Barrodale and Roberts1973), which was adapted to the quantile estimator by Koenker and d'Orey (Reference Koenker and d'Orey1994). Standard errors are heteroskedasticity-robust and clustered at the SSMM level following Chamberlain (Reference Chamberlain and Sims1994) and Parente and Silva (Reference Parente and Santos Silva2016).
IV. Estimation Results
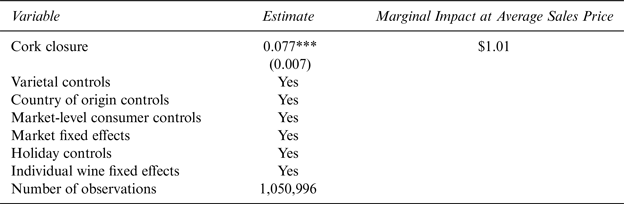
Table 2 presents the results for the pooled OLS regression of the natural logarithm of wine prices.Footnote 14 Because the dependent variable is natural-log transformed, the estimated parameter associated with the bottle closure type can be interpreted as an average proportional difference in observed purchase prices. Specifically, Table 2 shows that a bottle with a cork closure has, on average, a purchase price that is 7.7% higher than a bottle with a screw cap closure. Based on a mean sales price of $12.60 per bottle, the regression results indicate that consumers, ceterus paribus, pay approximately $1.01 per bottle more for wines that have cork closures. This estimate coincides with the results in Mueller and Szolnoki (Reference Mueller and Szolnoki2010), although our approach uses a larger, more geographically diverse dataset collected over a longer time period.
Parameter Estimates of Wine Purchase Pooled OLS Regression

Notes: Varietal controls are binary indicators of 50 different grape varieties. Country of origin indicators are included for Argentina, Australia, Chile, France, Italy, and all other countries excluding the United States. Market-level consumer controls include the number of consumers, mean gross income, the proportion of food expenditures to all expenditures, and the proportion of alcohol expenditures to all expenditures. Market fixed effects account for unobservable variation across 10 Scantrack Syndicated Major Markets (SSMMs). Holiday controls are binary indicators for ten major holidays (Valentine's Day, St. Patrick's Day, Cinco de Mayo, Mother's Day, Memorial Day, Fourth of July, Labor Day, Thanksgiving, Christmas, and New Year's). Standard errors are heteroskedasticity robust and clustered at the SSMM level. *** represents statistical significance at the 1% level. The marginal impact on the difference in sales price between a bottle with a cork closure relative to a bottle with a screw cap closure is evaluated at the sample mean price of $12.60 per bottle.
The market evidence suggests that consumers value the expected quality of wines with cork closures to be 7.7% higher than those with screw caps. That is, if the price of two wines was the same but bottle closures differed (while all other characteristics such as country of origin, grape varietal, market location, and other product-specific characteristics were otherwise identical), the expected quality of the bottle with the cork closure would be higher than that of the screw cap bottle closure. This result supports our original hypothesis that under quality uncertainty, wine consumers use observable product characteristics to develop an internal estimate of quality and its value. The result also indicates that U.S. wine consumers' internal valuation of bottle closures and wine quality runs counter to oenological research.
Consumers’ apparent willingness to pay a price premium for corked wines could also represent an effort to acquire implicit insurance against the possibility of purchasing a low-quality wine. That is, if a consumer is unaware of wine quality and believes that wines with cork closures are of better-quality than those with screw caps, they may decide to purchase the corked wine as an insurance option value. Because there is asymmetric information between vintners and consumers regarding quality (and that quality determination is heterogeneous), consumers may be unable to extract sufficient quality information based solely on price. Hence, other observable characteristics may be used to determine an actuarially-fair premium that would provide sufficient coverage against purchasing a low-quality wine. Our results suggest that consumers use wine bottle closure types to evaluate the expected risk of acquiring a low-quality product and are willing to pay approximately a $1.00 implicit insurance premium for bottles with a cork closure.
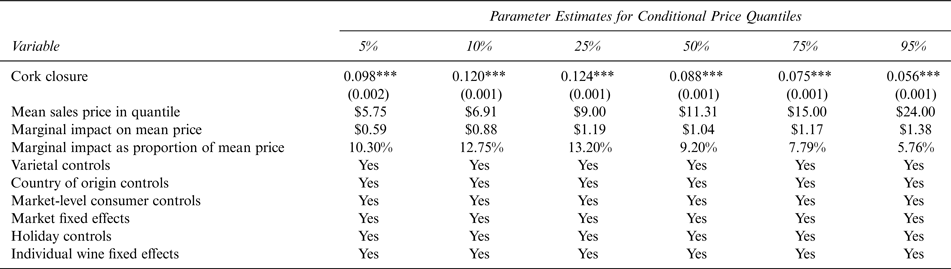
Table 3 presents the quantile regression results of the wine sales price models estimated across six quantiles of the conditional price distribution. The results indicate that consumers who purchased less expensive wines—those in the lower part of the conditional sales price distribution—paid a higher relative premium for wines with a cork closure than for bottles with screw caps. Specifically, revealed purchase decisions for wines priced in the 5th, 10th, and 25th quantiles of the sales price distribution showed that consumers paid between a 10.3% and 13.2% price premium for bottles with cork closures. However, for higher-priced wines, the relative premiums monotonically decreased. Price premiums for wines in the 50th, 75th, and 95th quantiles were 9.2%, 7.8%, and 5.7%, respectively. We follow Koenker and Machado (Reference Koenker and Machado1999) and find empirical support for concluding that estimated price premiums are statistically different across the presented quantiles.
Parameter Estimates of Wine Purchase Quantile Regressions

Notes: Varietal controls are binary indicators of 50 different grape varieties. Country of origin indicators are included for Argentina, Australia, Chile, France, Italy, and all other countries excluding the United States. Market-level consumer controls include the number of consumers, mean gross income, the proportion of food expenditures to all expenditures, and the proportion of alcohol expenditures to all expenditures. Market fixed effects account for unobservable variation across 10 Scantrack Syndicated Major Markets. Holiday controls are binary indicators for ten major holidays (Valentine's Day, St. Patrick's Day, Cinco de Mayo, Mother's Day, Memorial Day, Fourth of July, Labor Day, Thanksgiving, Christmas, and New Year's). Standard errors are heteroskedasticity robust and clustered at the SSMM level. *** represents statistical significance at the 1% level.
The quantile regression results indicate those consumers who are willing to pay higher prices for wine also place a lower value on cork closures. This result may reflect that these consumers intuitively understand that higher retail prices are likely correlated with production costs and, thus, higher quality. In fact, Janssen and Roy (Reference Janssen and Roy2010) suggest that higher-priced products are more likely to be associated with higher actual quality; in the context of wine markets, higher prices would, therefore, reduce the informational quality asymmetry between vintners and consumers. Consequently, purchase decisions of higher-priced wines—for which consumers are more likely to assess expected quality based on the product price—would be less heavily affected by consumers' valuation of other observable product characteristics.
V. Robustness Checks
In the main analysis, we place several constraints on the sample to evaluate consumer choice under uncertainty. Consequently, we perform a number of robustness checks to ensure that the empirical results are not sensitive to these assumptions.
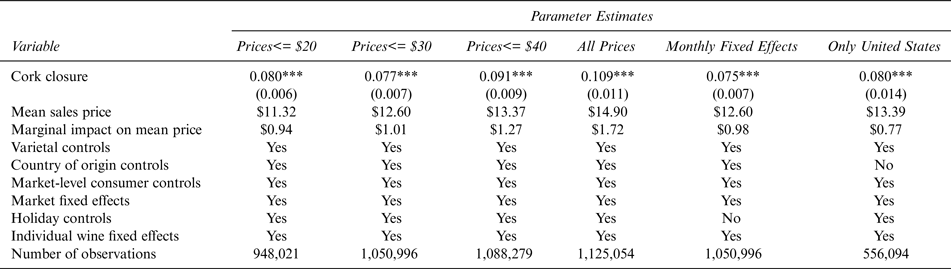
First, we test whether economic inferences are affected by the choice of the upper price threshold. For the main analysis, we evaluate products that sold for $30 per bottle or less. As a robustness check, we re-estimate Equation (1) using subsamples of products that sold for $20 or less, $40 or less, and finally the entire data set.Footnote 15
Our second robustness check incorporates monthly fixed effects in lieu of using major holiday indicators because some months of the year do not include one of the ten holidays considered. Thus, it is possible that some seasonal effects might not be controlled in the original estimation.
The third sensitivity analysis uses only wines that are produced in the United States. Imported wines may be viewed by consumers as being more “exotic,” but most of these imports also have cork closures (e.g., approximately 70% of wines imported from Europe, South America, and other smaller regions and 49% of wines imported from Australia have cork closures). Therefore, even though we control for a product's country of origin, it is possible that the novelty of purchasing an imported wine may confound the effect of a wine's closure type. Restricting the sample to only U.S. products provides an opportunity to evaluate this concern.
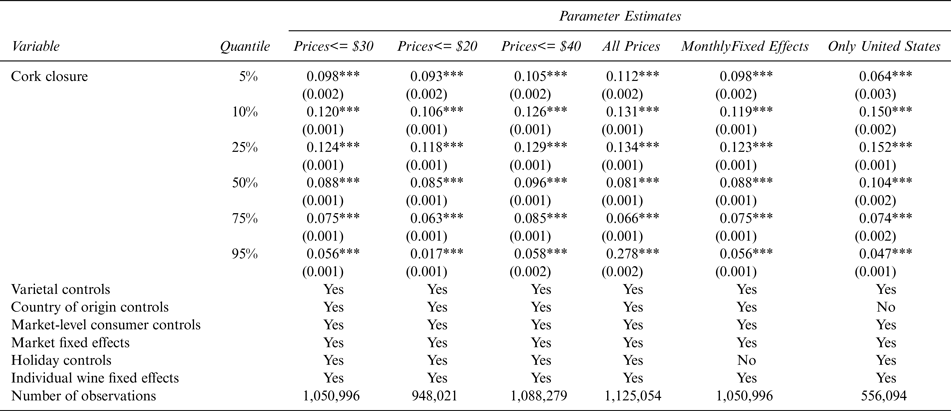
Tables 4 and 5 present the pooled OLS and quantile regression parameter estimates of the variable of interest—closure type—for the main model and the numerous alternative specifications. Comparisons of the average effect under alternative assumptions provide qualitatively similar inferences (Table 4). Across all quantiles, price premiums for bottles with cork closures ranged between 8% and 12%. Similarly, using monthly fixed effects in lieu of holiday indicators had no discernible impact on the parameter estimates, as was the case when restricting the sample to only U.S. wines.
Parameter Estimates of Wine Purchase Pooled OLS Regression under Alternative Specifications

Notes: Varietal controls are binary indicators of 50 different grape varieties. Country of origin indicators are included for Argentina, Australia, Chile, France, Italy, and all other countries excluding the United States. Market-level consumer controls include the number of consumers, mean gross income, the proportion of food expenditures to all expenditures, and the proportion of alcohol expenditures to all expenditures. Market fixed effects account for unobservable variation across 10 Scantrack Syndicated Major Markets. Holiday controls are binary indicators for ten major holidays (Valentine's Day, St. Patrick's Day, Cinco de Mayo, Mother's Day, Memorial Day, Fourth of July, Labor Day, Thanksgiving, Christmas, and New Year's). Standard errors are heteroskedasticity robust and clustered at the SSMM level. *** represents statistical significance at the 1% level.
Parameter Estimates of Wine Purchase Quantile Regressions under Alternative Specifications

Notes: Varietal controls are binary indicators of 50 different grape varieties. Country of origin indicators are included for Argentina, Australia, Chile, France, Italy, and all other countries excluding the United States. Market-level consumer controls include the number of consumers, mean gross income, the proportion of food expenditures to all expenditures, and the proportion of alcohol expenditures to all expenditures. Market fixed effects account for unobservable variation across 10 Scantrack Syndicated Major Markets. Holiday controls are binary indicators for ten major holidays (Valentine's Day, St. Patrick's Day, Cinco de Mayo, Mother's Day, Memorial Day, Fourth of July, Labor Day, Thanksgiving, Christmas, and New Year's). Standard errors are heteroskedasticity robust and clustered at the SSMM level. *** represents statistical significance at the 1% level.
The quantile regression results in Table 5 show that, in almost all cases, price premium patterns for cork closures over cap closures are qualitatively similar to those in the main analysis. The quantitative results in this table, however, should be interpreted with some care (especially when comparing results associated with alternative price threshold assumptions) because changing the size of the sample also alters the range of each quantile. Therefore, the primary focus should be on the qualitative consistency between estimates at different quantiles across each of the alternative modeling specifications. The only unexpected result is the large marginal effect for the 95th quantile (27.8%) when no restrictions are placed on the upper bound sales price. This result is likely driven by a few, very expensive wines (e.g., the maximum price observed in the data is $585 per bottle) and the fact that, within this upper quantile, almost no wines are sold with a screw cap closure.
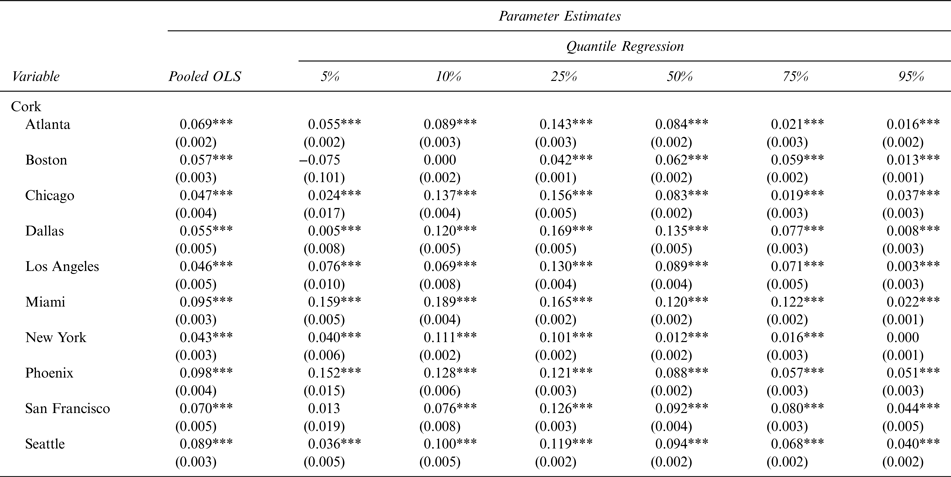
Next, we assess whether there is economically significant heterogeneity in the closure type parameter estimates when the model in Equation (1) is estimated separately for each of the ten SSMMs. While the main analysis includes binary variables to account for potential unobservable differences across markets, allowing for greater parameter estimate flexibility within each of the SSMM subsamples could identify potential misspecifications resulting from imposing improper modeling constraints. Table 6 shows the closure type parameter estimates for each SSMM across the pooled OLS and quantile regressions. The pooled OLS parameter estimates range between a 4.3% average premium for wines with a cork closure sold in the New York SSMM to a 9.8% average premium in the Phoenix SSMM. The parameter estimate ranges from the quantile regressions for each SSMM similarly resemble the qualitative consistency and relatively small quantitative range around the quantile regression estimates of the main analysis.
Parameter Estimates of Wine Purchase Pooled OLS and Quantile Regressions, by Market Subsample

Notes: Varietal controls are binary indicators of 50 different grape varieties. Country of origin indicators are included for Argentina, Australia, Chile, France, Italy, and all other countries excluding the United States. Market-level consumer controls include the number of consumers, mean gross income, the proportion of food expenditures to all expenditures, and the proportion of alcohol expenditures to all expenditures. Holiday controls are binary indicators for ten major holidays (Valentine's Day, St. Patrick's Day, Cinco de Mayo, Mother's Day, Memorial Day, Fourth of July, Labor Day, Thanksgiving, Christmas, and New Year's). Standard errors are heteroskedasticity robust. *** represents statistical significance at the 1% level. All regression include varietal, country of origin, market-level consumer, and holiday controls as well as market and individual wine fixed effects.
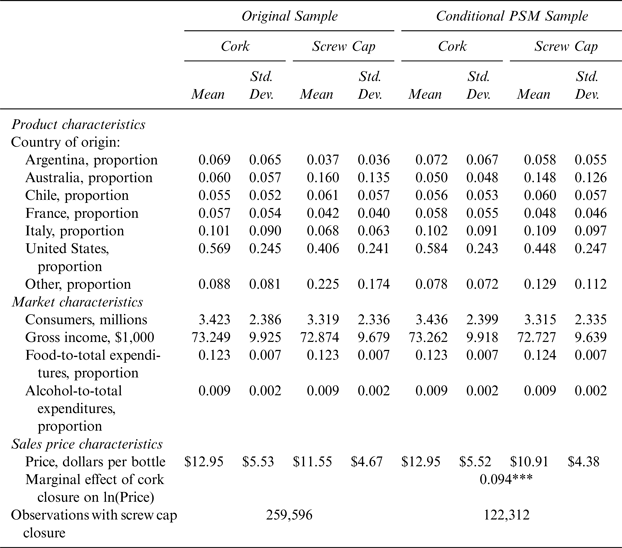
Finally, as an additional check for potential effects of endogeneity between sales prices and bottle closure types, we use propensity score matching (PSM) in an attempt to further reduce impacts of confounding factors on the estimated marginal impacts of bottle closures. Table 7 presents (abbreviated) summary statistics of the matched sample and the estimated marginal impact of having a cork closure for this sample.Footnote 16 The table shows that the characteristics of wines with cork and screw cap closures in the PSM sample are somewhat more balanced than in the original sample. However, in the PSM sample, the marginal effect of the cork variable on natural log of price is approximately 0.094, which translates to approximately a $1.16 average price premium. This is very similar to the $1.01 price premium we find in the original regression analysis, and provides suggestive evidence that the original estimate may reflect a floor rather than an overestimate.
Summary Statistics of Original and Propensity Score Matched Samples, by Closure Type

Notes: Wine characteristic and observed price at purchase are from AC Nielsen Scantrack data. Consumer characteristics are from the Bureau of Labor Statistics' Consumer Expenditure Survey data. The standard deviation for the binary variables is calculated as Std = p(1 − p), where p is a variables proportion in the sample. Full PSM results are available from the authors on request.
VI. Conclusions
Wine-purchasing consumers are faced with a bewildering number of products, and often do not know the quality of each. Acquiring product quality information can be costly and, thus, primarily involves developing expected quality assessment based on previous experiences, recommendations, hunches, labeling, observable hedonic characteristics, or some combination of these. We show that when the quality of competing products is not known, consumers use observable product characteristics to form quality expectations.
We empirically investigate the relationship between prices of competing products and observable product characteristics and their effect on consumer quality expectations and purchase decisions in wine markets—the poster child of a retail environment in which there is a large number of heterogeneous products with uncertain quality attributes. Specifically, we focus on the interaction of wine prices and wine bottle closures—corks and screw caps. Closure choices are made by vintners and are dependent on the availability and costs of closure technology, which makes this observable packaging characteristic exogenous when consumers make purchase decisions. Because quality uncertainty is often a factor in consumption decisions, our model provides a framework for evaluating how consumers use prices and observable product characteristics to make purchase choices.
We use more than 1 million observations from grocery stores across ten U.S. markets between September 2009 and August 2012. We focus on lower-priced wines—those with sale prices less than $30 per 750 milliliter bottle—to more accurately evaluate decisions of consumers for whom seeking additional information about wine quality is likely more costly than the benefits derived from that information. Using both pooled OLS and quantile regressions to estimate price premiums for bottles with corks or screw caps, we find that U.S. consumers are willing to pay, on average, approximately 7.7% more (about $1.00) for a bottle of wine that has a cork closure. In addition, we show that the size of this premium increases as wine prices decline.
Finally, by combining the fact that wine is often a component of romantic endeavors with our findings that lower-priced wines command higher premiums for bottles with cork closures (a perceived rather than actual signal of quality), we provide some empirical insights about the price of romance. However, unlike romantic endeavors that may be sparked by the consumption of low-priced wines, our results are highly resilient to robustness checks and model re-specifications.