INTRODUCTION
The biogeography of parasites and pathogens remains little studied compared with other groups of organisms, in spite of the implications in terms of global epidemiology and conservation (du Toit et al. Reference du Toit, van Vuuren, Matthee and Matthee2013; Wells et al. Reference Wells, O'Hara, Morand, Lessard and Ribas2015). The study of the geographic distributions of parasite species at various spatial scales and host groups can enhance understanding of the dynamics and evolution of parasite communities as well as the evolutionary and ecological processes that shape their diversity (Poulin and Mouillot, Reference Poulin and Mouillot2005; Whiteman and Parker, Reference Whiteman and Parker2005; Nieberding et al. Reference Nieberding, Durette-Desset, Vanderpoorten, Casanova, Ribas, Deffontaine, Feliu, Morand, Libois and Michaux2008).
The pattern of distribution and genetic diversity of a parasite species is shaped by the range of hosts in which a given parasite species occurs, i.e. host spectrum, as well as the interaction between several host and parasite traits such as parasite dispersal and life-cycle, host ecology and behaviour (Nieberding et al. Reference Nieberding, Durette-Desset, Vanderpoorten, Casanova, Ribas, Deffontaine, Feliu, Morand, Libois and Michaux2008; Poulin et al. Reference Poulin, Krasnov and Mouillot2011). The study of parasite infection parameters such as prevalence (the number of infected individuals in a population) and parasitaemia (the number of parasites in a single host individual), is the first step towards disentangling the relative contribution of these factors on parasite diversity and biogeography.
Parasite infection depends on the frequency of encounters between the two interacting partners, as well as the ability of the parasite to establish a successful infection and the host to tolerate or resist infection (Poulin, Reference Poulin2006). For parasites with complex life-cycles, parasitaemia and prevalence are also seen as indexes of parasite host-specificity. In this way, differences in these parameters can help to distinguish between principal and auxiliary hosts, with the principal host demonstrating the higher levels of these infection parameters (Poulin, Reference Poulin2005). There are, however, several host and parasite related-factors that should be considered when comparing patterns of infection between parasite lineages and host species (Morand and Poulin, Reference Morand and Poulin2003; Nieberding et al. Reference Nieberding, Durette-Desset, Vanderpoorten, Casanova, Ribas, Deffontaine, Feliu, Morand, Libois and Michaux2008). The first is host relatedness, since unrelated host species are more likely to differ in their immune defence mechanisms and require a higher adaptive effort for successful parasite establishment (Poulin and Mouillot, Reference Poulin and Mouillot2005). Therefore, parasite species that display complex lifecycles involving several host species must adapt to different host factors throughout their lifecycle. Another factor is ecology, because host–parasite interactions may differ when subjected to different habitat and environmental conditions (Wolinska and King, Reference Wolinska and King2009; Poulin, Reference Poulin2011). In fact, recent studies have shown that host ecology may be a major factor driving parasite differentiation in comparison with host phylogeny (De León and Choudhury, Reference De León and Choudhury2005; Poulin, Reference Poulin2005). In this perspective, host species with similar ecological requirements are likely to have similar parasite assemblages and patterns of phylogeographic co-structure (Nieberding et al. Reference Nieberding, Durette-Desset, Vanderpoorten, Casanova, Ribas, Deffontaine, Feliu, Morand, Libois and Michaux2008).
Compared with other vertebrate groups, reptiles are suitable models to investigate the influence of both ecology and host factors on parasite phylogeography and infection parameters; they have low mobility and usually have restricted geographic distributions, which can promote high speciation rates and adaptive potential (Camargo et al. Reference Camargo, Sinervo and Sites2010). In addition, reptiles are relatively easy to find, approach and capture in the field. Importantly, these characteristics allow the study of parasites in related and unrelated hosts in sympatric and allopatric conditions. However, there are relatively few studies in parasites of reptiles that examined these questions [but see (Schall, Reference Schall1992; Schall and Vogt, Reference Schall and Vogt1993)].
Apicomplexa are common parasites of reptiles and a highly diverse group, yet only a small percentage of all potential species have been formally described (Morrison, Reference Morrison2009). Indeed, recent studies have shown a great diversity of these parasites in reptiles from remote areas (Megía-Palma et al. Reference Megía-Palma, Martínez and Merino2013, Reference Megía-Palma, Martínez and Merino2014; O'Dwyer et al. Reference O'Dwyer, Moço, Paduan, Spenassatto, da Silva and Ribolla2013; Harris et al. Reference Harris, Borges-Nojosa and Maia2015; Tomé et al. Reference Tomé, Rato, Perera and Harris2016). This is the case of the Arabia Peninsula, where high levels of endemism and cryptic diversity have been reported for the herpetofauna (Mallon, Reference Mallon2011; Carranza and Arnold, Reference Carranza and Arnold2012; Cox et al. Reference Cox, Mallon, Bowles, Els and Tognelli2012; Vasconcelos and Carranza, Reference Vasconcelos and Carranza2014). Given the close association of parasites with their hosts and the influence of host ecology and evolution on parasite specialization (Clayton et al. Reference Clayton, Tamimi, Johnson and Page2003), it is possible that this extraordinary host diversity is associated with a similar or greater parasite diversity (Lafferty, Reference Lafferty2012; Kamiya et al. Reference Kamiya, O'Dwyer, Nakagawa and Poulin2014). However, such an assessment is still lacking.
In this study, we investigate host–parasite assemblages and infection patterns of Apicomplexa in herpetofauna from Oman, part of the Arabian Peninsula. Using both conventional and quantitative molecular approaches, we screened for haemogregarines and lankesterellids from several host species and genera from different geographical areas. Our sampling is representative of the known diversity of this region, as it includes more than 50% of the previously described species of geckos, snakes and amphibians known from this region (Gardner, Reference Gardner2013; Metallinou and Carranza, Reference Metallinou and Carranza2013; Badiane et al. Reference Badiane, Garcia-Porta, Červenka, Kratochvíl, Sindaco, Robinson, Morales, Mazuch, Price, Amat, Shobrak, Wilms, Simó-Riudalbas, Ahmadzadeh, Papenfuss, Cluchier, Viglione and Carranza2014; Metallinou et al. Reference Metallinou, Červenka, Crochet, Kratochvíl, Wilms, Geniez, Shobrak, Brito and Carranza2015; Šmid et al. Reference Šmíd, Martínez, Gebhart, Aznar, Gállego, Göçmen, De Pous, Tamar and Carranza2015; Vasconcelos and Carranza, Reference Vasconcelos and Carranza2014; de Pous et al. Reference de Pous, Machado, Metallinou, Červenka, Kratochvíl, Paschou, Mazuch, Šmíd, Simó-Riudalbas, Sanuy and Carranza2016; Tamar et al. Reference Tamar, Scholz, Crochet, Geniez, Meiri, Schmitz, Wilms and Carranza2016). The objectives of this study were to: (i) investigate the diversity, distribution and host range in Apicomplexa from Oman; (ii) estimate infection patterns (prevalence and parasitaemia levels) between host species and geographical areas; and (iii) evaluate host-specificity of parasite lineages based on infection parameters across host taxa.
MATERIALS AND METHODS
Sample collection
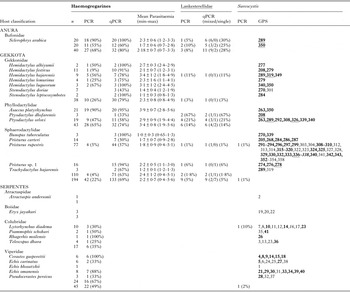
A total of 234 lizard and amphibian tissue and blood samples were collected in Oman in May 2011 and a total of 45 snake tissue samples were collected in Oman in October 2010 (six samples) and April/May 2013 (39 samples) (see Table 1). For each reptile individual a small tail tip was collected, and for each amphibian individual a toe clip was collected. Tissue samples from all individuals were preserved in 96% ethanol, and blood of geckos and amphibians was stored in Whatman filter paper and kept at −20 °C prior to molecular analysis. After processing, all individuals were released at the site of capture, which was registered using a GPS device. Based on the limited dispersal of reptile hosts, we grouped sampling locations in areas of 20 × 20 km2 (see Table S1 for more details).
Samples analysed for apicomplexan parasites in reptiles and amphibians from Oman

Prevalence is given for conventional and quantitative PCR (qPCR). Mixed infection with haemogregarines and lankesterellids were detected by qPCR. GPS refers to the exact location where the animal was collected given in Table S1. Numbers in bold indicate locations that were positive for haemogregarine infections, underlined indicate positive infections of Lankesterellidae, and italics indicate Sarcocystis infections. Sarcocystis was amplified using primers HepF300 and HepR900, known to amplify various apicomplexan parasites (Harris et al. Reference Harris, Borges-Nojosa and Maia2015).
DNA extraction, genetic diversity and phylogenetic analyses
DNA from geckos and amphibians was extracted from blood drops stored in Whatman filter paper using the Speedtools tissue DNA extraction kit (Biotools, Madrid), following the manufacturer's instructions, and DNA from snakes was extracted from tail-tip tissue stored in ethanol using a standard saline protocol (Sambrook et al. Reference Sambrook, Fritsch and Maniatis1989; Maia et al. Reference Maia, Harris, Carranza and Gómez-Díaz2014). In this paper, the extraction protocol differed for snakes, and therefore the infection parameters calculated for amphibians and geckos were not compared with those for snakes. This is important because the source material, extraction protocol and detection methods may affect parasite detection probability and quantitative estimates (Maia et al. Reference Maia, Harris, Carranza and Gómez-Díaz2014).
To estimate genetic diversity and the identification of new parasite lineages, PCR amplification was performed using the primers HepF300 (5′-GTTTCTGACCTATCAGCTTTCGACG-3′) and HepR900 (5′-CAAATCTAAGAATTTCACCTCTGAC-3′) (Ujvari et al. Reference Ujvari, Madsen and Olsson2004), targeting part of the 18S rRNA gene of apicomplexan parasites. Negative and positive controls were run with each reaction. The positive PCR products were purified and sequenced by a commercial sequencing facility (Macrogen Europe, Netherlands). All sequencing reactions were performed in both directions. Sequences were analysed using Geneious 6·1·6 (Biomatters). A similarity analysis using the Basic Local Alignment Search Tool (BLAST) to find the best match for the sequences against published sequences in GenBank. DnaSP v5 (Librado and Rozas, Reference Librado and Rozas2009) was used to estimate the number of haplotypes for individuals with no double-peak positions. Double-peak positions were identified in some individuals and these double peaks were resolved into two haplotypes by aligning them with the haplotypes found in this study (see Tables 2 and 3 and S3). Sequences for each individual were deposited in GenBank under the accession numbers KX453558-KX453648 for haemogregarines, KX453649-KX453660 for Lankesterella and KX453661-KX453662 for Sarcocystis (see Table S3 for more details on individual accession numbers). The number of variable and parsimony-informative sites, and genetic distances were calculated in MEGA v6·06 with complete deletion using Maximum Likelihood Composite Model (Tamura et al. Reference Tamura, Stecher, Peterson, Filipski and Kumar2013).
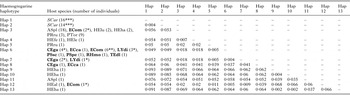
Estimates of evolutionary divergence between the thirteen haemogregarine haplotypes obtained in this study
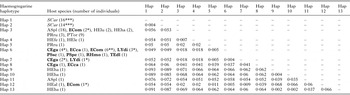
The number of base substitutions per site between sequences are shown. Analyses were conducted using the Maximum Composite Likelihood model (Tamura et al. Reference Tamura, Stecher, Peterson, Filipski and Kumar2013). There were a total of 557 positions in the final dataset. Evolutionary analyses were conducted in MEGA6 (Tamura et al. Reference Tamura, Stecher, Peterson, Filipski and Kumar2013). The first two capital letters indicate the genus and the last two letters the species of the host. Amphibian hosts are in italics and snakes hosts in bold. The number of individuals per host species for each haplotype is given in parenthesis (see Table S2). The number of asterisks represents the number of sequences derived from infections displaying double peaks (see Materials and Methods). For GenBank accession numbers refer to Table S3.
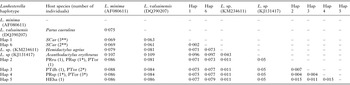
Estimates of evolutionary divergence between the six eimeriorinid haplotypes obtained in this study and published sequences

The number of base substitutions per site between sequences are shown. Analyses were conducted using the Maximum Composite Likelihood model (Tamura et al. Reference Tamura, Stecher, Peterson, Filipski and Kumar2013). There were a total of 545 positions in the final dataset. Evolutionary analyses were conducted in MEGA6 (Tamura et al. Reference Tamura, Stecher, Peterson, Filipski and Kumar2013). The first two capital letters indicate the genus and the last two letters the species of the host. Amphibian hosts are in italics. The number of individuals per host species for each haplotype is given in parenthesis (see Table S3). The number of asterisks represents the number of sequences derived from infections displaying double peaks (see Materials and Methods). For GenBank accession numbers refer to Table S3.
Parasites belonging to two distinct apicomplexan suborders were identified. To examine phylogenetic relationships in relation to biogeographic patterns, phylogenetic analyses were conducted for each group. No phylogenetic analyses were conducted for Sarcocystis because only two sequences were obtained; instead we provide the closest matches on GenBank. For haemogregarines we generated an alignment of 128 sequences with 559 bp in length, and for lankesterellids an alignment of 43 sequences with 605 bp in length. For each of these datasets, two phylogenetic analyses [maximum likelihood (ML) and Bayesian Inference (BI)] were conducted. jModeltest 0·1 (Posada, Reference Posada2008) with the AIC criterion was used to infer the best model of sequence evolution (i.e. TPM1uf + G for haemogregarines and for TrN + G lankesterellids). ML analyses were performed with RAxML v.7·0·3 (Stamatakis, Reference Stamatakis2006) using the GTR + GAMMA substitution model and reliability of the ML tree was assessed by Bootstrap analysis (Felsenstein, Reference Felsenstein1985) with 1000 replications. BI was implemented using Mr. Bayes v.3·1 (Huelsenbeck and Ronquist, Reference Huelsenbeck and Ronquist2001) with the models listed above and parameters estimated as part of the analysis. The analysis was run for 10 × 106 generations, saving one tree each 1000 generations. The log-likelihood values of the sample points were plotted against the generation time and all the trees prior to reaching stationarity were discarded. Remaining trees were combined in a 50% majority consensus tree (Huelsenbeck and Ronquist, Reference Huelsenbeck and Ronquist2001). Nodes were considered strongly supported if they received posterior probability (pp) support values ⩾ 0·95 (Huelsenbeck and Rannala Reference Huelsenbeck and Rannala2004). Dactylosoma ranarum (HQ224958) was used as an outgroup for haemogregarines (Barta et al. Reference Barta, Ogedengbe, Martin and Smith2012); Goussia noelleri (FJ009241) and Goussia neglecta (FJ009242) for lankesterellids (Morrison, Reference Morrison2009; Megía-Palma et al. Reference Megía-Palma, Martínez and Merino2014). All trees were displayed in FigTree v1·4·0 (http://tree.bio.ed.ac.uk/software/figtree/).
Host-specificity index
To calculate a host-specificity index for each haemogregarine haplotype obtained by conventional PCR we used the program TaxoBioDiv2 (http://www.otago.ac.nz/parasitegroup/Downloads/TaxoBiodiv2.zip) (Poulin and Mouillot, Reference Poulin and Mouillot2005). We only used samples for which the genetic haplotype was confirmed by conventional PCR. The STD considers the phylogenetic distance between hosts to infer the specificity of the parasites, for which the lower the value the higher the specificity; whereas the VarSTD measures the asymmetries in these distances between the host species exploited by the parasite, for which the higher the value the higher the asymmetry. The taxonomic distance in a Linnean taxonomic tree path length linking two host species (from Class, Order, Suborder, Family, Genus to Species) was used to calculate the specificity index. Haplotypes found in a single host species were assigned a STD value of zero (Poulin and Mouillot, Reference Poulin and Mouillot2005).
Real-time PCR detection and quantification
To estimate haemogregarine prevalence, parasitaemia and mixed infections of haemogregarine and eimeriorinid parasites, we conducted a quantitative molecular screening assay. The qPCR reactions were conducted using the primers JM4_F (5′-ACTCACCAGGTCCAGACATAGA-3′) and JM5_R (5′-CTCAAACTTCCTTGCGTTAGAC-3′) (Maia et al. Reference Maia, Harris, Carranza and Gómez-Díaz2014). To estimate the number of copies in unknown samples, raw qPCR results were exported using the program iQ5 R&D version 2.1 (Biorad) and the baseline threshold was determined individually for each plate using the algorithm implemented in LinRegPCR (Ruijter et al. Reference Ruijter, Ramakers, Hoogaars, Karlen, Bakker, van den Hoff and Moorman2009). To confirm the identity of qPCR positives, 23 were sequenced (five with double peaks and/or within the Eimeriorina range (83–85 °C) and 18 with melting temperatures in the haemogregarine range (81–82 °C). Eimeriorina peaks (83–85 °C, n = 5) matched known eimeriorinid sequences [e.g. Eimeria tropidura (AF324217), Lankesterella sp. (KJ131417) and Schellackia bolivari (KJ131416), with 99% identity]. These sequences were deposited in GenBank under GB accession numbers KX453535–KX453539 for eimeriorinids and KX453540–KX453557 for haemogregarines. In this study and for all subsequent analyses, haemogregarine and eimeriorinid estimates of infection for gecko and amphibian hosts refer to qPCR estimates.
Statistical analysis
Infection estimates obtained from qPCR (haemogregarine copy number) were log-transformed, using the formula log (x + 1), and square rooted to reach normality for statistical models. Homogeneity of variances was tested using the Bartlett test and normality was tested using the Shapiro–Wilk test.
To calculate differences in overall prevalence between species and amphibian localities we used Chi-square (χ 2) tests. We performed analysis of variance (AOV) using Tukey's post hoc tests to calculate differences in overall parasitaemia among gecko species, amphibian localities and haemogregarine lineages. In this study, haemogregarine lineages were defined as clusters of haplotypes that had more than 5% genetic divergence (see Table 2 and Fig. 5 for more details). For the gecko species Pristurus rupestris for which we had the most widespread sampling and in order to reduce the effects of low sample sizes, we excluded geographical areas with less than four samples and we investigated the effects of geographical area (20 × 20 km2) on parasite prevalence and parasitaemia levels.
For the analysis of prevalence we used Generalized Linear Models (GLM) implemented in the R package ‘MASS’ with binomial logit distribution, and a χ 2 test. For quantitative analysis of parasite load we used Linear Models (LM). The best models were selected using a step-wise selection based on AIC and BIC values.
Correlation between haemogregarine infection (i.e. infection status) and altitude was tested using Point-biserial correlation implemented in the R package ‘ltm’. The correlation between parasitaemia of haemogregarines and altitude was tested using the Spearman's rank correlation test. All analyses were conducted in R software version 1.3.0.
RESULTS
Diversity and host–parasite associations
In this study, we screened for Apicomplexa in a comprehensive range of host species from Oman that included 15 of the 36 previously known gecko species, 11 of the 19 non-burrowing terrestrial snake species and 1 of the 2 amphibian species (Table 1). From these hosts, a total of 105 sequences were obtained in this study using conventional PCR. Of those, 91 were more similar to haemogregarine (Adeleorina) sequences published on GenBank. Eight haplotypes were obtained for geckos (42 sequences), four for snakes (22 sequences) and two for Sclerophrys arabica (27 sequences) (Table S3). Of these, only one haplotype was shared between a snake species, Echis omanensis, and the gecko species, Assacus platyrhynchus, Hemidactylus luqueorum, Hemidactylus hajarensis, Pristurus rupestris and Ptyodactylus orlovi (haplotype 3). Genetic divergence estimates between the 13 unique haplotypes obtained ranged from 0·4 to 9·3% (Table 2).
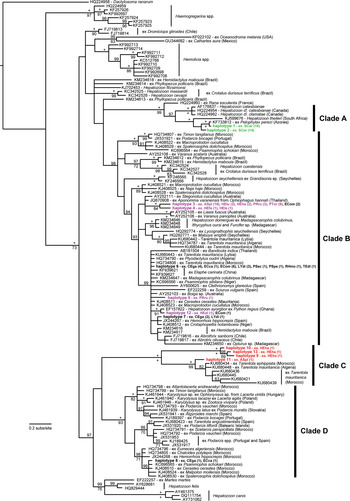
To investigate the phylogenetic relationships of the apicomplexan parasites from Oman in a broader context, we conducted phylogenetic reconstructions using the sequences obtained in this study together with published data for haemogregarines available in GenBank. The 18S rRNA gene haemogregarine haplotypes from Oman clustered in four main clades (Fig. 1). Haplotypes 1 and 2 were only found in Sc. arabica and these were placed in clade A together with sequences from amphibians from various geographical locations (Fig. 1). Haplotype 8 was placed in the Hepatozoon/Karyolysus clade D that parasitizes lizard and snake hosts (Fig. 1). Clade C (haplotypes 9, 10, 11 and 13), a clade composed exclusively of haemogregarines from gecko hosts, was sister taxa to this clade D. Haplotypes 6 and 7 from snakes and haplotypes 5 and 12 from geckos (the latter also found in a snake host, Table 2) were placed in clade B, together with other previously published Hepatozoon sequences obtained from lizards, snakes and rodents from various geographical locations (Fig. 1). Only haplotypes 6 and 12 were identical to Hepatozoon sp. from other snake hosts (e.g. KJ408511 and EF157822, respectively). Finally, haplotypes 3 and 4 were exclusive to reptiles from Oman and grouped together in a unique well-supported group (in clade B). Interestingly this clade was more related with haemogregarines from reptiles from Australia and Thailand (Fig. 1).
Tree derived from a Bayesian Inference analysis of the 559 bp fragment of the haemogregarine 18S rRNA gene. Bayesian Posterior probabilities are given above relevant nodes, and Bootstrap values for Maximum Likelihood below them. +indicate when support is 100. Colours represent the three main linages defined by clusters of haplotypes that had more than 5% genetic divergence between them (see Fig. 5). New snake haplotypes are shown in bold. New haplotypes include the host species and number of hosts found, as in Table 2. See Table S3 for more details on individual accession numbers.

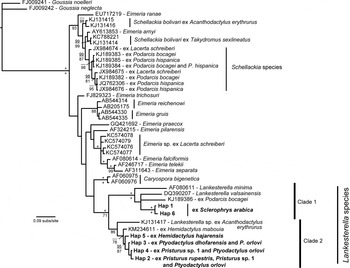
For Eimeriorina parasites, of the 14 sequences obtained, 12 matched Lankesterella (Eimeriorina: Lankesterellidae) and two matched Sarcocystis (Eimeriorina: Sarcocystidae) (Table S3). For lankesterellids, six haplotypes were obtained: two from amphibians and four from geckos, which clustered into two groups according to host (Fig. 2). These amphibians and geckos lankesterellids diverged by more than 7% of genetic distance (Table 3). Haplotypes 1 and 6 from Sc. arabica hosts were placed in clade 1 with Lankesterella minima (AF080611), Lankesterella valsainensis from the blue tit Parus caeruleus (DQ390207) and Lankesterella sp. from the lizard Podarcis bocagei from Portugal (KJ189386) (Fig. 2). In clade 2, Lankesterella sp. from the lizard Acanthodactylus erythrurus from Spain (KJ131417) and putative Lankesterella sp. from the gecko Hemidactylus mabouia from Brazil (KM234611) were basal to haplotypes 2, 3, 4 and 5 from gecko hosts (Fig. 2). Finally, the two Sarcocystis haplotypes from the gecko Pr. rupestris and the other from the snake Lytorhynchus diadema differed by 4% of genetic distance (588 bp). The closest GenBank matches for these sequences were: Sarcocystis lacertae (AY015113) with 99% identity and Sarcocystis gallotiae (AY015112) with 97% identity for the haplotype from Pr. rupestris; and Sarcocystis sp. from Didelphis virginianus from Mexico (KF278956) and Sarcocystis neurona from Martes pennanti (HQ709144) with 99% identity for the haplotype from L. diadema.
Tree derived from a Bayesian Inference analysis of the Eimeriorina 18S rRNA gene sequences of 605 bp in length. Bayesian Posterior probabilities are given above relevant nodes, and Bootstrap values for Maximum Likelihood below them. +indicate when support is 100. The new haplotypes from this study are in bold. See Table S3 for more details on individual accession numbers.

Host-specificity patterns
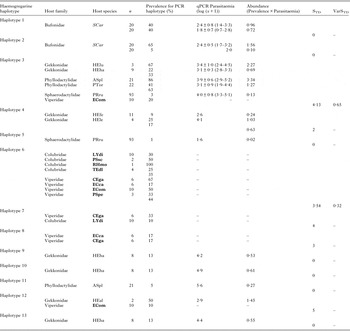
To investigate host-specificity of haemogregarine parasites from Oman, we examined the distribution patterns of the various parasite lineages described above, across host species. For this purpose, we considered host taxonomic distances (measure of STD, for which lower values indicate higher specificity) and the asymmetries in these distances (measure of VarSTD, for which higher values indicate higher asymmetries). Haplotype 5 from clade B and haplotypes 9, 10, 11 and 13 from clade C were detected in single host species and thus represent the highest indexes of host-specificity. Similarly, haplotype 4 displayed high host-specificity, since it was present in two congeneric host species, and has the lowest STD value among parasites found in more than one host species. At the other end of the spectrum, haemogregarine haplotypes 3 and 12 showed the lowest specificity (i.e. with the highest values of STD and of VarSTD) being present in hosts from different suborders (Table 4). The host species in which higher levels of prevalence and parasitaemia were achieved (i.e. principal host) was A. platyrhynchus for haplotype 3 and Hemidactylus alkiyumii for haplotype 12 (Table 4).
Host-specificity index for each haemogregarine haplotype obtained in our study. This index was calculated using program TaxoBioDiv2 and considers the taxonomic distance between two host species based on the branch lengths in a Linnean taxonomic tree (STD) and asymmetries in these distances (VarSTD). The first two capital letters indicate the genus and the last two letters the species of the host. Amphibian hosts are in italics and snakes hosts in bold.

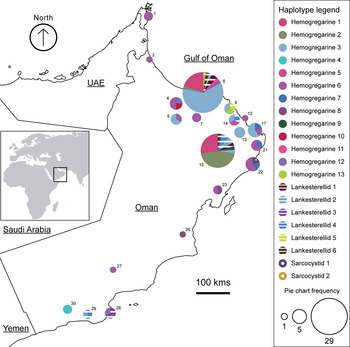
In this study, we consider prevalence as a proxy of host-specificity. For the less specific haplotypes, i.e. the two haplotypes found in a wide range of host species (haplotypes 3 and 6), we found a tendency of haemogregarine haplotype specificity at the host family level. In geckos, haplotype 3 reaches the highest mean prevalence in the Phyllodactylidae family (27 positives in 43 individuals, 63%), compared with Gekkonidae (four positives in 12 individuals, 33%, χ 2 = 2·221, d.f. = 1, P = 0·136) and Sphaerodactylidae (three positives in 93 individuals, 3%, χ 2 = 57·265, d.f. = 1, P < 0·001) (see Table 4). Furthermore, haplotype 6 that is exclusive to snakes, reaches higher mean prevalence in the Viperidae family (11 positives in 25 individuals, 44%) compared with the Colubridae family (six positives in 17 individuals, 35%), although differences were not significant (χ 2 = 0·060, d.f. = 1, P = 0·807) (Table 4). Haplotypes were distributed across sampling areas, as shown in Fig. 3.
Distribution of apicomplexan haplotypes obtained from reptiles in Oman represented in 20 × 20 km2 (see Table S1 for more details). Numbers indicate each area code.

Infection patterns across host species
To investigate the influence of host and ecological factors in parasite infection, we examined prevalence and parasitaemia of haemogregarines in several related and unrelated host species and between different geographical areas. In the case of geography, we restricted the analysis to the host species with the widest sampling, the sphaerodactylid gecko Pr. rupestris.
Prevalence
Overall prevalence of haemogregarine infections was high in all three host groups examined [80% for amphibians (one species), 69% for geckos (15 species) and 49% for snakes (11 species)] (Table 1). At the family level, in geckos we did not find significant differences in prevalence between Gekkonidae (79%), Phyllodactylidae (74%) and Sphaerodactylidae (69%) (χ 2 = 3·774, d.f. = 2, P = 0·152) (Table 1). In snakes, prevalence was higher in Viperidae (67%) than in Colubridae (35%) (although not significantly different, χ 2 = 2·778, d.f. = 1, P = 0·096) (Table 1). We detected haemogregarines in 24 of the 27 host species analysed. Species in which haemogregarines were not found, include Atractaspis andersonii (n = 1), Echis khosatzkii (n = 1) and Eryx jayakari (n = 3), and coincide with the host species with the lowest sample sizes in our dataset (Table 1). For comparisons at the species level, we selected host species with sampling size higher than 3. Prevalence of infection differed significantly between the nine gecko species compared (χ 2 = 24·098, d.f. = 8, P = 0·002), with the highest levels of prevalence found in A. platyrhynchus (95%), followed by Hemidactylus species (91% in H. festivus, 78% in H. hajarensis and 75% in H. lemurinus), Pt. orlovi (58%), Pristurus species (50% in Pr. carteri, 57% in Pr. rupestris and 94% in Pristurus sp. 1) and Stenodactylus doriae (43%) (Table 1). Prevalence was also significantly different between the five snake species (χ 2 = 13·483, d.f. = 4, P = 0·009), with the highest levels of prevalence found in Cerastes cerastes (100%), followed by Ec. omanensis (88%), Ec. carinatus (33%), L. diadema (30%) and Telescopus dhara (25%) (Table 1).
For Lankesterellids (Eimeriorina), prevalence was higher in the amphibian Sc. arabica (11 in 40, 28%) than in geckos (nine in 194, 5%) (χ 2 = 19·344, d.f. = 1, P < 0·005, Table 1). Cases of mixed infections with lankesterellids and haemogregarines were also higher in Sc. arabica (nine cases of mixed infections, in 11 total lankesterellid infected individuals, 82%) than in the gecko species examined (two in 9, 22%) (χ 2 = 4·900, d.f. = 1, P = 0·269, Table 1). In contrast, cases of single lankesterellid infections were higher in geckos (seven in nine, 78%) than in Sc. arabica (two in 11, 18%) (χ 2 = 4·900, d.f. = 1, P = 0·269, Table 1). Interestingly, Ptyodactylus species had the highest levels of eimeriorinid infections (67% for Pt. dhofarensis and 21% for Pt. orlovi, Table 1) compared with other gecko species.
At the species level, in Pr. rupestris we detected a significant effect of geographical area (GLM, d.f. = 7, χ 2 = 19·447, P = 0·007) (Table S2). In addition, there was a negative correlation between prevalence and altitude (Point-biserial correlation, ȓ p.b. = −0·21), with less infected individuals found at higher altitudes. In the amphibian species Sc. arabica, haemogregarine prevalence differed significantly between the two populations examined (χ 2 = 7·656, d.f. = 1, P = 0·006, Table 1).
Parasitaemia
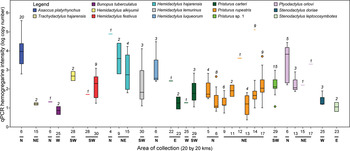
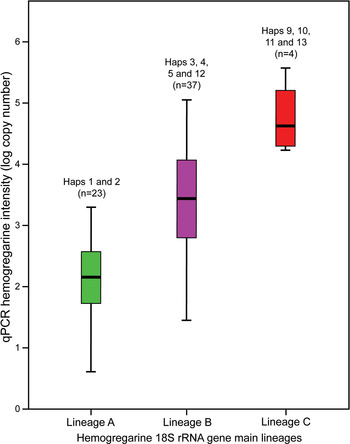
Overall parasitaemia of haemogregarine parasites differed significantly between gecko species (d.f. = 13, sum sq = 86·800, F = 9·433, P < 0·001) (Table S5). Assacus platyrhynchus, H. hajarensis, and Pt. orlovi had the highest parasitaemia levels compared with the gecko species of the genera Bunopus, Pristurus, Stenodactylus and Trachydactylus (Table S5 and Fig. 4). Additionally, we detected significant differences between parasite lineages (AOV, d.f. = 2, sum sq = 35·364, F = 27·491, P < 0·001, Fig. 5). Lineage C (specific to geckos) had the highest parasitaemia levels, followed by lineage B (also from geckos but genetically similar to sequences from other host taxa) and then lineage A (specific to amphibians) (Fig. 5).
Parasitaemia of haemogregarines estimated by qPCR represented for each host species and area of collection in 20 × 20 km2. Number of positive individuals per area is given above each plot and excludes mixed infections of haemogregarines and eimeriorinids.

Parasitaemia of haemogregarines, number of parasites in blood estimated by qPCR for 18S RNA gene main lineages (see Fig. 1). Number of individuals per lineage is provided and excludes mixed infections of haemogregarines and eimeriorinids and negative samples.

When looking at geographical differences in parasitaemia levels, in the sphaerodactylid gecko Pr. rupestris, we detected a marginal, but non-significant, effect of geographical area (LM, d.f. = 5, sum sq = 0·911, F = 2·110, P = 0·088) (Fig. 4). Furthermore, we did not detect a correlation between parasitaemia and altitude for this host species (Spearman correlation, ρ = 0·18, P = 0·256). Finally, in the amphibian species Sc. arabica, parasitaemia of haemogregarines was significantly higher in the population from Wadi Bani Khalid compared with the more western population (AOV, d.f. = 1, sum sq = 3·374, F = 8·346, P = 0·009), as it was observed for prevalence (Table 1).
DISCUSSION
This study provides the first molecular and quantitative assessment of apicomplexan diversity, host–parasite associations and infection patterns in herpetofauna from Oman through a phylogeographic perspective. Previous studies have identified apicomplexan parasites in reptiles from the Arabian Peninsula (Abd-Al-Aal, Reference Abd-Al-Aal1998; Al-Farraj, Reference Al-Farraj2008; Abdel-Ghaffar et al. Reference Abdel-Ghaffar, Bashtar, Al-Quraishy, Al Nasr and Mehlhorn2009; Abdel-Baki et al. Reference Abdel-Baki, Abdel-Haleem and Al-Quraishy2012, Reference Abdel-Baki, Al-Quraishy and Zhang2014) but, to our knowledge, our results represent the first molecular records of apicomplexan parasites in reptiles from Oman. In this study, we report haemogregarine (13 haplotypes), lankesterellid (six haplotypes) and sarcocystid (two haplotypes) parasites in a screening of 27 host species inhabiting several geographic areas in Oman. Importantly, our sampling is comprehensive, including more than 50% of the species of geckos, snakes and amphibians previously described in this region (Gardner, Reference Gardner2013; Metallinou and Carranza, Reference Metallinou and Carranza2013; Badiane et al. Reference Badiane, Garcia-Porta, Červenka, Kratochvíl, Sindaco, Robinson, Morales, Mazuch, Price, Amat, Shobrak, Wilms, Simó-Riudalbas, Ahmadzadeh, Papenfuss, Cluchier, Viglione and Carranza2014; Vasconcelos and Carranza Reference Vasconcelos and Carranza2014; Metallinou et al. Reference Metallinou, Červenka, Crochet, Kratochvíl, Wilms, Geniez, Shobrak, Brito and Carranza2015; Šmid et al. Reference Šmíd, Martínez, Gebhart, Aznar, Gállego, Göçmen, De Pous, Tamar and Carranza2015; de Pous et al. Reference de Pous, Machado, Metallinou, Červenka, Kratochvíl, Paschou, Mazuch, Šmíd, Simó-Riudalbas, Sanuy and Carranza2016; Tamar et al. Reference Tamar, Scholz, Crochet, Geniez, Meiri, Schmitz, Wilms and Carranza2016). Phylogenetic analyses show that some of these newly discovered parasites could be regarded as new taxonomic entities based on genetic divergence estimates. In particular, we corroborate the occurrence of a haemogregarine lineage that is exclusive to geckos (clade C), which was also recently found parasitizing Tarentola species from the Canary Islands (Tomé et al. Reference Tomé, Rato, Perera and Harris2016). Additionally, we report a well-supported lineage found exclusively in geckos from Oman (haplotypes 3 and 4) that is phylogenetically related with Hepatozoon spp. from snakes and lizards found in Australia and Thailand. More research is needed on these newly reported parasite lineages, as these may also represent new taxonomic entities.
High levels of cryptic diversity has been previously reported in avian malaria studies. In this case it has been suggested that parasite diversity may be influenced by the acquisition of new hosts followed by divergent selection between host lineages in sympatry (Ricklefs et al. Reference Ricklefs, Fallon and Bermingham2004, Reference Ricklefs, Outlaw, Svensson-Coelho, Medeiros, Ellis and Latta2014; Fallon et al. Reference Fallon, Bermingham and Ricklefs2005). While this could be the case for some parasite lineages of reptiles from Oman (e.g. haplotype 4 that infects two Hemidactylus species), haplotypes 3 and 6 were widely distributed across multiple species, suggesting low host-specificity and the possible occurrence of host-shifts (Bensch et al. Reference Bensch, Stjernman, Hasselquist, Ostman, Hansson, Westerdahl and Pinheiro2000). Related to this question, results of the host-specificity analysis revealed that the principal host for the haemogregarine haplotype infecting several gecko species (haplotype 3) was A. platyrhynchus, an Oman endemic gecko species that is restricted to the Jebel Akhdar (part of the Hajar Mountains in Oman). This pattern can be the result of post-colonization adaptation to A. platyrhynchus by an a priori generalist parasite. Alternatively it could be due to a more restricted distribution of this host species that led to parasite differentiation. However, the fact that this host species displays the highest values of prevalence and parasitaemia for this parasite haplotype supports the former hypothesis.
Studying infection parameters can provide important information about ecological and evolutionary factors shaping the phylogeography of host–parasite assemblages. For example, we expect to find more genetically similar parasite lineages between host species that are related to the principal host and a stronger signal of parasite differentiation in unrelated host species (Nieberding et al. Reference Nieberding, Durette-Desset, Vanderpoorten, Casanova, Ribas, Deffontaine, Feliu, Morand, Libois and Michaux2008). In agreement, infection levels in our study were associated with host similarity at the family level, but this specificity was lower at the lower taxonomic levels, genus and species. This supports previous evidence suggesting that haemogregarines from reptiles may be relatively generalist parasites that are able to infect a wide range of hosts, particularly when these hosts share a habitat. In Oman, hosts from different families are frequently found sharing habitats (Gardner, Reference Gardner2009; Carranza and Arnold, Reference Carranza and Arnold2012), thus the observed differences between host families could indicate that immunological and physiological differences at this level are sufficiently high to reduce parasite establishment in different host families. However, the differences we report are marginal and not significant and so the effect of other factors such as ecology or behaviour cannot be ruled out (Poulin, Reference Poulin2005). Our results highlight the need for a broader sampling at the population level, as well as other host groups present in Oman that were not included in our study such as lacertids, agamids and varanids, and neighbouring countries in the Arabian Peninsula to further investigate these effects.
Apart from host–parasite associations and specificity, we also examined the effect of host and ecological factors on the patterns of variation in infection parameters. In snakes we detected higher levels of infection in poisonous species (Viperidae) in comparison with non-poisonous species (Colubridae), although this was not significant, which is in accordance with previous studies (O'Dwyer et al. Reference O'Dwyer, Moço, Barrella, Vilela and Silva2003). This might be an indication of additional infections due to prey–predator transmission, as observed by detecting the same haemogregarine haplotype in Ec. omanensis and potential gecko preys. In geckos, we found significant differences in parasitaemia between species. Variation in this infection parameter is usually associated with host immunology (Klein, Reference Klein2004; Lindström et al. Reference Lindström, Foufopoulos, Pärn and Wikelski2004). Different host species can have different immune defence mechanisms that act to clear or tolerate infections. This may explain why some hosts were more heavily infected than others as well as the differences in parasitaemia we report between parasite lineages. It is particularly interesting that the highest levels of parasitaemia were detected in the recently reported lineage that is exclusive to geckos (lineage C found in A. platyrhynchus and H. hajarensis from Oman, and which is phylogenetically related to parasites found in Tarentola species from the Canary Islands (Tomé et al. Reference Tomé, Rato, Perera and Harris2016)).
When examining spatial patterns in infection parameters, we found differences in prevalence of infection between populations in Pr. rupestris and a negative correlation between prevalence and altitude. These differences in prevalence can result from species-specific microhabitat preferences, variation in the distribution, specificity and abundance of competent vectors, as well as host behaviour and subsequent differential exposure to parasites and vectors (Eisen and Wright, Reference Eisen and Wright2001; Ishtiaq et al. Reference Ishtiaq, Guillaumot, Clegg, Phillimore, Black, Owens, Mundy and Sheldon2008). Vector competence may decrease across unrelated hosts due to differences in immune defences of host species, which may result in heterogeneous parasite distributions (Krasnov et al. Reference Krasnov, Shenbrot, Mouillot, Khokhlova and Poulin2006). It is likely that the competence of arthropods vectors varies with altitude and microheterogeneity of the geographical areas (Bødker et al. Reference Bødker, Akida, Shayo, Kisinza, Msangeni, Pedersen and Lindsay2003; Tanga et al. Reference Tanga, Ngundu, Judith, Mbuh, Tendongfor, Simard and Wanji2010). Indeed, haemogregarines are heteroxenous parasites transmitted by arthropod vectors, which are especially sensitive to environmental conditions. At higher altitudes, climatic factors such as temperature, moisture and precipitation are known adverse conditions for larval development and survivorship of mosquito vectors of Plasmodium parasites (Van Rooyen et al. Reference Van Rooyen, Lalubin, Glaizot and Christe2013; Atkinson et al. Reference Atkinson, Utzurrum, Lapointe, Camp, Crampton, Foster and Giambelluca2014). Haemogregarines are characterized by having a wide range of vector hosts, such as mites, ticks, fleas and mosquitoes (Smith Reference Smith1996), although the spectrum of possible vectors for many Hepatozoon species remains unknown (Stekolnikov et al. Reference Stekolnikov, Carranza and Gomez-diaz2012). Given the scarcity of entomological records in remote regions such as Oman, making inferences regarding the role of vectors in the infection patterns of haemogregarines is difficult. In addition, although our sampling is representative in terms of major host groups and species, it is still limited at the population level if the aim is to draw conclusions about spatial factors on the patterns of parasite infection. Future research is needed to test the effect of the new haemogregarine lineages reported on various host species, as well as the influence of microhabitat characteristics and vector distributions in shaping parasite assemblages in Oman.
This study provides the first molecular assessment of apicomplexan parasites from Arabian reptiles. We investigated prevalence and levels of parasitaemia in various host species and geographic locations from Oman, which are representative of the reptile diversity and species richness in this region. Our results suggest that haemogregarine distribution may be influenced by host relatedness and ecology. However, further investigations are need at the population scale and encompassing other host groups. Although a number of studies have started to uncover the diversity of haemogregarines in wild populations, new unexpected lineages that might represent new genera or species continue to be detected. Given the great diversity of apicomplexan parasites detected in the reptile species used in our study, it would be important to screen other host groups. This could shed further light on the host spectrum and phylogenetic relationships of these and other, potentially unknown, lineages. Our results also highlight the need for future research on the vectors involved in transmission and that may influence the ecology and evolution of these parasites. Given that Arabia is a hotspot of endemicity for reptiles, our results are relevant not only in the context of their taxonomy, but can also have implications for conservation.
SUPPLEMENTARY MATERIAL
The supplementary material for this article can be found at http://dx.doi.org/10.1017/S0031182016001372.
ACKNOWLEDGEMENTS
We are grateful to Ali Alkiyumii and the other members of the Ministry of Environment and Climate Affairs of the Sultanate of Oman for their help and support and for issuing all the necessary collecting and exporting permits (Refs: 38/2010; 12/2011; 13/2013; 21/2013); to Felix Amat for participating in the 2010, 2011 and 2013 fieldtrips to Oman, Oman and to Saleh Alsaadi, Ali Alghafri, Philip de Pous, Sultan Khalifa, Margarita Metallinou, Marc Simó-Riudalbas, Jiri Ŝmid, Roberto Sindaco and Raquel Vasconcelos for participating in the 2013 fieldtrips to Oman; and to Michael Robinson for logistic support in Oman in 2010–2011. Thanks also to the two anonymous reviewers for their helpful comments on an earlier draft of this manuscript.
FINANCIAL SUPPORT
J. P. M. was funded through a Ph.D. grant (SFRH/BD/74305/2010) supported by a Fundação para a Ciência e a Tecnologia (FCT) doctoral fellowship under the Programa Operacional Potencial Humano – Quadro de Referência Estratégico Nacional funds (POPH-QREN) from the European Social Fund (ESF) and Portuguese Ministério da Educação e Ciência. E. G. -D. was supported by a Juan de la Cierva contract from the Ministerio de Educación y Ciencia, Spain. Financial support was provided by project ERG-PARIS-276838 from the European Commission. D. J. H. was supported by FEDER through the compete programme, the project ‘Genomics and Evolutionary Biology’ co-financed by North Portugal Regional Operational Programme (ON.2) under NSRF through the European Regional Development Fund. S. C. was supported by grant CGL2012-36970 from the Ministerio de Economía y Competitividad, Spain (co-funded by FEDER). The funders had no role in study design, data collection and analysis, decision to publish, or preparation of the manuscript.