1. Introduction
Improving public acceptability is beneficial for the implementation of climate policies (Klenert et al., Reference Klenert, Mattauch, Combet, Edenhofer, Hepburn, Rafaty and Stern2018; Maestre-Andrés et al., Reference Maestre-Andrés, Drews, Savin and van den Bergh2021). Carbon pricing, a key tool in reducing carbon emissions, has gained significant attention from both policymakers and researchers. Carbon pricing policies, including carbon taxes and carbon trading, would increase the prices of high-carbon goods and services relative to low-carbon goods and services, which stimulate the use of clean energy by inhibiting carbon-intensive behaviors among consumers and producers, and the income obtained from pricing can be used to subsidize firms to carry out technological innovation, thereby reducing carbon dioxide emissions (Nordhaus, Reference Nordhaus2010; Baranzini et al., Reference Baranzini, Van den Bergh, Carattini, Howarth, Padilla and Roca2017).
While the public agrees on the need for actions to tackle climate change, carbon pricing in some countries has encountered considerable mass protests and political resistance. For instance, Australia's carbon pricing plan in 2014 was canceled due to mass protests (Crowley, Reference Crowley2017); Washington's carbon tax resolutions in 2016 and 2018 were voted against by most officials (Carattini et al., Reference Carattini, Kallbekken and Orlov2019); France's carbon tax was temporarily imposed for six months at the end of 2018 due to ‘Yellow Vests’ (Willsher, Reference Willsher2018). Additionally, the costs of administering the EU Emissions Trading System have been borne by the general public (Koch, Reference Koch2014). Existing literature explores potential drivers and solutions to alleviate the pessimistic beliefs with regard to carbon taxes (as surveyed by Drews and Van den Bergh, Reference Drews and Van den Bergh2016; Maestre-Andrés et al., Reference Maestre-Andrés, Drews and van den Bergh2019).
China, as the world's largest energy consumer and carbon dioxide emitter, also implemented the carbon trading market, rather than carbon taxes, to reduce carbon emissions. However, the insufficient liquidity of the carbon trading market has led to inefficiencies and increased unnecessary costs, which negatively affects income (Li et al., Reference Li, Du and Chen2023). Additionally, emissions trading may have undesirable ethical and psychological impacts and could potentially crowd out voluntary actions (Spash, Reference Spash2010). Based on the quasi-natural experiment of China's carbon trading market pilot policy, this study examines the impact of the carbon trading market on the acceptability of carbon prices. The objective of this paper is to understand why the public are unaccepting of this carbon trading policy and the potential ways to improve the effectiveness of the policy from the households' perspective.
Both carbon trading and carbon taxes can reduce emissions by encouraging the updating of production equipment to improve efficiency (Zhou et al., Reference Zhou, An, Zha, Wu and Wang2019). China mainly adopts cap-and-trade to establish carbon emission prices, and internalizes the environmental externalities associated with carbon emissions by increasing the costs for producers. This approach is intended to incentivize firms to reduce emissions in alignment with their economic interests (Jiang et al., Reference Jiang, Xie, Ye, Shen and Chen2016). However, discontinuous trading of carbon prices and sluggish market activity will increase the costs for firms, making it harder to absorb carbon emission costs internally and increasing competitive pressure on high-polluting firms. At this point, firms on the energy supply side will choose to channel the cost of carbon emissions to downstream industries, which eventually affects consumers through the price transmission mechanism (Baranzini et al., Reference Baranzini, Van den Bergh, Carattini, Howarth, Padilla and Roca2017). People working in carbon-related industries are particularly sensitive to these pass-through effects, which may lead to widespread concern and dissatisfaction with the carbon trading market (Klenert et al., Reference Klenert, Mattauch, Combet, Edenhofer, Hepburn, Rafaty and Stern2018; Feindt et al., Reference Feindt, Kornek, Labeaga, Sterner and Ward2021).
This paper contributes to recent studies exploring the political economy of climate policies in three ways. Firstly, we examine the public acceptance of carbon prices in China. While most of these studies rely on existing literature to formulate a theoretical framework, they often lack robust support and rigorous data analysis (Baranzini et al., Reference Baranzini, Van den Bergh, Carattini, Howarth, Padilla and Roca2017; Klenert et al., Reference Klenert, Mattauch, Combet, Edenhofer, Hepburn, Rafaty and Stern2018; Maestre-Andrés et al., Reference Maestre-Andrés, Drews and van den Bergh2019). Although Hammerle et al. (Reference Hammerle, Best and Crosby2021) and Merten et al. (Reference Merten, Becker and Matthies2022) provide valuable empirical insights, they primarily focus on the psychological aspects. Our paper addresses this gap by providing empirical evidence using microdata from the 2022 China Residential Energy Consumption Survey, which assesses a broader range of factors affecting public acceptability of carbon prices. We evaluate the impact of the carbon trading market on the acceptability of carbon prices by households working in carbon-related industries for the first time at the micro (individual) level.
Secondly, our study relates to the strand of literature that explains the public attitude toward environmental policies. Most previous studies have highlighted the positive effects of perceived benefits and optimistic beliefs on policy acceptance (Stern et al., Reference Stern, Dietz and Kalof1993; Kallbekken et al., Reference Kallbekken, Kroll and Cherry2011; Bostrom et al., Reference Bostrom, O'Connor, Böhm, Hanss, Bodi, Ekström, Halder, Jeschke, Mack, Qu, Rosentrater, Sandve and Sælensminde2012; Douenne and Fabre, Reference Douenne and Fabre2022). Our findings complement this body of work by providing new insights into the link between individuals' acceptance of carbon pricing and the benefits and costs of the policy. Based on textual analysis of public perception of the carbon trading policy, we try to figure out why households are unaccepting of carbon trading prices.
Finally, our paper contributes to the literature on improving public approval of climate policy. Maestre-Andrés et al. (Reference Maestre-Andrés, Drews and van den Bergh2019) summarized three factors influencing household attitudes, personal consequences, distributional effects and procedural aspects, though few studies have empirically assessed their effectiveness. For personal consequences, research often focuses on central bank communication as a means to enhance public trust in monetary policy (Bholat et al., Reference Bholat, Broughton, Ter Meer and Walczak2019; Coibion et al., Reference Coibion, Gorodnichenko, Kumar and Pedemonte2020; Kryvtsov and Petersen, Reference Kryvtsov and Petersen2021). Regarding distributional effects, carbon taxes disproportionately burden poorer households, exacerbating inequality (Beuermann and Santarius, Reference Beuermann and Santarius2006; Clinch and Dunne, Reference Clinch and Dunne2006; Kallbekken and Aasen, Reference Kallbekken and Aasen2010). Concerning procedural aspects, public trust in policy fairness is crucial, as skepticism about carbon revenue use drives opposition (Carattini et al., Reference Carattini, Baranzini, Thalmann, Varone and Vöhringer2017; Klenert et al., Reference Klenert, Mattauch, Combet, Edenhofer, Hepburn, Rafaty and Stern2018; Jagers et al., Reference Jagers, Martinsson and Matti2019). Our paper analyzes whether improving carbon perception, income and social equity could alleviate the unacceptability of carbon prices.
To clarify these issues, we use the carbon trading market as a quasi-natural experiment to quantitatively analyze its net impact on public acceptance of carbon pricing. The main findings are as follows: first, the implementation of the carbon trading market has significantly reduced the acceptance of carbon prices among households working in carbon-related industries in the pilot areas. When controlling for other variables, households in these industries exhibit a 22.6 per cent lower acceptance of carbon prices on average compared to households in other sectors. Specifically, the acceptance rate among carbon-related households decreased from 78.3 to 55.7 per cent following the market's implementation. Second, the implementation of the carbon trading market increases households' perceived costs, mainly due to rising prices and increasing living expenses. Lastly, this study finds that as public perception of carbon issues, income level and social equity improve, the negative effect of the policy on households working in carbon-related industries will be alleviated. This suggests that the three aspects of personal consequences, distributional effects and procedural aspects can play a corresponding regulatory role in improving carbon price acceptability by households.
The remainder of this study is organized as follows: section 2 introduces the policy background of the carbon trading market in China and provides a description of the data. Section 3 introduces the estimation strategy and empirical results. Section 4 explores the mechanism of the impact from the perspective of perceived costs. Section 5 discusses potential strategies to alleviate the unacceptability of carbon pricing by the public. Section 6 summarizes the conclusions and provides relevant policy implications.
2. Background and data
2.1 Background of the carbon trading market in China
To promote the low-carbon transformation of industrial structures, the National Development and Reform Commission (NDRC) proposed the pilot areas of carbon trading in seven provinces and cities including Beijing, Tianjin, Shanghai, Chongqing, Hubei, Guangdong and Shenzhen in 2011. By 2013, these pilot regions had officially launched carbon trading. As a result, these areas have successfully reduced both the total volume and intensity of carbon emissions (Liu et al., Reference Liu, Chen, Zhao and Zhao2015; Hu et al., Reference Hu, Ren, Wang and Chen2020). Among them, firms in electricity and energy-intensive manufacturing industries, such as cement and petrochemicals, are the main participants in the carbon trading markets.Footnote 1 Industries such as transportation and construction are also included in Beijing, Shanghai, Hubei and Shenzhen (Cao et al., Reference Cao, Ho, Ma and Teng2021). This study focuses on the impact of the carbon trading market on households working in carbon-related industries.
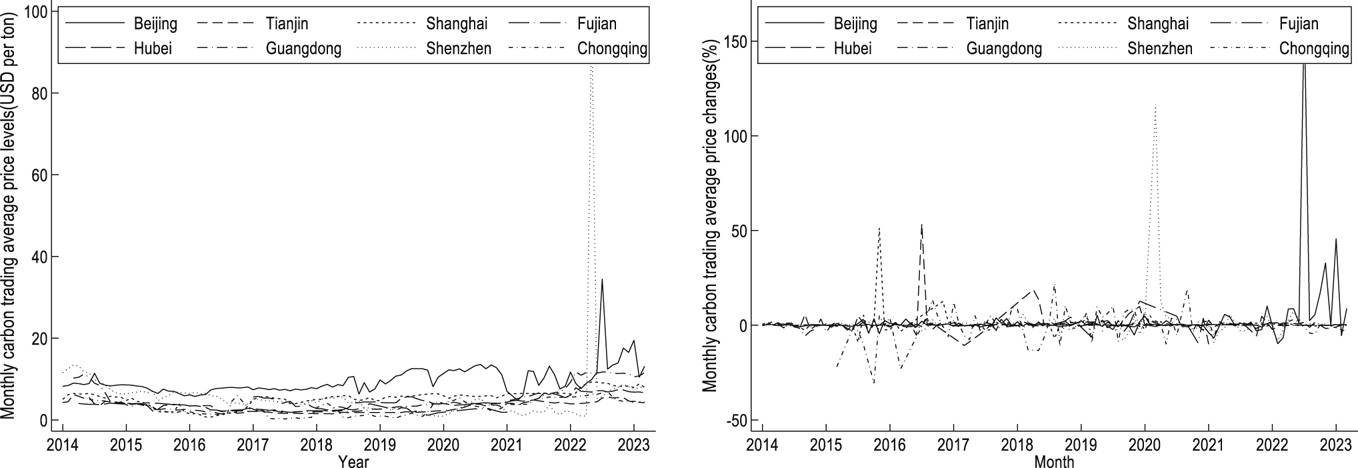
Figure 1 shows the average monthly trading carbon price level and changes in each pilot area since 2014. We can see that the carbon market prices in these pilot areas generally exhibit large fluctuations followed by an upward trend, particularly around the survey period of the data used in this paper. Additionally, carbon trading tends to be concentrated around the performance period, with inactivity during other times (Yu and Wang, Reference Yu and Wang2010). Discontinuous trading and poor liquidity of carbon trading may lead to a widening gap of marginal abatement costs among firms in different industries and regions. Consequently, polluting firms have difficulty internalizing carbon emission costs and face higher expenses due to carbon prices.
Monthly carbon trading average price levels and changes.
Notes: This figure illustrates the average monthly carbon trading price levels and changes across each pilot area since 2014. The data comes from Wind (https://www.wind.com.cn/).

The increased cost could be passed on to consumers via the price transmission mechanism, resulting in a rise in product price and an increase in energy cost for the whole society (Baranzini et al., Reference Baranzini, Van den Bergh, Carattini, Howarth, Padilla and Roca2017). People working in carbon-related industries are more likely to perceive these pass-through effects. Given that the carbon trading market is a complex system, including standard design, carbon emission allocation, quota trading, legal liability and other aspects, the public often lacks accurate knowledge of carbon trading. Consequently, the information asymmetry between the government and the public in terms of carbon pricing will be magnified. The information provided by the government on carbon pricing remains inadequate, leading to reduced trust in the policy effect on reducing carbon emissions, which in turn reinforces the belief that carbon pricing will decrease the public's willingness to accept carbon pricing.
2.2 Data and stylized facts
The data are derived from the 12th round China Residential Energy Consumption Survey (CRECS), conducted from December 2022 to February 2023. To ensure that the collected samples are representative and stratified, random sampling is carried out in the sampling method. First, by randomly selecting provinces, the target covers 18 provinces in the eastern, central and western regions,Footnote 2 and the number of samples in each region is consistent with the proportion of the total number of provinces in each region. Also, within the province, two prefecture-level cities were randomly selected, and each prefecture-level city covered households in urban, county and rural areas. The number of sampled households between provinces, cities, counties and townships was distributed according to the proportion of the total population. In recognition of the fact that some elderly households rarely use electronic devices, we employed a combination of online and offline methods in our survey. We use an electronic questionnaire to avoid the occurrence of households skipping or missing answers. At the same time, the investigator accompanied the individuals during the household survey to ensure that the individuals could answer the questions in the questionnaire objectively and truthfully, and to ensure the authenticity and reliability of the questionnaire. Finally, 1850 valid questionnaires were collected.
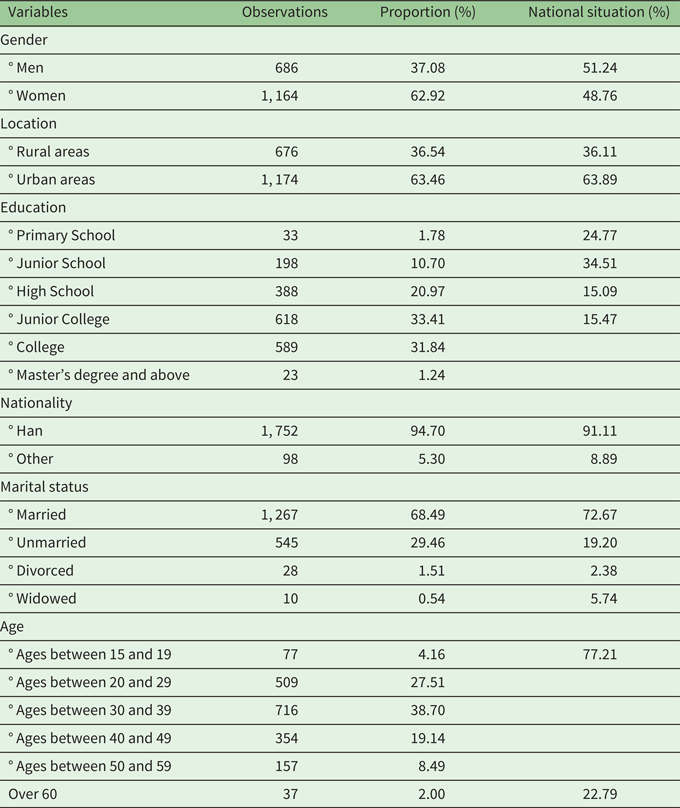
The basic socio-demographic information of the households is shown in table 1. We provide the comparison of variables with the data of the seventh national census. Since our paper is based on survey data, it is necessary to consider whether households have the ability to answer questions, so there will be a slight gap with the census population. However, from the overall distribution of the data, all variables exhibit strong heterogeneity and thus our survey data are representative.Footnote 3
Descriptive statistics of basic data

Notes: This table shows the basic socio-demographic information of the households. To address the contingency problems caused by random sampling, we compare the basic data of the respondents with the data of the seventh national census. The last column ‘National situation’ shows the results of the seventh national census (see https://www.gov.cn/xinwen/2021-05/11/content_5605794.htm).
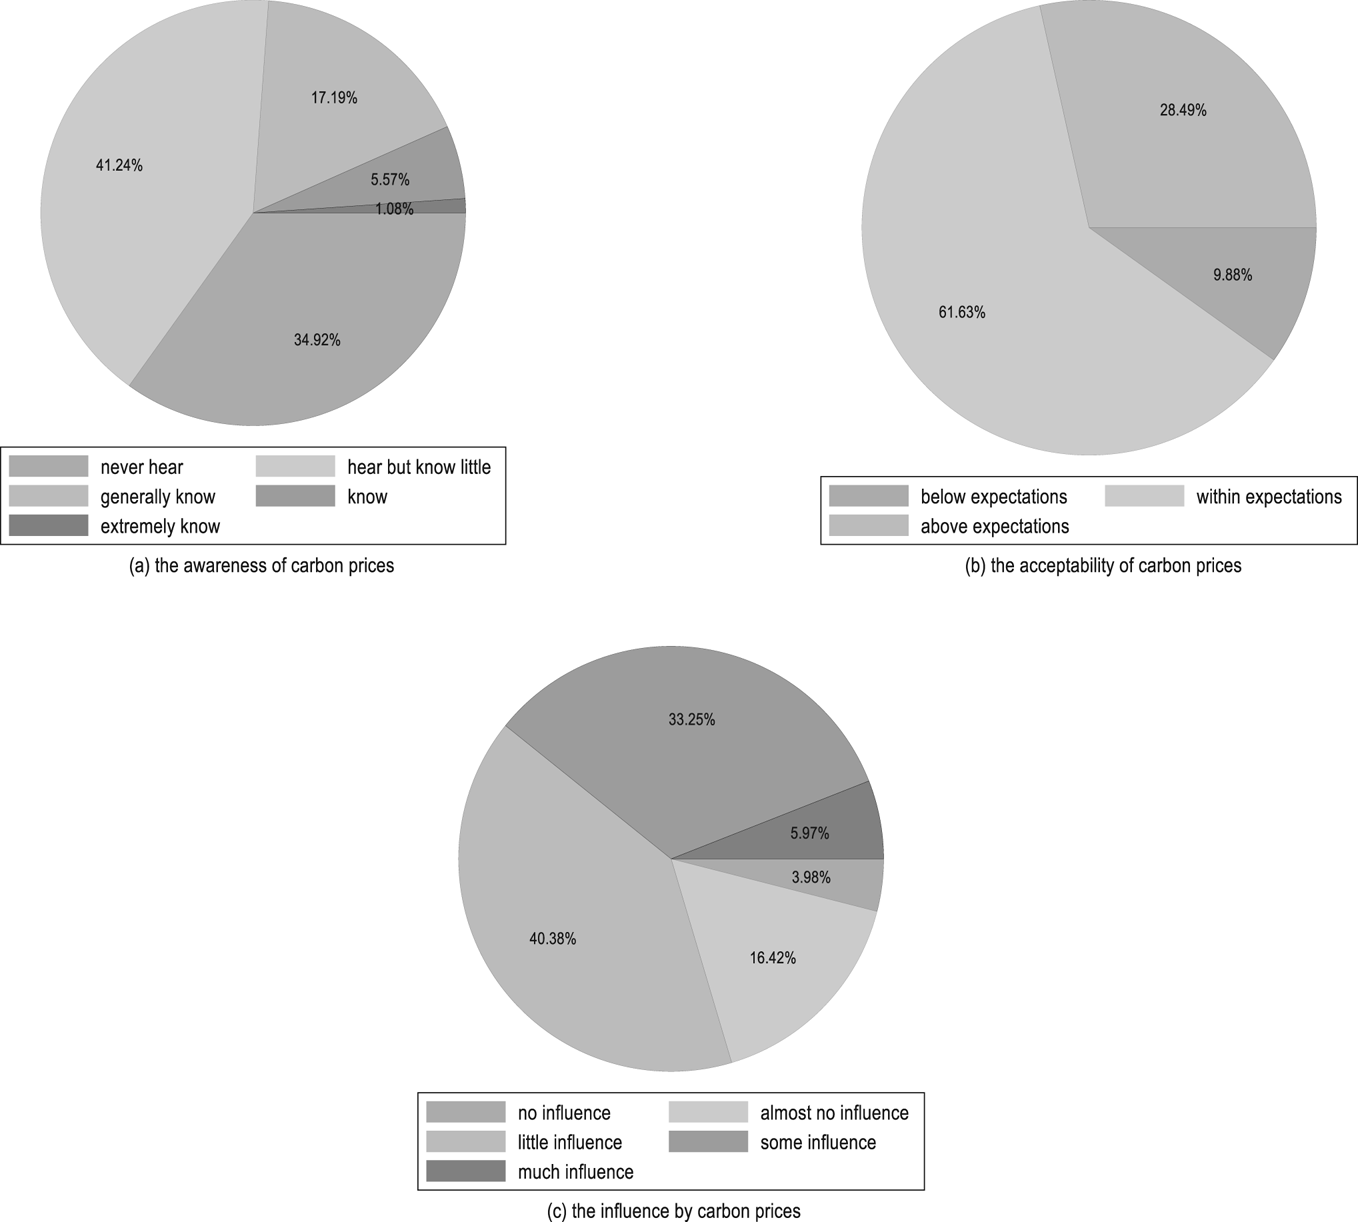
Figure 2 depicts household characteristics regarding awareness of carbon prices, acceptability of carbon prices, and the perceived impact of carbon prices. In our survey, we introduce the current situation of China's carbon emissions trading system to the households, and compare carbon prices between China's carbon market and those of the EU, New Zealand and South Korea to ensure objectivity in their responses. Half of the households are aware of carbon pricing and a quarter has a certain understanding of it. If the households have not heard of the carbon price at all, they will not be asked to answer questions on the acceptability or degree of influence on carbon prices.Footnote 4 The majority of households can accept the current carbon price in the national carbon market. Moreover, this study defines the households that can accept carbon prices if they view the current price as ‘below expectation’ or ‘within expectation’, and uses ‘within expectation’ as a measure of acceptance in the robustness analysis.
The characteristics of the households' attitudes towards carbon prices.

Figure A1 in the online appendix illustrates the total number of households familiar with carbon prices across both pilot and non-pilot areas, as well as carbon-related and non-carbon-related industries in our survey. In all groups, the number of households who know carbon prices exceeds those who do not know, and the ‘carbon-related and pilot’ groups have the highest proportion of households who know carbon prices compared to those that do not know. Therefore, it is evident that households working in carbon-related industries within pilot areas are the most aware of carbon pricing.
Regarding the level of public carbon perception and social equity in the living provinces, we also construct the corresponding variables for each. The level of social equity comes from the survey results of the problem in the Chinese General Social Survey ‘Generally speaking, you think that today's society is unfair’.Footnote 5 The level of public carbon perception comes from the China Residential Energy Consumption Survey, which covers carbon cognition, carbon attitude and carbon behavior. Each indicator includes some specific questions, and its composition is shown in online appendix table A2. On this basis, we determine whether the households answered correctly according to the correct answer, summarize the scores of all items, and standardize the score results to calculate the carbon perception comprehensive index of each household.Footnote 6 The answers to all items are shown in online appendix table A3. Online appendix figure A2 depicts the probability density of public carbon perception. We observe that the level of public carbon perception generally shows a bell-shaped distribution, which is low at both ends and high in the middle. However, there is a fat tail, which means a large gap, at the high level.
3. Empirical strategy and empirical results
3.1 Empirical strategy
To explore the public acceptability of carbon prices, we take the carbon trading market as a quasi-natural experiment to investigate the impact of the carbon trading market on the acceptability of carbon prices by households working in carbon-related industries. The baseline specification is:

where i represents the household in our survey, j represents the industry that the household is working in, and p represents the province where the household lives. The term μijp is an unobservable component of this valuation, assumed with an i.i.d. extreme value distribution. The dependent variable Carbon_acceptijp represents the acceptability of the households to current carbon prices. If the households can accept the current carbon price, the value is assigned as 1, otherwise as 0. Figure A3 (online appendix) illustrates the total number of households who accept carbon prices in (non-) pilot areas and (non-) carbon-related industries in the survey. Industryj indicates whether the households are working in carbon-related industries. We define carbon-related industries as any of the households working in electricity, manufacturing, transportation or construction.Footnote 7 Locationp represents whether the households are in the pilot provinces of the carbon trading market.Footnote 8 The significantly negative β1 proves that the implementation of the carbon trading market reduces the acceptability of carbon prices for households working in carbon-related industries relative to the other individuals, and vice versa.
In order to eliminate other factors affecting the recognition of carbon price acceptability in the carbon trading market, we also add the control variable Xijp which includes characteristics of households, such as gender, age, nation, marriage, education and location. The term γj refers to the industry fixed effect and the term ηp refers to the province fixed effect.
3.2 Baseline estimations
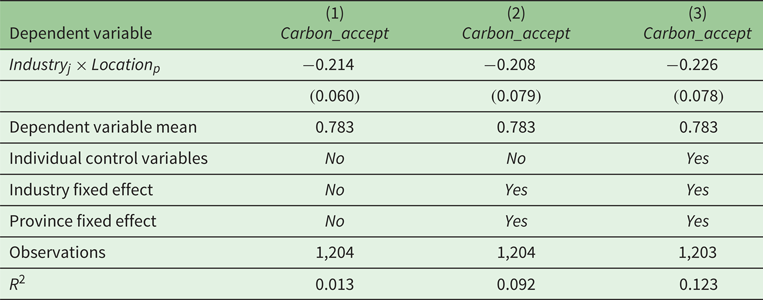
Based on the baseline regression equation (1), we can test whether the implementation of the carbon trading market affects the acceptability of carbon prices for households working in carbon-related industries. According to the results of columns (1)–(3) of table 2, whether considering control variables or not, the implementation of the carbon trading market significantly reduces the acceptance of carbon prices by households working in carbon-related industries. From the results of column (3), the implementation of a carbon trading market exerts a negative effect on the acceptance of carbon prices by an average of 22.6 per cent among households working in carbon-related industries. Given that 78.3 per cent of the households working in carbon-related industries in non-pilot areas can accept the current carbon price, after becoming a pilot area of the carbon trading market only 55.7 per cent of the households working in carbon-related industries can accept the current carbon price.
Baseline regression results

Notes: Standard errors in parentheses are clustered at the household level. The mean value of the dependent variable is the carbon price acceptance of households working in carbon-related industries in non-pilot areas.
3.3 Heterogeneity analysis
In order to investigate the heterogeneous effects of the carbon trading market on households working in different industries, this study adopts a similar approach to the existing literature and draws on the analysis method of Jacobson et al. (Reference Jacobson, LaLonde and Sullivan1993) to construct the model as follows:

Among them, $\beta_{\zeta}$ is the regression coefficient to be focused on in this study. The other variables are consistent with the definition in equation (1). We set the population working in ‘other’ industries in the pilot provinces of the carbon trading market as the baseline for analysis. Therefore, $\beta_{\zeta}$
 represents the average difference in the acceptance of carbon prices between the pilot provinces and the non-pilot provinces for households working in the $\zeta$
 industry carbon trading market compared to the households working in ‘other’ industries.
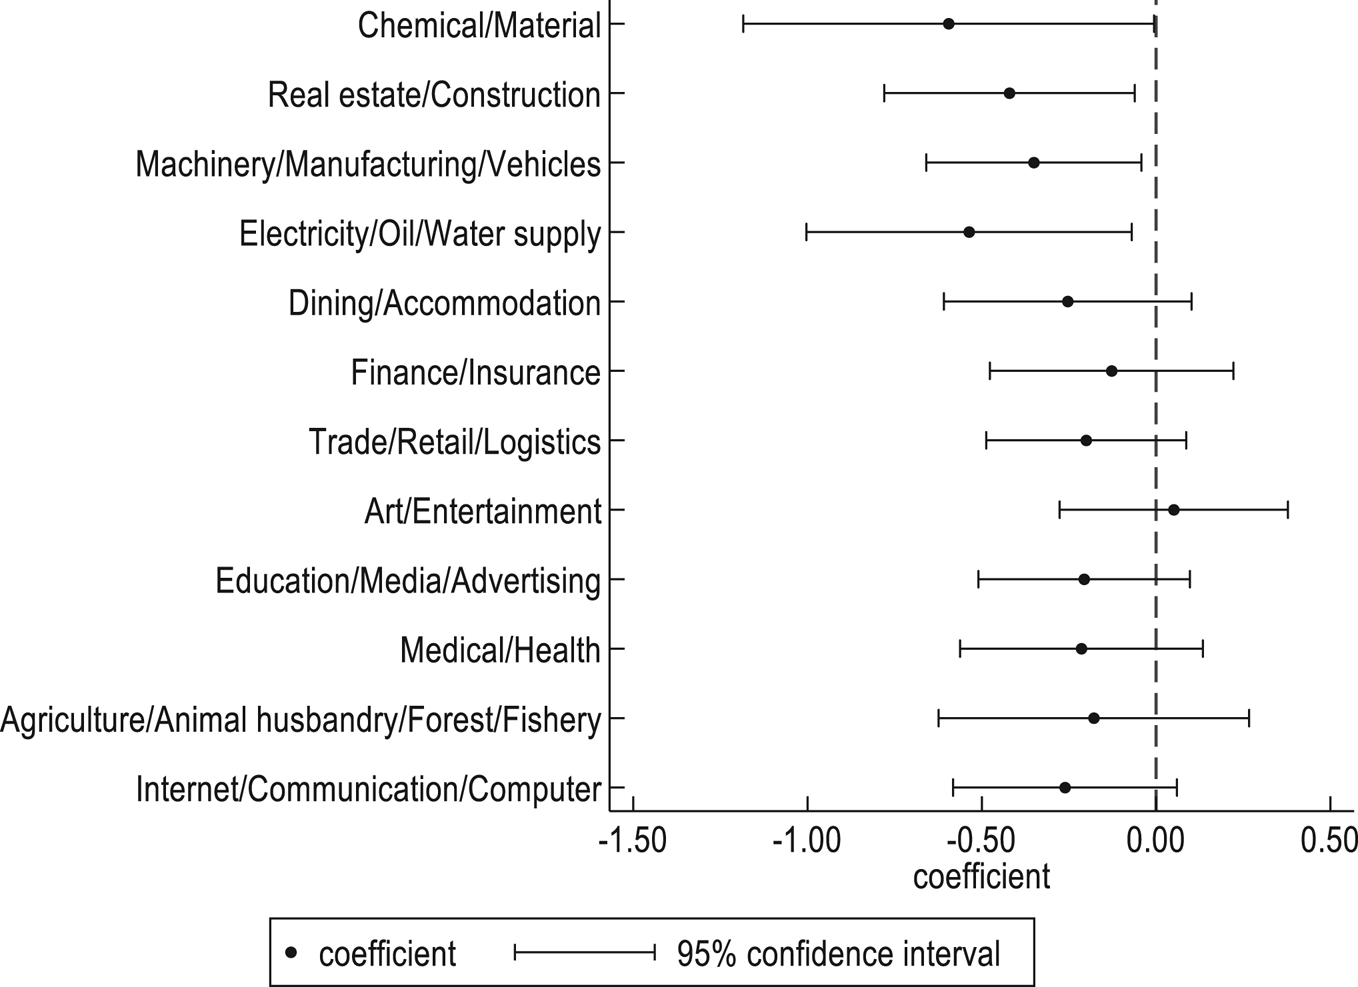
As shown in figure 3, there is no significant difference at the 5 per cent level between the carbon price acceptance of households among non-carbon-related industries in the pilot provinces and non-pilot provinces, meeting the common trend hypothesis. In terms of households working in carbon-related industries, the implementation of the carbon trading market significantly reduces the carbon price acceptance for households in each type of industry, and the negative effects are larger in ‘chemical/material’ and ‘electricity/oil/water supply’ industries.
Heterogenous effects among industries.
Notes: In this study, the regression coefficient based on the analysis equation (2) and the 95% confidence interval results are drawn, in which the confidence interval is based on the robust standard error calculation from the clustering to the household level.

We also employ sub-sample regression to estimate the baseline regression equation (1) for each industry. The results are shown in online appendix figure A4. We can see that the regression coefficient in ‘other’ industries is close to zero and is not statistically significant, indicating that using the households working in ‘other’ industries as the baseline is credible. Furthermore, the regression coefficients in carbon-related industries do not differ significantly from those in our paper.
3.4 Placebo test
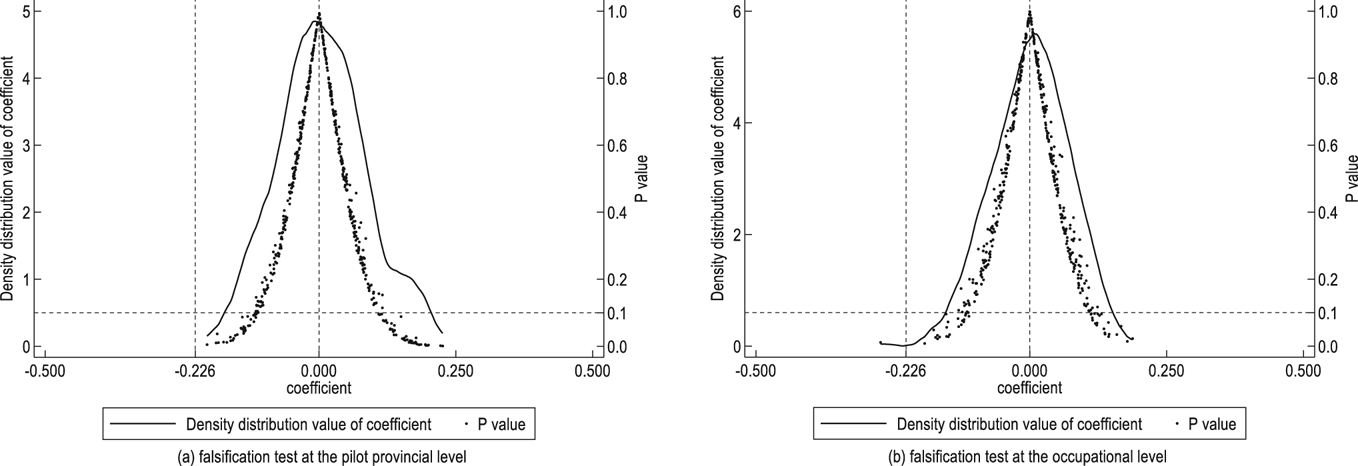
Combined with the results of table 2 and figure 3, we find that the implementation of the carbon trading market has significantly reduced the acceptance of carbon prices by households working in carbon-related industries. To ensure the robustness of the regression results, this study employs counterfactual thinking, referencing the approach used by Chetty et al. (Reference Chetty, Looney and Kroft2009). In this method, randomly selected provinces are assumed to be pilot provinces for the carbon trading market, and household energy survey data is then matched for re-regression. If the regression coefficients obtained from 500 random assignments significantly differ from those of the baseline regression, it supports the notion that the baseline results are not influenced by other parallel provincial policies. Figure 4(a) is the kernel density map of the 500 regression coefficients obtained by random assignment regression and the scatter plot of the corresponding P values. On the one hand, most of the regression coefficients obtained by random assignment fall in the range of [−0.2, 0.2], which is significantly larger than the baseline regression coefficient of −0.226. On the other hand, it generally obeys the normal distribution with a mean value of approximately zero, and the corresponding P values are mostly greater than 0.1. Therefore, both economic and statistical significance are in line with the expectations of the placebo test. Additionally, this study conducts a placebo test in which the households are randomly assigned to the industry, as shown in figure 4(b), which also satisfies the expectations of the placebo test in the economic and statistical sense. Therefore, it is reasonable to believe that the carbon trading market has significantly reduced the acceptance of carbon prices by households working in carbon-related industries.
Falsification test at the pilot provincial level and occupational level.
Notes: This figure shows the cumulative distribution density of the estimated coefficients, derived from 500 simulated random assignments. The vertical lines represent the regression coefficients from column (3) in table 2.

3.5 Robustness checks
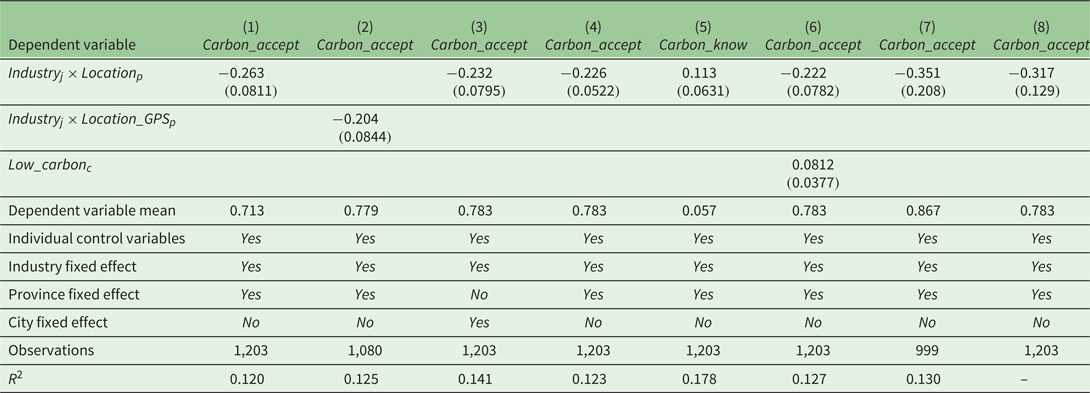
Although the previous heterogeneity analysis on different occupations and falsification tests has verified the reliability of the baseline regression results to a certain extent, this study carries out robustness checks to further ensure the robustness of the baseline results. These checks include replacing the dependent variable, replacing the core independent variable, introducing more detailed fixed effects, changing the clustering method of robust standard errors, excluding competitive assumptions, excluding specific samples, and using the Logit method. The specific results are shown in table 3.
Robustness checks results

Notes: Standard errors in parentheses are clustered at the household level except for column (4). The mean value of the dependent variable in column (1) is the carbon price acceptance of the re-defined households working in carbon-related industries in non-pilot areas. The mean value of the dependent variable in columns (2)–(4) and (6)–(8) is the carbon price acceptance of the households working in carbon-related industries in non-pilot areas. The mean value of the dependent variable in column (5) is the carbon price understanding of the households working in carbon-related industries in non-pilot areas. R 2 ‘–’ in column (8) indicates that it is not applicable.
In the baseline regression, we define the households' acceptance of the carbon price as their belief that the current carbon price is ‘below expectation’ or ‘within expectation’, which may make the identification of the carbon price acceptance of the carbon selling group biased, resulting in an upward bias in the baseline regression results. Therefore, to ensure the rigor of the selection of the explained variables, this study redefines the carbon price accepted by the households as the current carbon price ‘within expectations’, and substitutes it into the baseline regression equation (1). The regression results are shown in column (1) of table 3. Although the absolute value of the regression coefficient of the core independent variable Industryj × Locationp has increased slightly, it is basically consistent with the baseline regression. This indicates that the effect of the implementation of the carbon trading market on reducing the acceptability of the carbon price by households working in carbon-related industries is not affected by the setting of the dependent variable.
Considering that the geographical location of the households is determined according to their subjective answers, there may be data bias caused by the households' concealment of individual information. To this end, this study redefines whether the household is in the pilot provinces of carbon emissions trading according to the geographical location corresponding to the GPS longitude and latitude submitted by the questionnaire, and substitutes the Location_GPSp into the baseline regression equation (1). The results are shown in column (2) of table 3.Footnote 9 The results are also consistent with the baseline regression.
Then, although this study controls the province fixed effect, it does not guarantee that there is no missing impact of city-level variables on the identification of causal effects. Therefore, this study further controls the city fixed effect and substitutes it into the baseline regression equation (1). The results are shown in column (3) of table 3. The regression coefficient of the core independent variable Industryj × Locationp is still significant, so the baseline results are not affected by the fixed effect control. Additionally, since this study evaluates the impact of the carbon trading market implementation on the acceptability of carbon prices among households in different industries, we also account for robust standard errors a using two-way clustering approach at the provincial and industrial levels.Footnote 10 The result shown in column (4) of table 3 is still robust.
Moreover, considering that the definition of whether the households are working in carbon-related industries comes through subjective selection, this may cause a certain deviation in the selection of experimental groups so that the results of the baseline regression are overestimated or underestimated. To this end, this study replaces the dependent variable with a dummy variable of whether households understand the carbon price. The households answer that they ‘extremely know’ and ‘know’ the carbon price are regarded as understanding the carbon price, and the households who answer that they ‘generally know’ and ‘hear but know little’ the carbon price are regarded as not understanding the carbon price. A reasonable explanation is that the carbon trading market is an important institutional innovation that uses market mechanisms to control and reduce greenhouse gas emissions, promoting the green and low-carbon transformation of the economic development mode. As a result, the use of this policy tool should theoretically increase the understanding of the carbon price among households working in carbon-related industries. If there is no significant difference or negative impact, it is reasonable to suspect that the definition of carbon-related industries is biased and cannot act as an experimental group for baseline regression; otherwise, at the very least, there is no clear evidence to reject the idea that households working in these industries can act as the experimental group for baseline regression. The specific regression results are shown in column (5) of table 3. The regression coefficient of the core independent variable Industryj × Locationp is significantly positive, which at least proves that households working in these industries are more aware of carbon prices in the pilot areas.
This study also introduces the province fixed effects and the industry fixed effects to control for the interference of policies and regulations at the industry and provincial levels. However, due to the relatively fixed occupational division, the setting at the variable Locationp may also reflect other parallel policies at regional levels. Therefore, this study attempts to exclude the impact of other interference policies. As a highly carbon-related policy, the low-carbon city pilot policy aims to minimize greenhouse gas emissions, and thus this study constructs a dummy variable that characterizes this policy. Although the absolute value of the core independent variable Industryj × Locationp decreases slightly in column (6), it is consistent with the baseline regression.
Given that the primary joint industry in the carbon trading markets is the electricity sector, we define carbon-related industries as the households working in electricity, and exclude the households involved in manufacturing, transportation, and construction. The results shown in column (7) of table 3 indicate that the regression coefficient of the core independent variable Industryj × Locationp is more negative compared to the baseline results, further strengthening our findings.
Finally, considering that the dependent variable and the core independent variable used in this study are both dummy variables, using OLS estimation may violate the heteroscedasticity hypothesis. Therefore, we use the Logit method to estimate the baseline regression equation (1), and the results are shown in column (7) of table 3. The core independent variable Industryj × Locationp remains significant, which means our results are not affected by the estimation method.
4. Unacceptability of carbon price and perceived cost
Based on the above estimation, the implementation of the carbon trading market significantly reduces the acceptability of carbon prices for households working in carbon-related industries. This section attempts to explore the mechanism of the impact from the perspective of perceived costs.
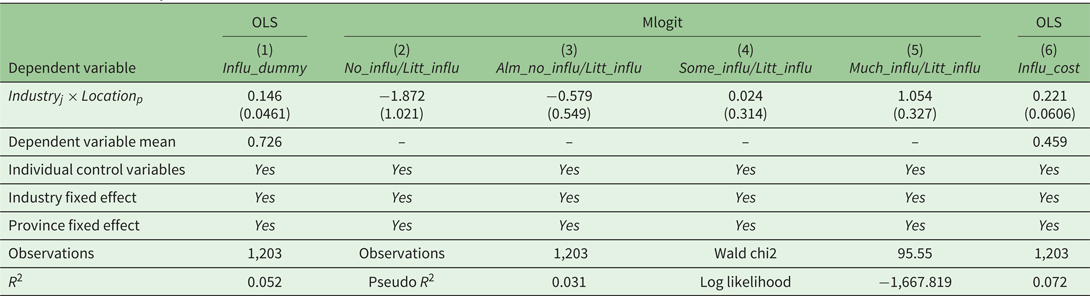
In the survey, households were asked how and to what extent they are influenced by carbon prices. First, this study defines the households affected by carbon prices as those that answer that carbon prices have ‘much influence’, ‘some influence’, and ‘little influence’ on their lives, and defines the households that are not affected by carbon prices as those who respond with ‘almost no influence’, ‘no influence’. The degree to which households are affected by carbon price is expressed by a 0–1 dummy variable, shown in column (1) of table 4. We find that the implementation of the carbon trading market is associated with an average increase of 14.6 per cent in the influence on the lives of households working in carbon-related industries.
Mechanism analysis results

Notes: Standard errors in parentheses are clustered at the provincial and industrial two-way level in column (1) and column (6). The mean value of the dependent variable in column (1) is the degree of impact of carbon prices on households working in carbon-related industries in non-pilot areas. The mean value of the dependent variable in column (6) is the degree of negative impact of carbon prices on households working in carbon-related industries in non-pilot areas. The mean value of the dependent variable ‘–’ in columns (2)–(5) indicates that it is not applicable.
We also replace the dependent variable with a continuous variable about the degree of influence by the carbon price, expressed as 1 to 5, and use the multinomial logit (mlogit) model. The results are shown in columns (2)–(5) of table 4. From the results we can see that compared with the households affected minimally by carbon prices, the implementation of the carbon trading market significantly increases the probability of affected households, while the probability of not being affected will be significantly reduced.
We further calculate the marginal effect of the implementation of the carbon trading market on households working in carbon-related industries. The results are shown in online appendix table A6. From the results we can see that the implementation of the carbon trading market significantly decreases the possibility of households' influence being ‘no influence’ by 7.77 per cent, and increases the possibility of households' influence being ‘much influence’ by 15 per cent. This indicates that the implementation of the carbon trading market has indeed significantly increased the impact of the carbon price on households working in carbon-related industries.
This study conducts a textual analysis to explore how households are influenced by carbon prices, as shown in figure 5. Households believe that the impact of carbon prices on their lives is mainly reflected in areas such as travel, rising prices, increased costs, expenses and pressure. We manually identify whether households are negatively affected by the rising product prices and increasing living costs caused by carbon prices based on their responses. Households that mention rising prices or increased costs are regarded as affected by carbon pricing, taking the value of 1, and the other households are assigned 0. As indicated in column (6) of table 4, we find that the implementation of the carbon trading market causes an average increase of 22.1 per cent in the negative impact on the lives of households working in carbon-related industries. Given that 45.9 per cent of the households working in carbon-related industries in non-pilot areas are negatively affected by carbon prices, after becoming a pilot area of the carbon trading market there will be 68 per cent of households working in carbon-related industries negatively influenced by rising product prices and increasing living costs caused by carbon prices. In summary, the implementation of the carbon trading market affects the lives of households working in carbon-related industries in the pilot areas, mainly reflected in the negative impact of perceived cost, which leads to a significant reduction in their acceptability of the carbon price.
Textual analysis of how carbon prices affect the lives of households.
Notes: In order to ensure the intuitive degree of the word cloud image, this study only retains the content whose word frequency is more than 5, and eliminates the word frequency whose content is an adjective.

5. How to improve the effectiveness of carbon trading policy?
It is worth exploring whether the public unacceptance of carbon prices could be alleviated based on different solutions. Therefore, this study examines improvement methods from the three perspectives of personal consequences, distributional effects and procedural aspects.
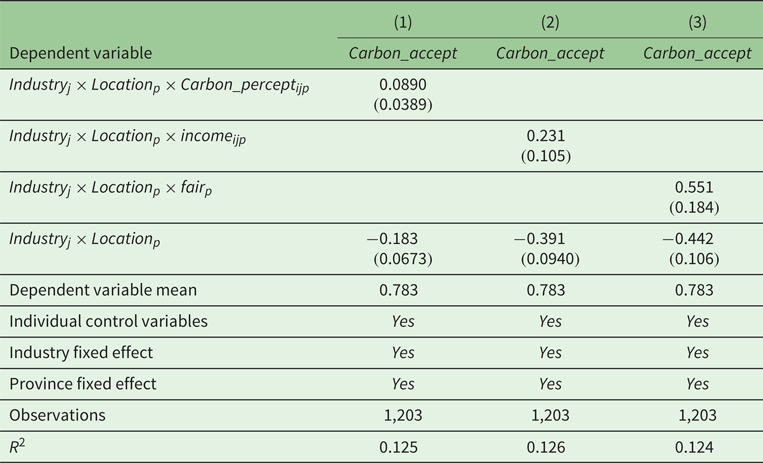
As illustrated in column (1) of table 5, the coefficient of the interaction term with carbon perception is significantly positive, indicating that the level of carbon perception exerts a positive adjustment effect on the carbon price acceptability of the implementation of the carbon trading market for households working in carbon-related industries. The individual consequences can alleviate the negative effect of the implementation of the carbon trading market on the carbon price unacceptability of households working in carbon-related industries. As shown in column (2) of table 5, we define households whose income level is higher than the median of the sample as high-income groups, and the coefficient of the interaction term is significantly positive, which means that the distributional effect of improving income could be an effective way to reduce the public pessimistic belief about the carbon prices. Column (3) of table 5 indicates that the level of social equity has a positive adjustment effect on the acceptability of carbon prices following the implementation of the carbon trading market. Consequently, enhancing public perception of carbon, improving the distribution effect and decreasing the information asymmetry of the policy implementation is important for improving public acceptability of carbon prices and the effectiveness of the policy.
Solutions to alleviate public unacceptability of carbon prices

Notes: Standard errors in parentheses are clustered at the provincial and industrial two-way level. The mean value of the dependent variable is the carbon price acceptance of households working in carbon-related industries in non-pilot areas.
6. Conclusion and policy implications
Using data from the 12th round of the China Residential Energy Consumption Survey, we apply the carbon trading market as a quasi-natural experiment to analyze its net impact on public acceptance of carbon prices. We find that the implementation of the carbon trading market significantly decreases the acceptability of carbon prices among households working in carbon-related industries within pilot areas. The implementation of the carbon trading market will reduce the acceptance of carbon prices by 22.6 per cent among households working in carbon-related industries compared with those in other industries. The unacceptance of households is attributed to households' perceived costs, mainly affected by increased living expenses. Furthermore, we find that that the improvement in public carbon perception, income and social equity would lessen the opposition to carbon trading policy, which proves that the three aspects of personal consequences, distributional effect and procedural aspect play a crucial role in improving carbon price acceptance by households.
Based on the above results, the following implications should be taken into account by policymakers. On one hand, the information asymmetry associated with the implementation of the carbon trading market may cause public distrust and an overestimation of the costs associated with carbon trading policy. Therefore, the government should consider communicating with the public to explain the mechanisms and enhance public understanding of the environmental protection policy system. On the other hand, improving public perception of carbon pricing and addressing distribution effects can increase public acceptability of carbon prices and enhance policy effectiveness. The government should focus on expanding carbon education, raising household income levels and ensuring equity in the allocation of revenues to vulnerable groups during the implementation of climate policy.
Supplementary material
The supplementary material for this article can be found at https://doi.org/10.1017/S1355770X25000129.
Acknowledgements
We thank the editors and two anonymous referees for helpful comments. Financial support from the National Natural Science Foundation of China (No. 72101254 and No. 72141308) and the Research Funds of Renmin University of China (24XNF060 and 17XNS001) is gratefully acknowledged. All errors and omissions remain the sole responsibility of the authors.
Competing interest
None.