Introduction
The United Nations Office for Disaster Risk Reduction (UNDRR) defines a disaster as: “A severe disruption in the functioning of a community or society due to hazardous events interacting with conditions of exposure, vulnerability, and capacity, resulting in widespread human, material, economic, or environmental losses and impacts.”1 In general, a disaster can be defined as: “An extraordinary event that seriously disrupts the functioning of a community or society, causing human, material, economic, or environmental damage that exceeds the ability of local institutions to handle it using standard procedures.”Reference Jiang and Yuan2 Disasters include natural events like earthquakes, extreme heat, landslides, tsunamis, typhoons, and floods, as well as human-induced events such as wars and economic crises. Approximately two-thirds of disasters are related to natural causes.3–Reference Kim and Kim5 Both natural and man-made disasters often result in mass casualties. The 2020 Global Natural Disaster Assessment Report stated that 1313 major natural disasters occurred worldwide in 2020, affecting 123 countries and regions. The World Health Organization (WHO) reports that approximately 190 million people are impacted by disasters each year.1, 6
Turkey has been exposed to numerous natural disasters throughout its history. Its climatic and geological characteristics make it prone to frequent natural disasters and, occasionally, human-induced disasters. Among these, earthquakes hold a significant place. On February 6, 2023, 2 major earthquakes occurred in Gaziantep and Kahramanmaraş, causing widespread destruction and significant loss of life. The first earthquake, with a magnitude of 7.7, struck the Sofalaca-Şehitkamil-Gaziantep region, while the second, with a magnitude of 7.6, occurred in the Ekinözü-Kahramanmaraş region. Both earthquakes were felt across a wide area, including Southeastern Anatolia, Eastern Anatolia, Central Anatolia, and the Mediterranean regions, and caused severe damage and loss of life in provinces such as Kahramanmaraş, Gaziantep, Malatya, Elazığ, Diyarbakır, Kilis, Şanlıurfa, Adıyaman, Hatay, Osmaniye, and Adana.Reference Altun7, 8 According to the Disaster and Emergency Management Authority (AFAD), as of March 20, 2023, these earthquakes resulted in 50,096 deaths and 107,204 injuries.9
Although the causes of disasters vary, individuals who face them often experience multiple traumatic conditions such as encountering death, witnessing fatalities, losing contact with loved ones, displacement, and economic collapse. Thus, disasters are extraordinary events far beyond ordinary life experiences. Their effects extend to economic, social, and psychological dimensions, impacting both individuals and societies.Reference Kukuoğlu10–Reference Bonanno and Mancini12 The stressful and traumatic situations caused by disasters lead to resource depletion, the collapse of existing coping mechanisms, and long-term disorders. Not only those directly affected but also their relatives, rescue teams, and witnesses may face psychological issues.Reference Bonanno and Mancini12–Reference Ruzek, Brymer, Layne, Vernberg and Watson14
Exposure to natural disasters increases the risk of developing mental health disorders. Earthquakes, for instance, are associated with higher prevalence rates of depression, anxiety, posttraumatic stress disorder (PTSD), sleep disturbances, and substance abuse.Reference Chen, Wang, Liu, Shi, Scherffius and Fan15–Reference Yokoyama, Otsuka and Kawakami19 Different responses and coping mechanisms are observed among people affected by disasters. Understanding these responses and mechanisms can influence the recovery process of communities postdisaster and enhance vitality. Vitality not only aids individuals in coping with challenges but also contributes to career development and personal goal achievement. Vitality is more than a specific skill; it reflects an individual’s personality and thought patterns. This influences how people approach change and uncertainty, make decisions in daily life, and solve problems. Thus, vitality helps individuals navigate challenges and direct their lives positively.Reference Masten20–Reference Sugiura, Sato and Nouchi22
In Turkey, where natural disasters such as earthquakes, floods, and landslides are frequent, measuring vitality against disasters is crucial for psychological health. To support systematic preparations for future disasters and life challenges, a study was conducted to validate and ensure the reliability of the Turkish version of the vitality questionnaire, which captures traits advantageous for survival.
Materials and Methods
Research Design
This methodological study was conducted to test the validity and reliability of the Turkish version of eight personal trait scales related to vitality in disasters.
Working Time and Environment
The research data were collected online across Turkey between February 1 and March 1, 2024. The survey link, created via Google Forms, was shared on public social media platforms such as Facebook, Instagram, and WhatsApp, inviting adults to participate in the study. All participants were informed about the study’s purpose and content, and they were asked to read the Informed Consent Form. Individuals who agreed to participate were granted access to the data collection tools. The response time for completing the data collection forms was approximately 7-8 minutes, and the data were collected after obtaining approval from the ethics committee.
Sampling and Sampling Characteristics
For the validity and reliability of 8 personal trait scales related to vitality in disasters, data were collected from 523 individuals who experienced disasters in Turkey. According to the literature, it is reported that the sample size should not be less than 300 in validity and reliability studies, 400 is reliable, and 500 will yield more reliable results.Reference Osborne and Costello23, Reference Worthington and Whittaker24 It is stated in the literature that 5-10 times the number of items in the scale should be reached for adaptation studies.Reference Seçer25 The 8 personal trait scales related to vitality in disasters consist of 34 items. A sample of 170 or 340 participants will be sufficient for scale adaptation. During the research process, 523 participants who experienced disasters in Turkey were reached. According to the literature, it is reported that the sample size should not be less than 300 in validity and reliability studies, 400 is reliable, and 500 will yield more reliable results.Reference Osborne and Costello23, Reference Worthington and Whittaker24
Inclusion and Exclusion Criteria
Individuals who agreed to participate in the research voluntarily, had internet access, and had experienced any disaster were included in the study.
Data Collection Tools and Features
The data collection tools used in the study included a Socio-Demographic Data Collection Form prepared by the researchers and the Eight Personal Traits Scale Related to Disaster Vitality, developed by Sugiura et al. in 2015.Reference Sugiura, Sato and Nouchi22
Sociodemographic data collection form
The form created by the researchers includes introductory questions covering sociodemographic characteristics such as age, gender, marital status, educational background, place of residence, family structure, social security, type of disaster experienced, and losses incurred during disasters. The sociodemographic data collection form is based on a literature review conducted by the researchers.Reference Güldü11, Reference Chen, Wang, Liu, Shi, Scherffius and Fan15, Reference Sugiura, Sato and Nouchi22 The survey consists of 12 questions, including age, gender, education, income status, marital status, family structure, type of disaster, and whether losses were experienced during disasters.
Scale of Eight Personal Characteristics Related to Vitality to Disasters
It is a 6-point (0: Not at all, 5: Very much) measurement tool developed by Sugiura and his colleagues.Reference Sugiura, Sato and Nouchi22 In the scale study published in 2015, an attempt was made to determine the main factors of vitality by summarizing the views of survivors of the 2011 Great East Japan Earthquake. The scale is a measurement tool consisting of 8 subdimensions and a total of 34 items. The measurement tool has subdimensions of altruism (1, 2, 3, 4, 5), stubbornness (6, 7, 8, 9, 10), problem solving (11, 20, 21, 22, 27), self-transcendence (12, 13, 14, 15), emotional regulation (16, 17, 18, 19), leadership (23, 24, 25, 26, 34), active well-being (28, 29, 30), and etiquette (31, 32, 33). The scale does not have any cut-off point. The researchers found the internal consistency coefficient (Cronbach α) for all subdimensions of this scale to be over 0.70.
Working Steps
In this study, in order to determine whether the Scale of Eight Personal Characteristics Related to Vitality is valid and reliable in Turkish, the scale was examined from three different aspects: content validity, construct validity, and internal validity.
Translation of the scale
The scale was translated from English to Turkish by three linguists. The Turkish form of the scale was then created through collaboration between the researchers. The Turkish questionnaire was back-translated into English by a different British linguist.Reference Şencan26–Reference Rattray and Jones28
Content validity
After the translation process was completed for the Eight Personal Characteristics Scale Related to Vitality, the validity and reliability of which were examined, the scale was presented to 10 experts for an evaluation including cultural equivalence in order to ensure its content validity. The content validity scores of all items of the Eight Personal Characteristics Scale Related to Vitality, whose content validity was evaluated using the Davis technique, accompanied by expert opinions, ranged between 0.8 and 1.0. Therefore, no item was removed from the scale in terms of content/scope validity. According to the Davis Technique, CVI was accepted as 0.80 and above.Reference Polit and Beck29
Construct validity
After the content validity, in order to obtain clearer findings, factor analysis was conducted to determine the structural validity of the Scale of Eight Personal Characteristics Related to Vitality. Before the factor analysis, Kaiser-Meyer-Olkin (KMO) and Bartlett’s tests were applied to evaluate the adequacy of the sample and the suitability of the data for factor analysis.
In order to look at the explanatory factor analysis, the items of the Scale of Eight Personal Characteristics Related to Vitality were examined in terms of factor loadings and explained variance. After the explanatory factor analysis, structural equation modeling was established with confirmatory factor analysis in order to obtain more precise findings.
Internal validity
The item means, item total correlations, and Cronbach α coefficients if an item is deleted from the Scale of Eight Personal Characteristics Related to Vitality were examined. For the internal consistency reliability coefficient of the scale, the scale was divided into two halves and the consistency values of the two halves were examined.
Pilot study
In order to study the language and expressions of a scale in terms of understanding, the scale needs to be applied to 20-30 people from a similar universe.Reference Şencan26 After the translation studies, a pilot test was conducted with a sample of 30 participants who were not included in the real sample but had similar characteristics to the subjects in the sample to ensure the clarity and comprehensibility of the first version. Participants provided verbal feedback on the linguistic clarity, relevance, and ease of filling in the scale items. However, 30 people from the pilot study were not included in the analysis. Participants did not provide any negative feedback regarding clarity or ease of filling in. Due to the insufficient sample size in the pilot phase of our study, the KMO measure and Bartlett’s test of sphericity could not be calculated. In the literature, it is generally recommended that KMO and Bartlett’s tests not be conducted when the sample size falls below acceptable thresholds. Specifically, a minimum of 100 participants is commonly advised for exploratory factor analysis, or alternatively, at least 5-10 participants per variable.Reference Kyriazos30 As a result, the suitability and reliability of the data for factor analysis could not be statistically verified. Therefore, it cannot be asserted that the findings fully reflect the underlying factor structure; however, they are considered to provide preliminary insights. The primary aim of the pilot study was to gain an initial understanding of the scale’s overall structure and to benefit from participant feedback to inform the development process. Accordingly, the emergence of the exact factor distributions expected in the final version was not anticipated at this stage (Table 1).
Summary of subscales based on pilot study (n = 30)

Statistical Analysis
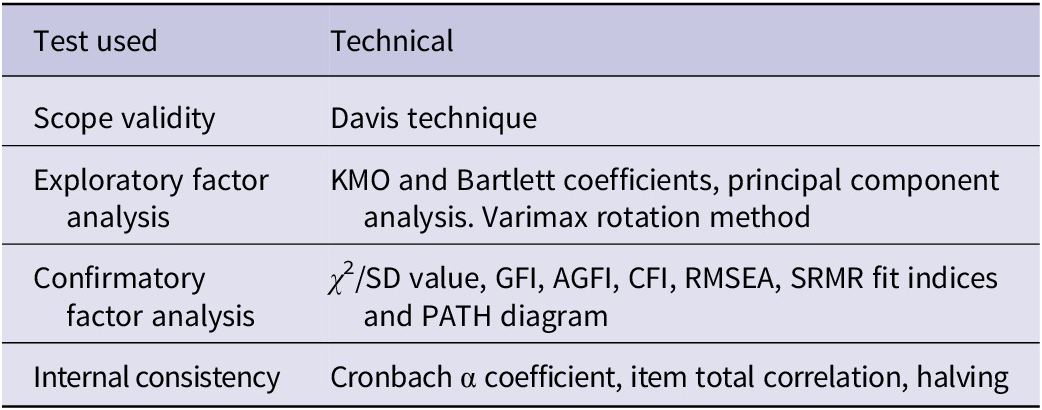
The data were analyzed using SPSS (Statistical Package for the Social Sciences) for Windows 22 package program and LISREL 8.80 package program. In the analysis of the data, numbers, percentages, minimum and maximum values, means, and standard deviations as well as the statistical analyses in Table 2 were used.
Statistical analyses used in data analysis

Research Ethics
Approval was obtained from the Gümüşhane University Scientific Research and Publication Ethics Committee (October 25, 2023—E-95674917-108.99-215316) and from individuals who agreed to participate in the research voluntarily.
Findings
The mean age of the participants participating in the study was 24.09 ± 7.60, 72.7% (n = 380) were female, 53.9% (n = 282) had an income less than their expenses, 86.4% were single (n = 452), and 50.5% (n = 264) lived in the city center. Overall, 83% (n = 434) of the participants belonged to a nuclear family, and 85.1% (n = 445) had experienced a disaster. The type of disaster experienced by the participants was: 79.2% (n = 359) earthquake, 65.1% (n = 56) flood, 47.4% (n = 9) fire, and 36.8% (n = 7) landslide. In total, 64.6% (n = 338) of the participants did not lose their relatives in disasters. Of those who lost, 43.2% (n = 80) lost their relatives, 60% (n = 30) lost their friends, and 62.5% (n = 10) lost their homes. It was determined that 59.5% (n = 311) of the participants were registered with the Social Security Institution (SSI) in Turkey. Established in 2006 through the unification of 3 former institutions (SSK, Bağ-Kur, and Emekli Sandığı), SSI is responsible for providing access to health care services, as well as offering social protection against risks such as retirement, occupational accidents, illness, and disability. In an international context, comparable institutions include Gesetzliche Krankenversicherung (statutory health insurance) and Deutsche Rentenversicherung (pension insurance) in Germany, Sécurité Sociale in France, Försäkringskassan in Sweden, and the Social Security Administration (SSA) in the United States. Additionally, the United States has 2 major health care-related programs: Medicare, which serves individuals aged 65 and older as well as certain disabled groups, and Medicaid, which provides state- and federally funded health coverage for low-income individuals.Reference Ishibashi, Nouchi, Honda, Abe and Sugiura31–34
Content Validity
The Eight Personal Characteristics Scale Related to Vitality, which was planned to be adapted, was presented to ten experts for an evaluation including its cultural equivalence in order to ensure its content validity. The CVI scores of all items of the Eight Personal Characteristics Scale Related to Vitality ranged between 0.80 and 1.0. Therefore, no item was removed from the scale in terms of content/scope validity.
Construct Validity
As seen in Table 3, the KMO value was determined as 0.873, and this value shows that the scale is suitable in terms of sample adequacy for principal component analysis. Bartlett’s test results (χ 2 = 7206.654, P = .000) show that the data are related to each other and suitable for factor analysis.
KMO and Bartlett’s test values for scale items

Factor Analysis
Explanatory factor analysis
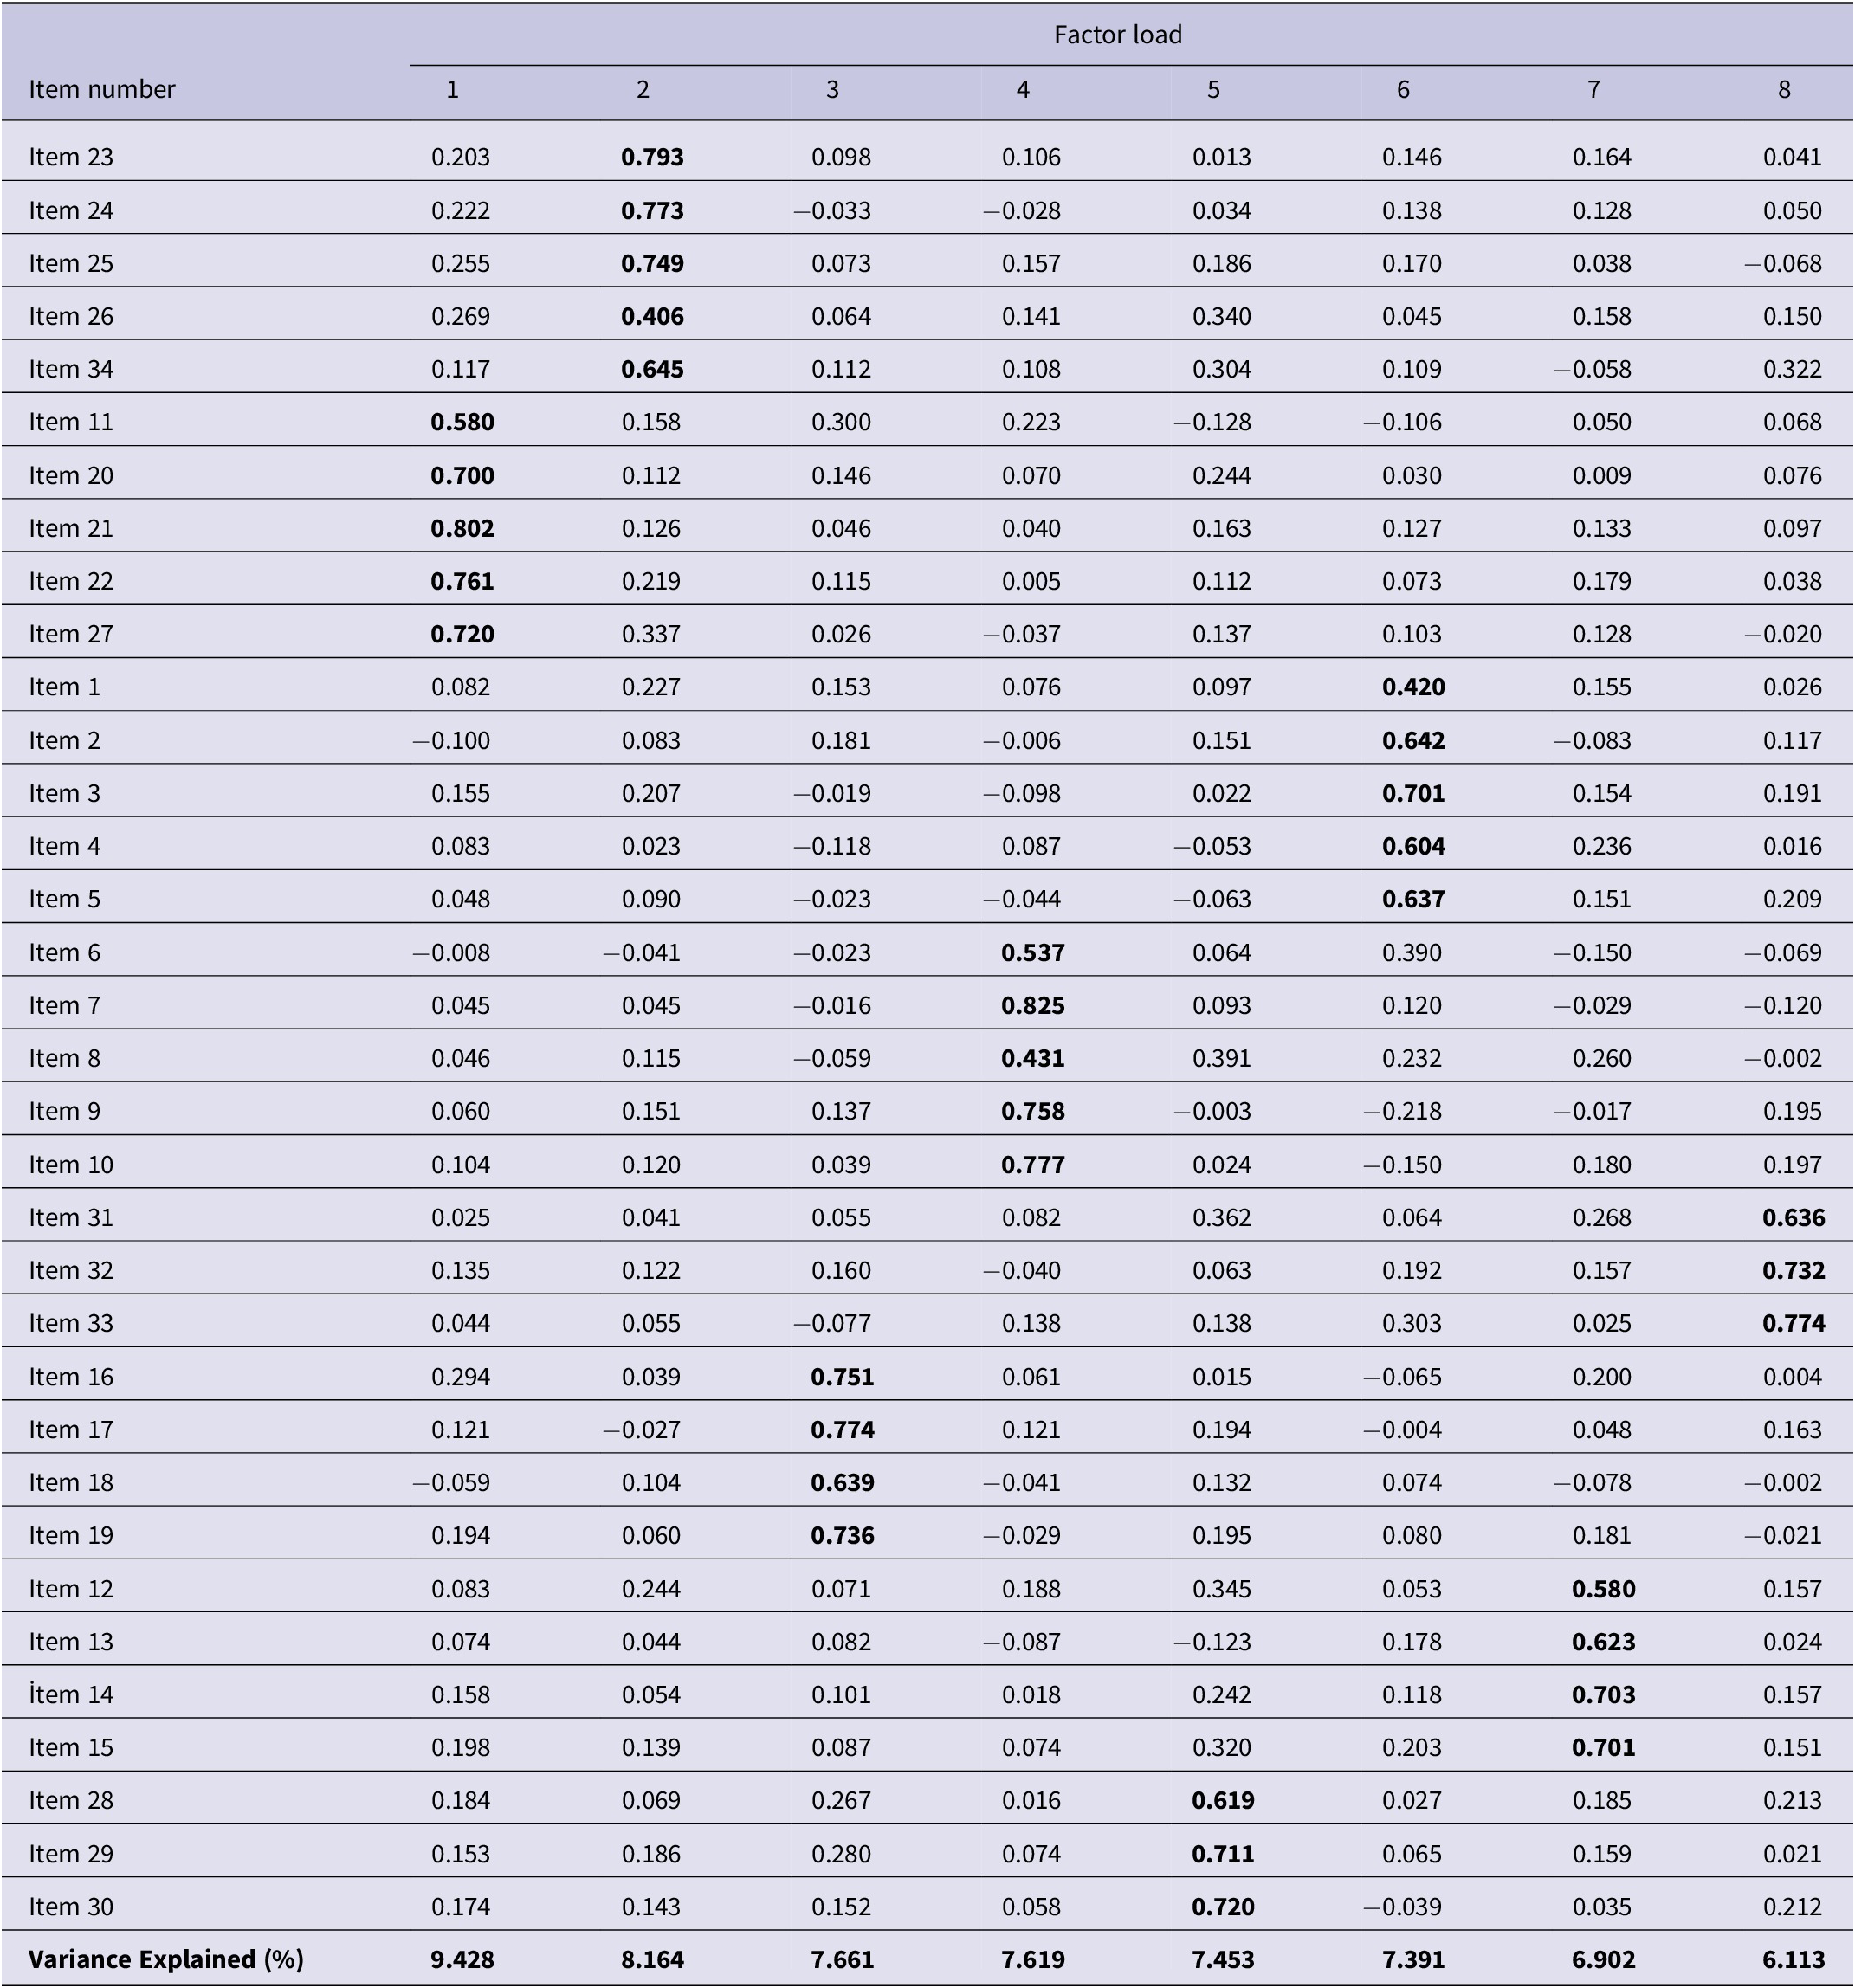
When Table 4 is examined, it is determined that when the Scale of Eight Personal Characteristics Related to Vitality is examined with 8 factors in the same way as the original structure, the factor loadings of all items of the scale are above 0.40 and the explained variance is 61.180%. Therefore, no item was removed from the scale at this stage and the 8-dimension structure was accepted. In the analysis, items 23, 24, 25, 26, and 34 were named as “Leadership Sub-dimension” as in the original scale; items 11, 20, 21, 22, and 27 were named as “Problem Solving Sub-dimension”; items 1, 2, 3, 4, and 5 were named as “Sacrifice Sub-dimension”; items 6, 7, 8, 9, and 10 were named as “Stubbornness Sub-dimension”; items 31, 32, and 33 were named as “Etiquette Sub-dimension”; items 16, 17, 18, and 19 were named as “Emotional Regulation Sub-dimension”; items 12, 13, 14, and 15 were named as “Self-Transcendence Sub-dimension”; and items 28, 29, and 30 were named as “Active Well-being Sub-dimension.” In order to obtain more precise findings after the explanatory factor analysis, structural equation modeling was established with confirmatory factor analysis.
Factor analysis findings for Eight Personal Characteristic Scales related to vitality (8-factor original structure)

Total variance explained (%) 70.848. Values with factor loadings above 0.40 are shown in bold for emphasis.
Rotation method
As seen in Table 5, many indices were used to examine the fit of the model belonging to the Scale of Eight Personal Characteristics Related to Vitality. Of these, χ 2/SD value was determined as 5.53, GFI 0.96, AGFI 0.95, CFI 0.96, RMSEA 0.066, and SRMR 0.059. As a result of the relevant fit index values, it was decided that the model was acceptable in its current state.
Results of the fit index for Eight Personal Characteristic Scales related to vitality

Confirmatory factor analysis
As seen in Figure 1, the model was accepted as it was in its original structure without any modification. The factor loadings of the scale ranged from 0.34 to 0.83. The t value of all items was above 1.96 (8.01-37.27). No modification was applied to improve the scale.
Turkish Version of the Eight Personal Characteristics Scale Related to Vitality PATH Diagram.

Internal Validity
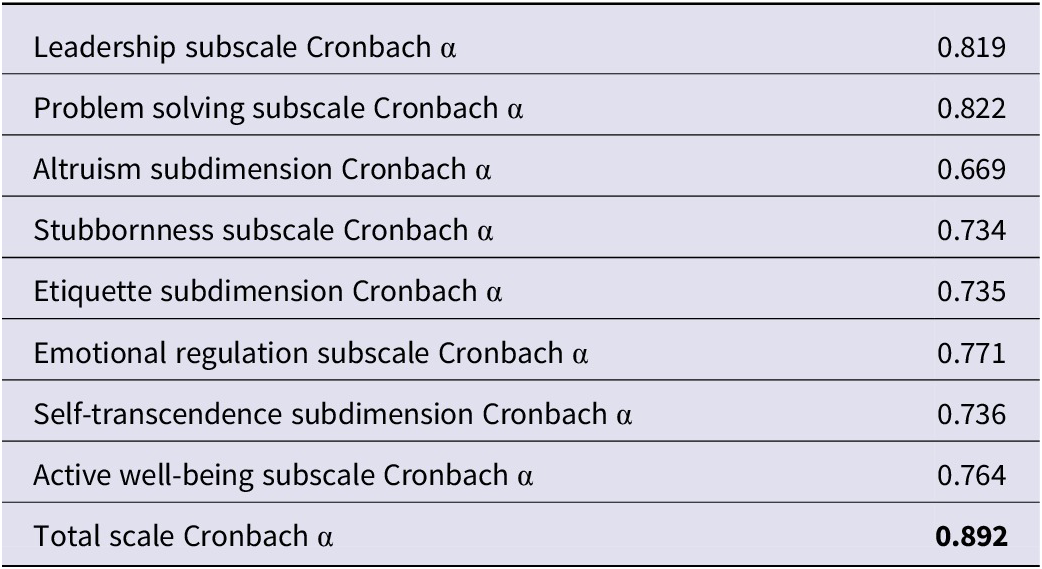
As seen in Table 6, the Cronbach α of the “Leadership” subdimension of the Eight Personal Characteristics Scale Related to Vitality was determined as 0.819, the Cronbach α of the “Problem Solving” subdimension as 0.822, the Cronbach α of the “Sacrifice” subdimension as 0.669, the Cronbach α of the “Stubbornness” subdimension as 0.734, the Cronbach α of the “Etiquette” subdimension as 0.735, the Cronbach α of the “Emotional Regulation” subdimension as 0.771, the Cronbach α of the “Self-Transcendence” subdimension as 0.736, and the Cronbach α of the “Active Well-Being” subdimension as 0.764.
Subdimensions and Cronbach α coefficients of the Eight Personal Characteristic Scales related to vitality

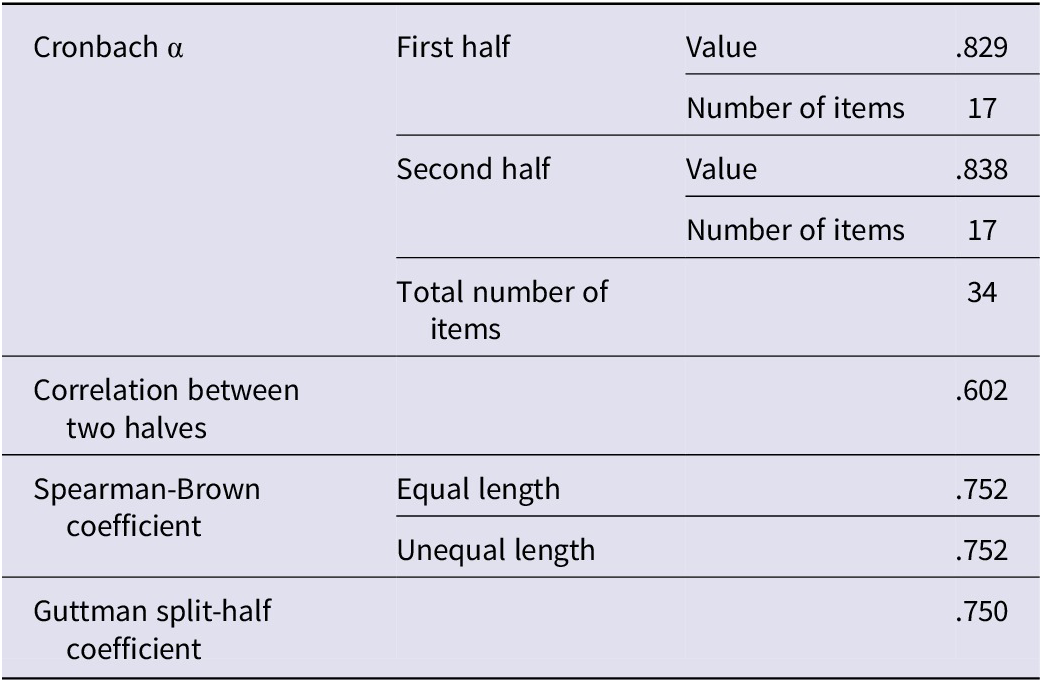
For the internal consistency reliability coefficient of the Eight Personal Characteristics Scale Related to Vitality, the scale was divided into 2 halves and the consistency values for the 2 halves are given in Table 7. When Table 7 is examined, it is found that the split-half reliability values for the internal consistency of the Eight Personal Characteristics Scale Related to Vitality were at an acceptable level. This value was found to be 0.829 for the first half of the scale, consisting of 17 items, and 0.838 for the second half, consisting of 17 items. According to the results, the correlation between the 2 halves was 0.602; the Spearman-Brown coefficient was 0.752, and the Guttman split-half coefficient was 0.750, and it was determined that the internal consistency reliability of the scale was good. These findings show that the internal consistency reliability of the Eight Personal Characteristics Scale Related to Vitality was sufficient.
Split-half reliability values of Eight Personal Characteristic Scales related to vitality

Discussion
Turkey is a region that experiences frequent earthquakes that pose a constant threat to its residents. The last earthquake in February 2023 had a profound impact on densely populated settlements in southern Turkey and on many people who were directly or indirectly affected by this traumatic life event. In this section of the study, the validity and reliability properties of the Turkish version of the Scale of Eight Personal Characteristics Related to Survival in Disasters are discussed.
The mean age of the participants participating in the study was 24.09 ± 7.60, 72.7% (n = 380) were female, 59.5% (n = 311) were insured by Social Security, and 85.1% (n = 445) had experienced a disaster. The type of disaster experienced by the participants was 79.2% (n = 359) earthquake and 64.6% (n = 338) did not lose their relatives in disasters. Of those who lost, 43.2% (n = 80) lost their relatives, 60% (n = 30) lost their friends, and 62.5% (n = 10) lost their homes. In the original scale, 27.7% of the participants were between the ages of 60 and 69, 58.9% were female, and 38.1% had lost a friend.Reference Sugiura, Sato and Nouchi22 In the study conducted by Sugiura et al. with 959 people titled “Survival-oriented personality factors are associated with various types of social support in an emergency disaster,” 575 of the participants were female.Reference Sugiura, Nouchi, Honda, Sato, Abe and Imamura35 In the study conducted by Ishibashi et al. for the Development of the 16-Question Vitality Questionnaire, data were collected from 564 male and 832 female participants in their 20s and 80s.Reference Ishibashi, Nouchi, Honda, Abe and Sugiura31 Our study sample is similar to other studies.
The Social Security Institution (SGI) is an organization established to run a social security system based on insurance risks and statistics, based on social insurance principles, in a fair, effective, and financially sustainable manner, with modern standards. The conditions and amounts of insurance benefits to be provided to the insured are determined in advance, and services are provided in long- and short-term insurance branches. The social security system, as required by the social state, is established without considering the one-to-one benefit/cost balance, unlike private insurance. The financing of the insurance system is provided through premiums received, and premiums received from active insured individuals are used to cover the payments of all insured individuals. This type of financing is called the distribution method and is based on the principle of sharing between generations.32, 33 Germany uses the term “Medicare” to refer to private health insurance (PHI) and statutory health insurance (SHI); Canada uses the term “Medicare” to refer to the Integrated Health and Hospital Insurance Programs; the Netherlands uses compulsory national health insurance; and the United States uses Medicare for adults aged 65 and over, those with disabilities or chronic diseases, and Medicaid, a state and federally funded program for children, pregnant women, and low-income individuals.34, 36, Reference Diğer and Bilgin37
Content validity is performed to evaluate whether a scale and its subdimensions measure the desired characteristic and whether there are different concepts than the one intended to be measured.Reference DeVellis and Thorpe38–Reference Tabachnick, Fidell and Ullman40 CVI is determined by calculating the agreement between the opinions of 3-20 experts.Reference DeVellis and Thorpe38, Reference Johnson and Christensen39 In this study, the content validity of the scale was evaluated by ten experts, and CVI was used in the evaluation of expert opinions. In this study, CVI was determined to be between 0.80 and 1.00. CVI >0.80 indicates the agreement between the evaluators and the adequacy of the scale in terms of content validity.Reference Polit and Beck29, Reference Johnson and Christensen39, Reference Özdamar41 In this study, it was determined that the scale adapted to Turkish met this requirement. In fact, when the values suggested for CVI were examined, it was seen that these values and the content validity of the Turkish form were quite high. When the content validity of the original study was examined, it was determined that it had similar characteristics to this study.Reference Sugiura, Sato and Nouchi22 As a result, it was seen that the scale adequately measured the subject and that content validity was achieved in the Turkish sample.
In order to apply factor analysis in scale adaptation studies, the sample size must be a certain size, and the KMO coefficient and Bartlett’s test are used to check whether the study data are suitable for factor analysis.Reference Tabachnick, Fidell and Ullman40–Reference Kartal and Bardakçı42 In the literature, the Bartlett’s test value is expected to be statistically significant (P <.001) and the KMO coefficient is expected to be at least 0.50 and above.Reference DeVellis and Thorpe38, Reference Field43 In this study, the KMO coefficient being 0.50 and above and the Bartlett’s test being significant (P = .000) indicate that the sample size is at a fairly good level.
It was determined that the Scale of Eight Personal Characteristics Related to Vitality consists of 8 subdimensions and 34 items in both its original form and its Turkish adaptation. There will inevitably be changes in the structure of a scale that is translated from another language to Turkish and adapted to a different culture.Reference Seçer25, Reference DeVellis and Thorpe38, Reference Kartal and Bardakçı42 It is emphasized in the literature that the total variance explained should be 40% and above and that the higher the total variance explained, the stronger the construct validity of the scale will be.Reference Seçer25, Reference Johnson and Christensen39, Reference Tabachnick, Fidell and Ullman40, Reference Kartal and Bardakçı42, Reference Karagöz44 The total variance explained in this study was found to be 70.848%. When the results of this study were compared with the original study, the total variance explained in the Turkish sample was 40% above, just like the original study. This showed that the concepts were measured well in the Turkish sample as well. The factor loadings found as a result of EFA in the literature are expected to be 0.30 and above.Reference Tabachnick, Fidell and Ullman40, Reference Özdamar41 It was determined that the factor loadings in this study ranged between 0.406 and 0.802. This result shows that the scale in this study has a strong factor structure.
According to CFA fit indices in the literature, χ2/SD, GFI, AGFI, CFI, RMSEA and SRMR values should be at the desired level.Reference Tabachnick, Fidell and Ullman40–Reference Kartal and Bardakçı42, Reference Karagöz44 For an acceptable fit, it is expected that the χ2/SD value should be less than 5, GFI, AGFI, and CFI values should be above 0.90, and RMSEA and SRMR values should be below 0.08.Reference Tabachnick, Fidell and Ullman40, Reference Karagöz44 The fit indices of this study were determined as follows: χ2/SD = 5.53, GFI = 0.96, AGFI = 0.95, CFI = 0.96, RMSEA = 0.066, and SRMR = 0.059 These results show that this study has an acceptable fit level. In the literature, it is expected that the factor loadings of all subdimensions obtained as a result of CFA should be 0.30 and above.Reference Özdamar41, Reference Kartal and Bardakçı42 The EFA and CFA results in this study supported the construct validity of the scale and proved that the scale is a valid measurement tool.
In Likert-type scale adaptation studies, one of the criteria used to evaluate the homogeneity and reliability of the scale and its subdimensions is internal consistency.Reference Seçer25, Reference Johnson and Christensen39, Reference Kartal and Bardakçı42, Reference Karagöz44 The most frequently used parameter in assessing internal consistency is Cronbach α reliability coefficient.Reference Seçer25, Reference Kartal and Bardakçı42 Cronbach α coefficient is evaluated as “not reliable” between 0.00 and 0.40, “low reliability” between 0.40 and 0.60, “quite reliable” between 0.60 and 0.80, and “quite reliable” between 0.80 and 1.00. Reference Seçer25, Reference Johnson and Christensen39, Reference Tabachnick, Fidell and Ullman40 In this study, the Cronbach α value of the scale varied between 0.892 for the entire scale and between 0.669 and 0.822 for its subdimensions. These alpha values obtained in the study show that the entire scale and its subdimensions are quite reliable and that the scale is suitable for use by researchers. Sugiura et al. determined that the Cronbach α values of the subdimensions ranged between 0.74 and 0.91. This result showed that the adapted version of the scale was similar to the original structure and had a fairly reliable internal consistency.Reference Sugiura, Sato and Nouchi22
Internal consistency reliability is also assessed using the split-half method.Reference Sugiura, Sato and Nouchi22, Reference Tabachnick, Fidell and Ullman40, Reference Özdamar41 In split-half analysis, it is expected that the Cronbach α values of both halves are >0.70, that there is a strong and significant relationship between the 2 halves, and that both the Spearman-Brown and Guttman split-half coefficients are >0.70.Reference Tabachnick, Fidell and Ullman40–Reference Kartal and Bardakçı42 In this study, the results of the split-half analysis showed that the Cronbach α values of both halves are >0.70 and that the Spearman-Brown and Guttman split-half coefficients are >0.70. These results showed that the scale has a high level of reliability, that the items are related to each other, and that they adequately represent the structure intended to be measured. Since Sugiura et al. did not perform a split-half analysis for the original scale, the results of the current study could not be compared with the original study.Reference Sugiura, Sato and Nouchi22
The item-total score correlation explains the relationship between the score obtained from each item in the measurement tool and the total score. A high item-total score correlation indicates that the relevant item is suitable for the theoretical structure being measured, and the correlation coefficient is expected to be 0.20 and above.Reference Johnson and Christensen39, Reference Kartal and Bardakçı42 In this study, item-total score and item-subdimension score correlations were found to be >0.20. Since the item-total score correlation analysis of the scale and its subdimensions was not presented in the original study,Reference Sugiura, Sato and Nouchi22 the results could not be compared. According to the results of this study, all items are consistent with the theoretical structure and the scale is reliable.
The findings of this study should be interpreted within the framework of certain limitations. Firstly, the research was conducted approximately 1 year after the earthquake. This timing may have introduced retrospective biases such as memory-related errors and limited accuracy. Additionally, the demographic characteristics of the sample and the data collection method also present certain limitations. The majority of the participants were young individuals (mean age = 24.09), and 72.7% were female. Furthermore, data were collected through an online platform, which may have excluded individuals without internet access and possibly led to underrepresentation of certain groups, such as those living in rural areas or elderly individuals. Therefore, it should be acknowledged that the study may not fully reflect regional diversity and may lack sufficient representation of certain sociodemographic groups.
Another limitation stems from the self-reported nature of the data. Although the participants were theoretically capable of providing or receiving social support, the inherently subjective nature of such behavior makes it difficult to objectively define and accurately characterize the population. For these reasons, the results cannot be directly generalized to the broader Turkish population. Future research is recommended to include larger, more balanced, and more representative samples.
Conclusions and Recommendations
In this study, as a result of the analysis and evaluations made, it was determined that the Scale of Eight Personal Characteristics Related to Vitality, which was used to determine the personal characteristics of individuals in the face of disaster, was a valid and reliable measurement tool for the Turkish sample. It draws attention to the importance of research on earthquake fear and the need for future studies to develop disaster management strategies. Using this scale, researchers can determine the personal characteristics of individuals in the face of disaster and develop programs for this purpose. They can also conduct cross-cultural comparative studies using this scale. Future research should focus on improving the survival questionnaire to test the relationship between the questionnaire and disaster prevention education or actual behavior in emergencies. The Survival questionnaire is only a tool to measure survival-related personal characteristics and should be used in conjunction with other survival-related sociometric/psychometric measures to accurately estimate a person’s probability of successful survival.
Although the Turkish version of the scale appears promising in terms of validity and reliability, further evaluation and development in different populations and conditions are required to increase its generalizability. Future research could investigate how the scale relates to real earthquake experiences and assess the sensitivity of personal characteristics to changes over time. Comprehensive analyses could be conducted by applying the scale to different age groups and disaster types. Testing in vulnerable groups such as children, adolescents, and elderly individuals could help determine whether the performance is valid for individuals with different demographic characteristics.
Acknowledgments
Thank you to everyone who participated in our work.
Author contribution
Research idea: SDY and HE
Design of the study: SDY and HE
Acquisition of data for the study: SDY and HE
Analysis of data for the study: SDY and HE
Interpretation of data for the study: SDY and HE
Drafting the manuscript: SDY and HE
Revising it critically for important intellectual content: HK, SDY, and HE
Final approval of the version to be published: HK, SDY, and HE
Funding statement
No funding was received for this article.
Competing interests
The authors have no conflicts of interest to declare.
Ethical standard
This study was approved by the Ethics Committee of Gumushane University.