Introduction
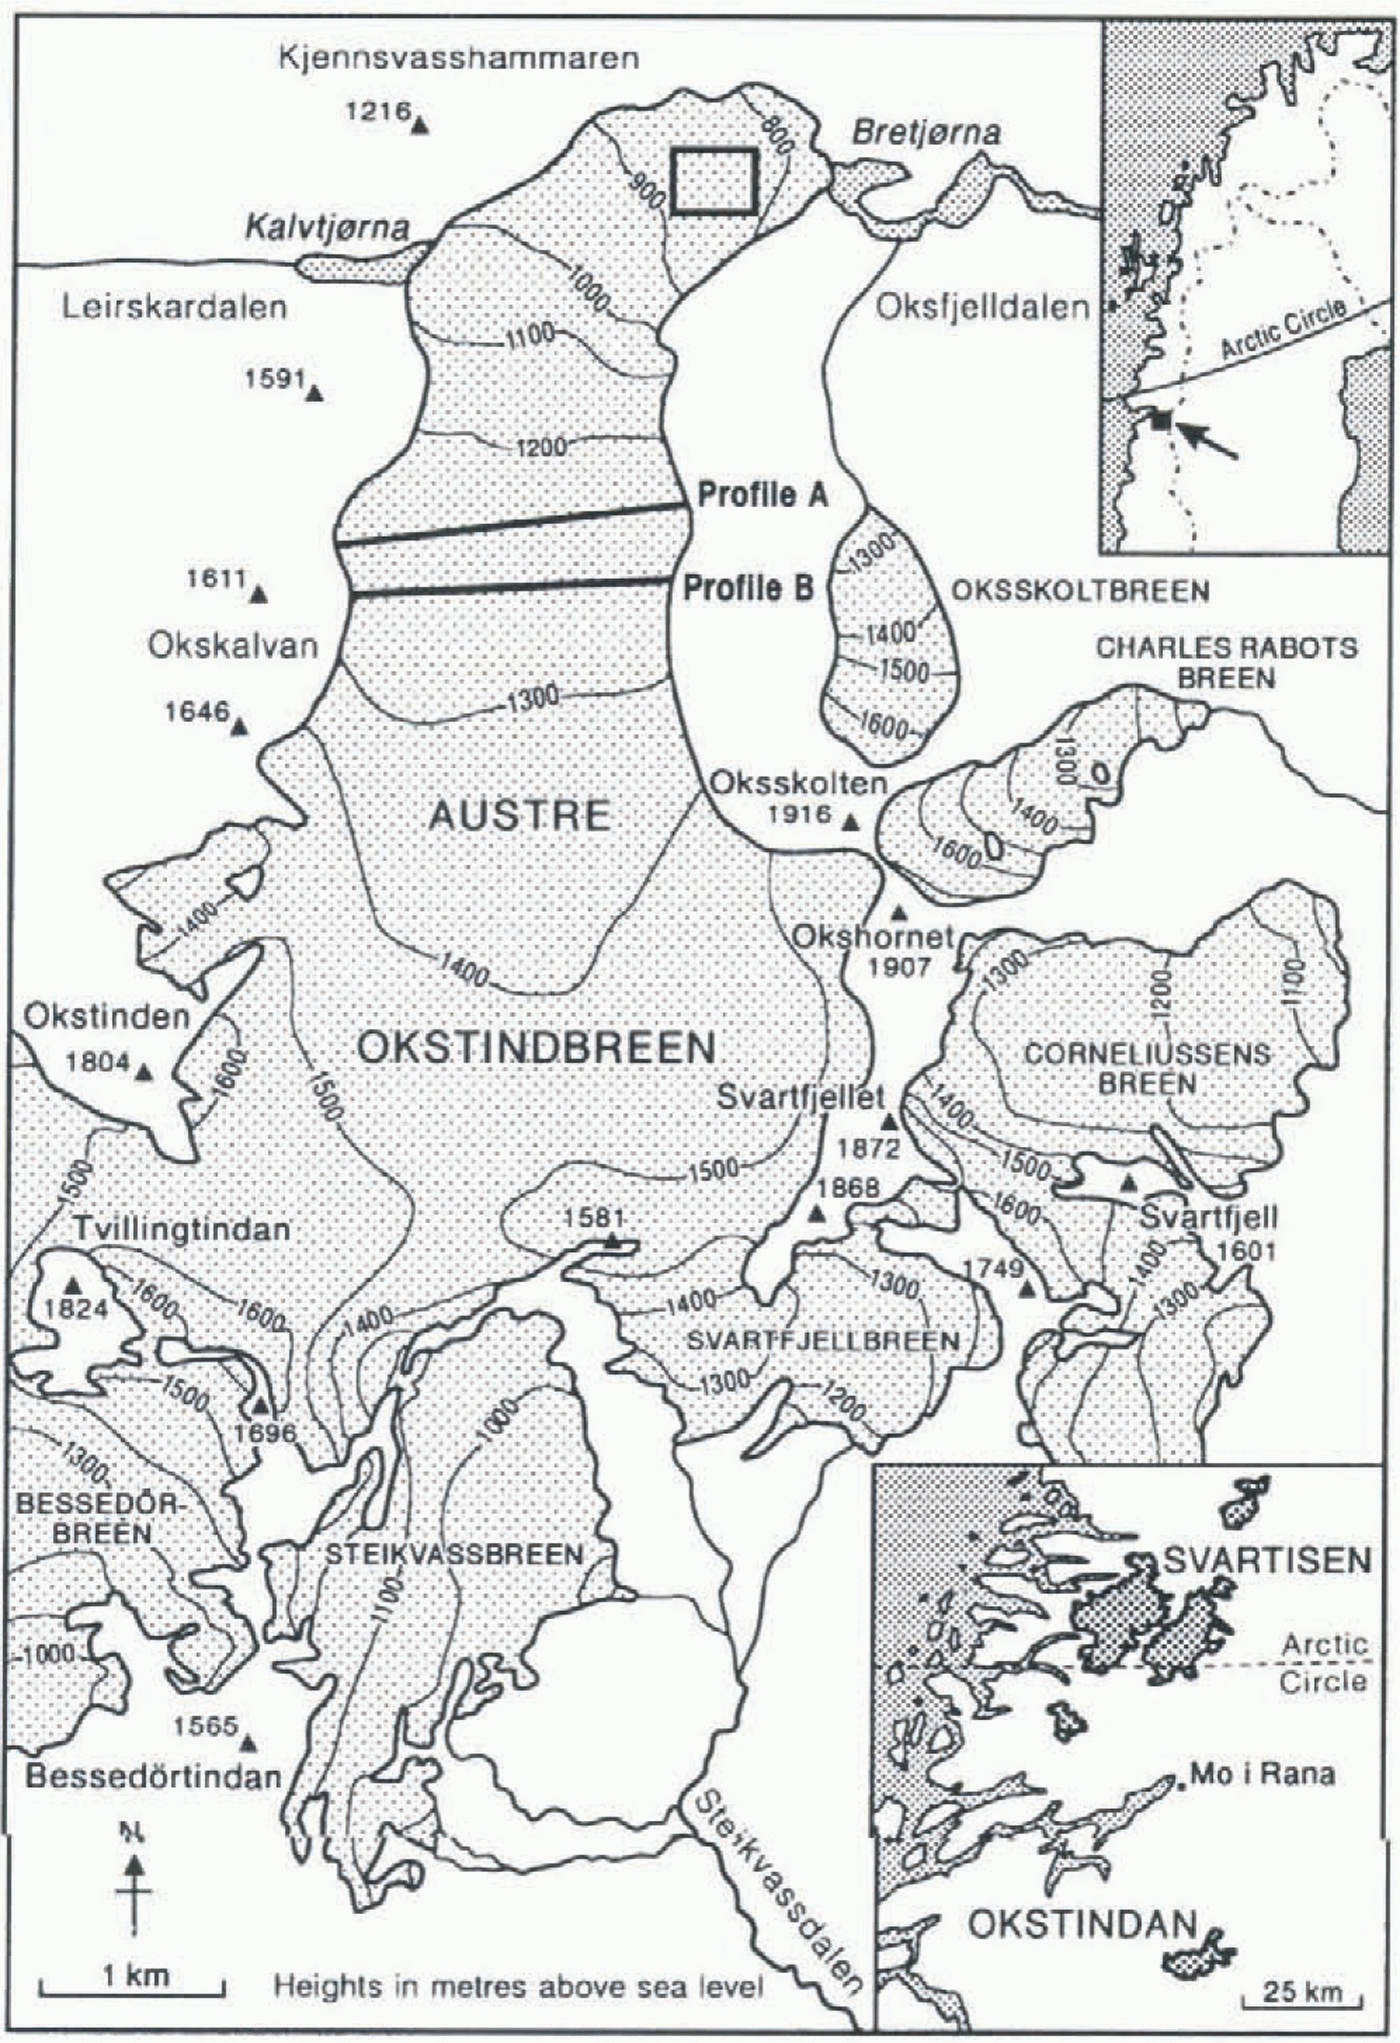
Local surface velocities have been reported from many valley glaciers, but long-term studies of the spatial distribution of the velocity field and strain distribution have been limited to a few cases. Such observations were carried out over a period of 19 years at the Norwegian glacier Austre Okstindbreen (Fig. 1), the largest of the 14 glaciers of the Okstindan area (66°01' N, 14°18' E). The glacier has a total planimetric area of 14.1 km2. Its southern boundary is an ice divide, about 1510 m a.s.l. Mountain ranges form most of its western and eastern margins. The accumulation zone rises to more than 1700 m on the mountain slopes, but most of it is below 1600 m. A heavily crevassed icefall, descending from about 1200 m to 1000 m, separates the upper and lower parts of the glacier. Below 1200 m, the glacier is confined to a curving channel, largely bordered by steep valley walls. It ends in a lake with a surface level of 733 m. The three-dimensional geometry of the glacier is well known as a result of radio-echo sounding carried out between 1991 and 1993, annual photogrammetric mapping of the lower part of the glacier between 1978 and 1992, and recent detailed surveys of the accumulation area surface topography (Jacobsen and Theakstone, 1997). Here, we report some results of studies of surface flow immediately above the icefall and in the zone between the lower part of the icefall and the terminus.
Austre Okstindbreen has retreated throughout the 20th century, and is now almost 2 km shorter than when it was studied for the first lime, in 1908 (Hoel, 1910). In the last few years, retreat has been accompanied by a marked steepening of the terminal zone. Mass-balance investigations at the glacier are included in the Norwegian national network (Haakensen, 1995). In 6 of the last 9 years, the mass balance has been positive. The mean equilibrium-line altitude (ELA) for the 9 year period was about 1250 m.
Investigations of surface and basal velocity variations at the lower part of the glacier were undertaken between 1976 and 1978 (Andreasen and Knudsen, 1985), and a more extensive programme of studies of surface deformation was carried out between 1979 and 1995. Stake positions were fixed either by theodolite intersection from stations on the adjacent valley sides and floor or by electronic distance measurement (EDM) from those stations, the positions of which were determined by theodolite triangulation. Stations above and below the icefall were linked by a static global positioning system survey in July 1995 (Jacobsen and Theakstone, 1997). During theodolite surveys, observations were made to the intersection of the stake and the glacier surface, the exposed length of the stake was measured and corrections were made for the tilt of the stake. During EDM surveys, the prism was placed at a fixed height above the ice surface, and similar corrections were made. Data were reduced to the bottom point of each stake. Errors of stake positions are considered to be within a few centimetres, and the calculated mean annual velocities were determined to within a few cm a−1. Here, we discuss the horizontal component of those velocities.
Flow above the ICE Fall, 1986–95
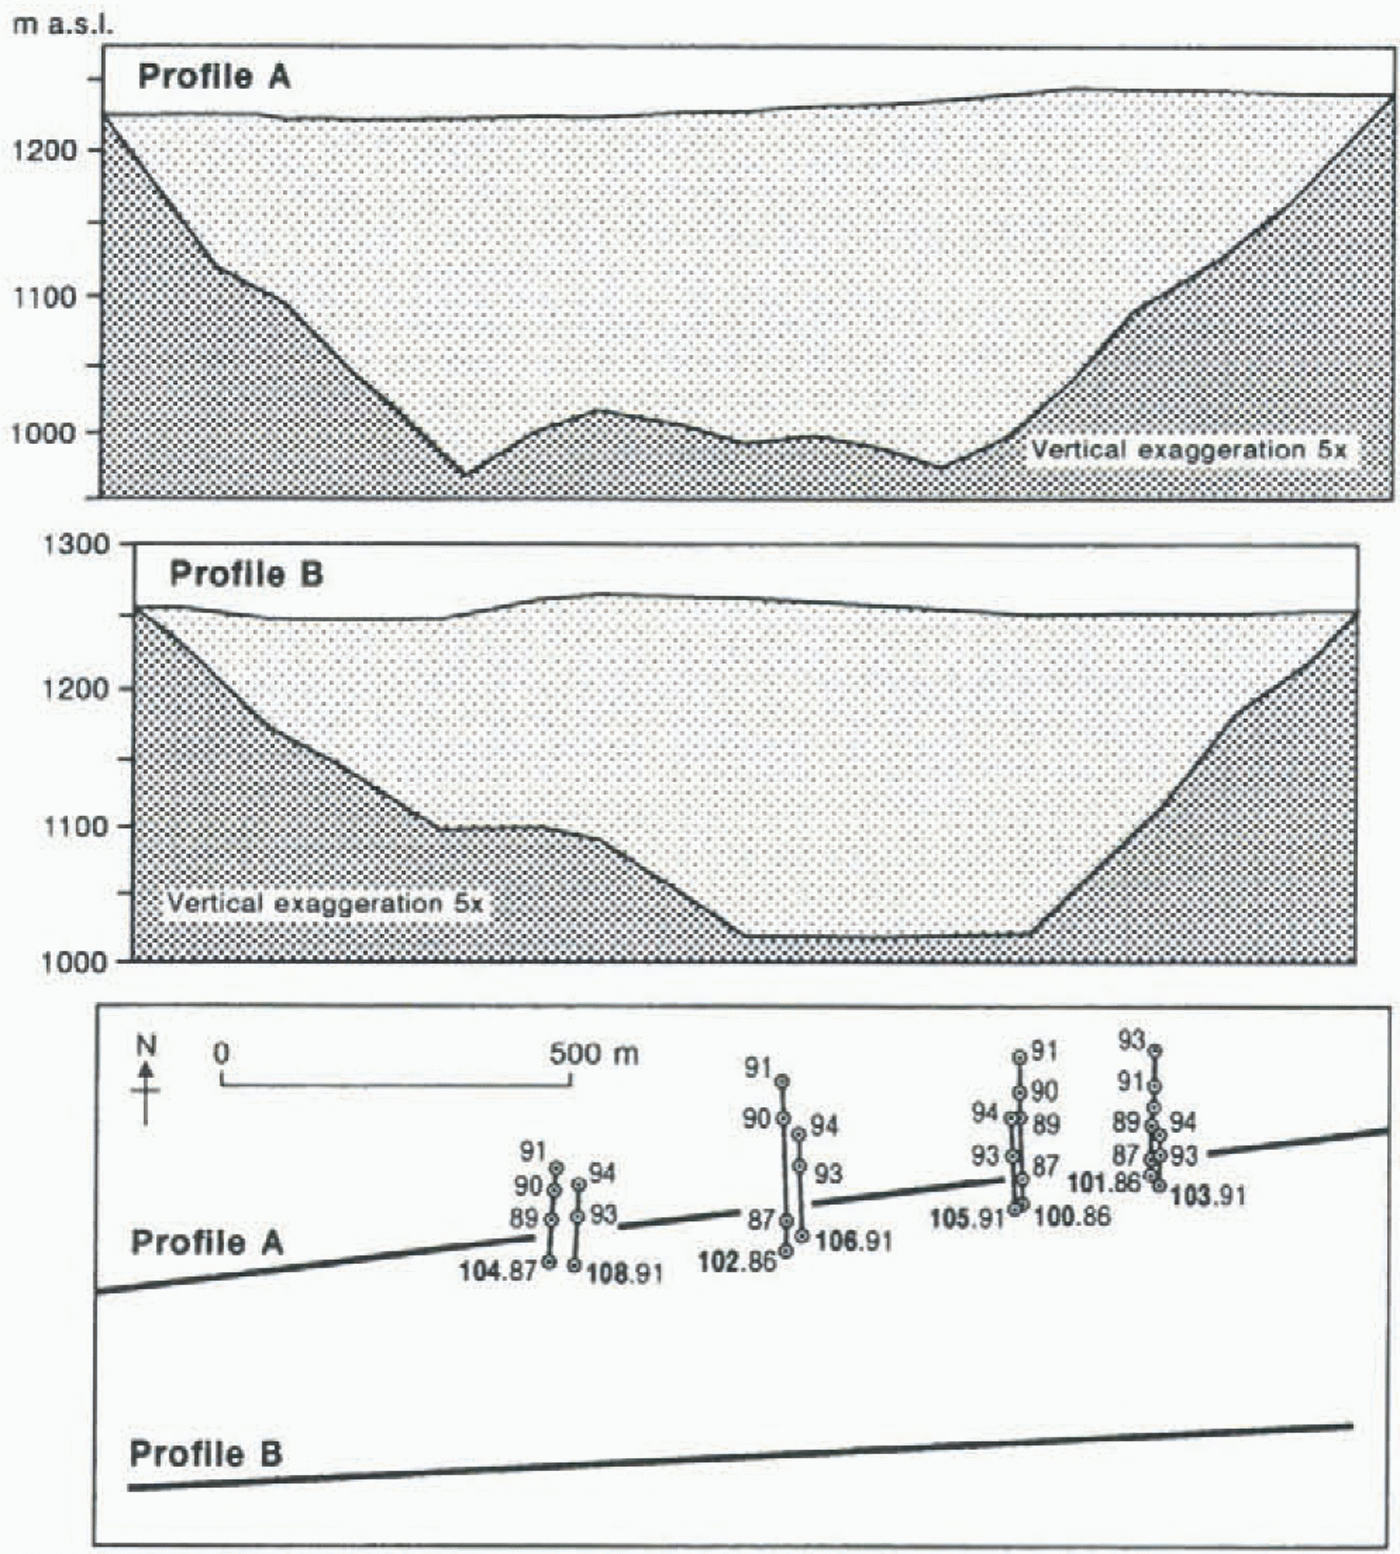
The lowest surveyed cross-section above the icefall was 18 km wide, but surface elevations on the profile differed by only 18 m. On a second cross-profile some 600–700 m further south, the highest point of the surface was 15 m above the lowest point (Fig. 2). The longitudinal gradient between the two sections ranged from 1.0° to 6.4°, and the
Austre Okstindbreen and adjacent glaciers of the Okstindan area, Norway. The positions of two cross-sections (Fig. 2) are shown. The box on the lower part of the glacier indicates the position of Figure 8.

elevation difference of points along flowlines nowhere exceeded 40 m.
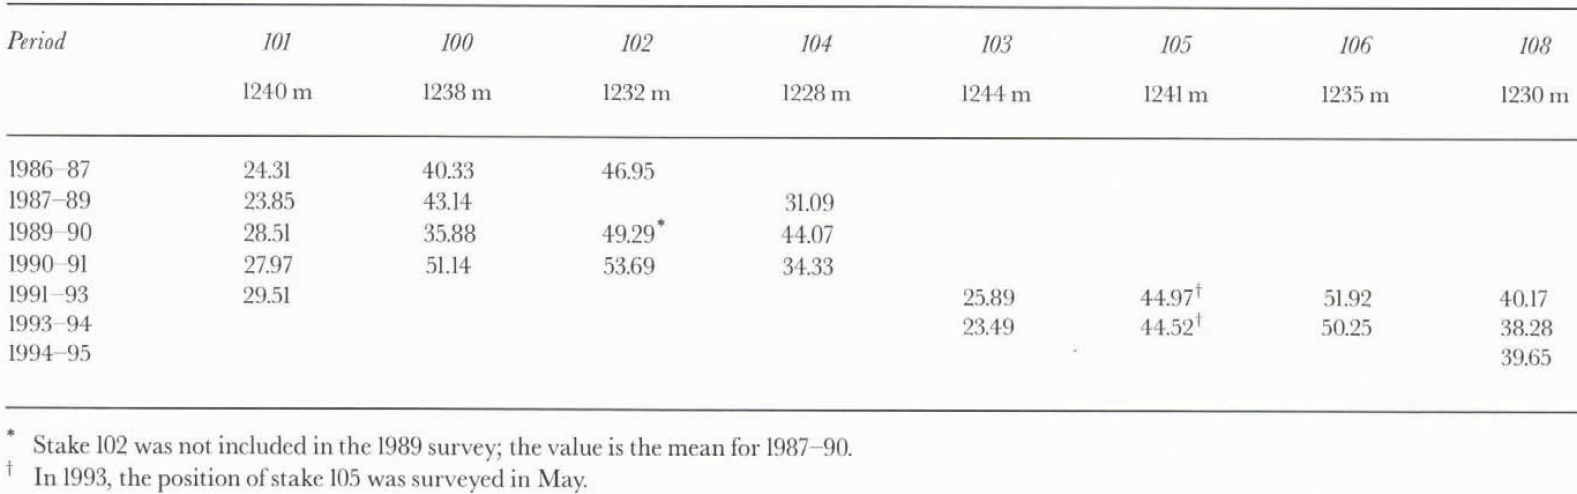
In 1986, three stakes were set out on a line across the glacier, 30–60 m up-glacier of the lower cross-profile, and a fourth was added in 1987 (Fig. 2). The positions of all four were surveyed each year, except in 1988, until they were lost in the heavily crevassed zone at the top of the icefall. Stakes 100, 102 and 104 were observed for the last time in July 1991, and stake 101, which moved more slowly, in July 1993. In 1991, another line of stakes (103, 105, 106, 108) was set out very close to the original positions of the first line, and their positions were surveyed in subsequent summers, except in 1992. As expected, stakes close to the centre line moved more rapidly than those nearer the valley sides, and the two which were closest to the margin (101 and 103) moved most slowly (Fig. 2).
Surface elevations and ice thickness surveyed at two cross-sections above the Austre Okstindbreen icefall in 1993. The movement of stakes at the glacier surface was observed between 1986 and 1994. The positions of the cross-sections are shown in Figure 1.
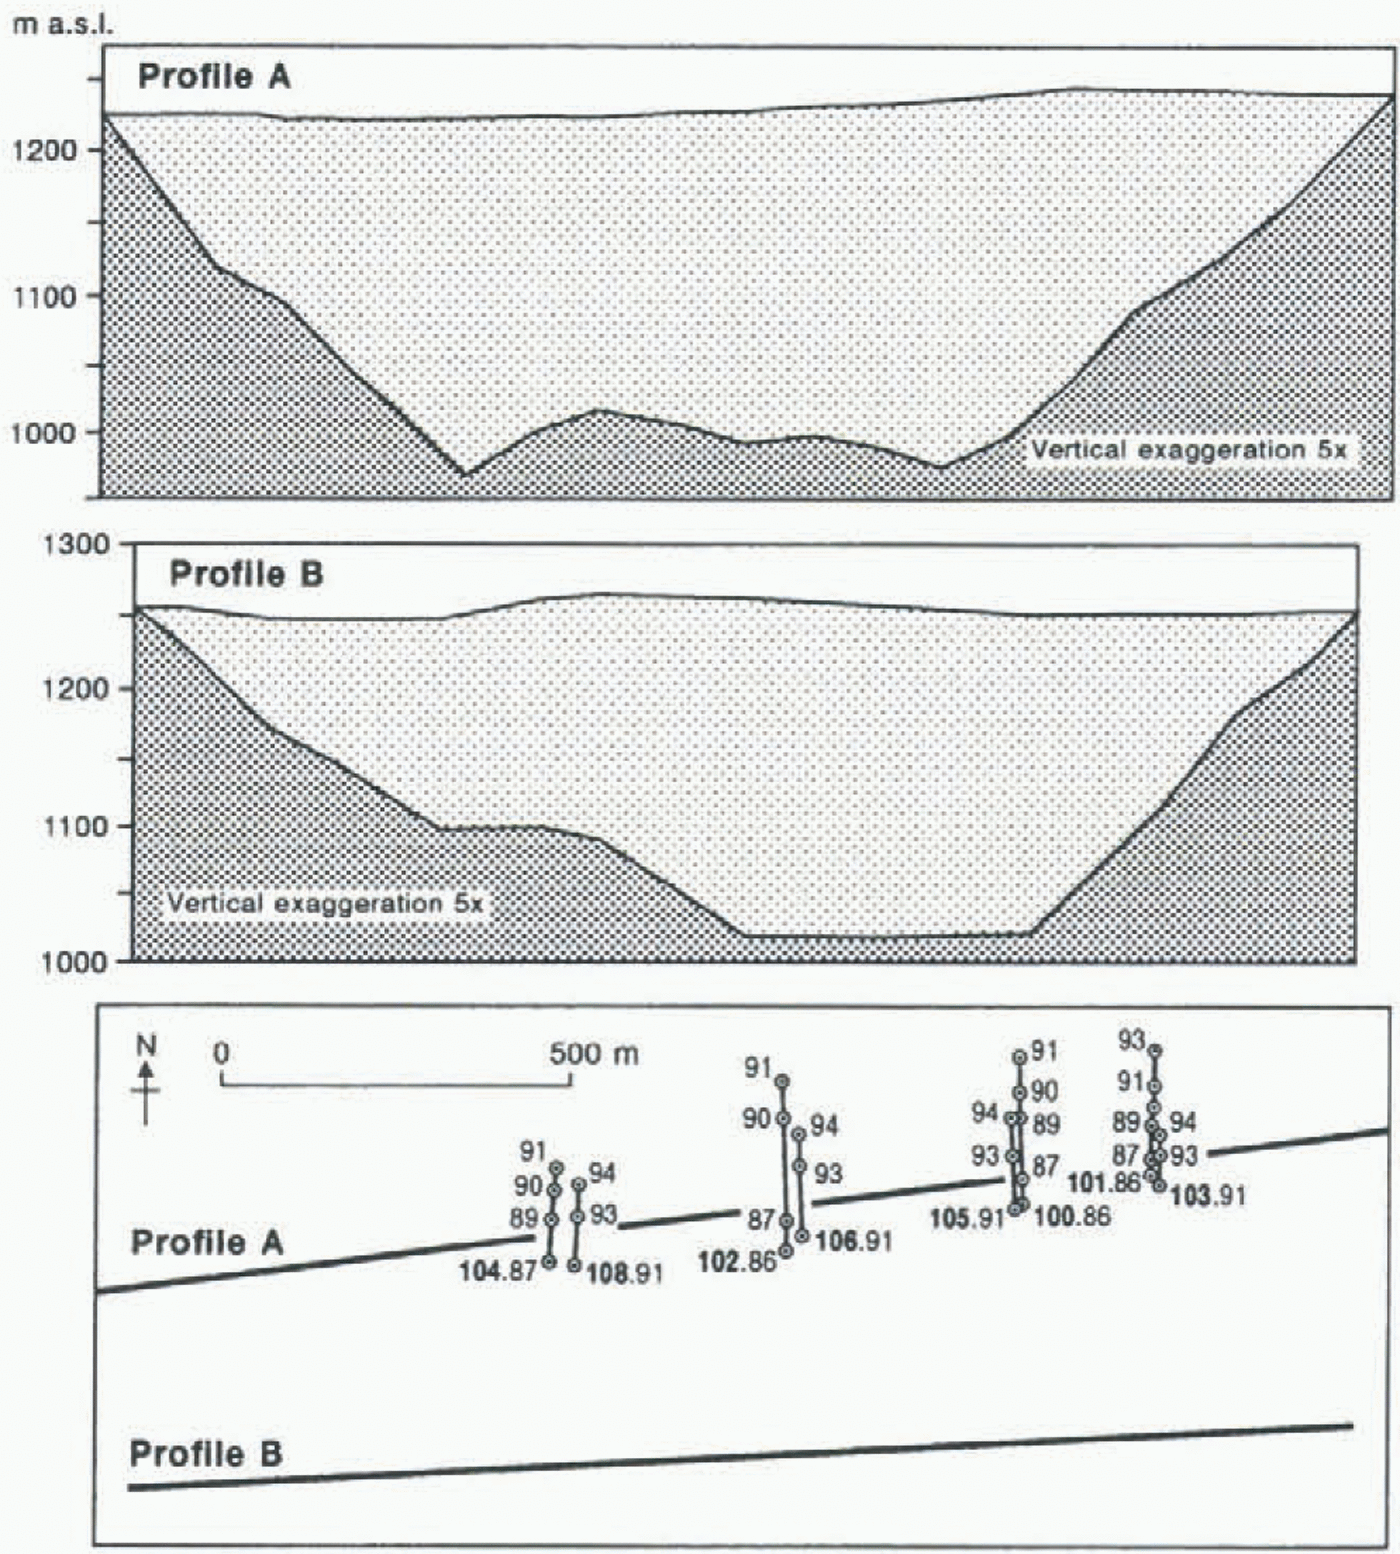
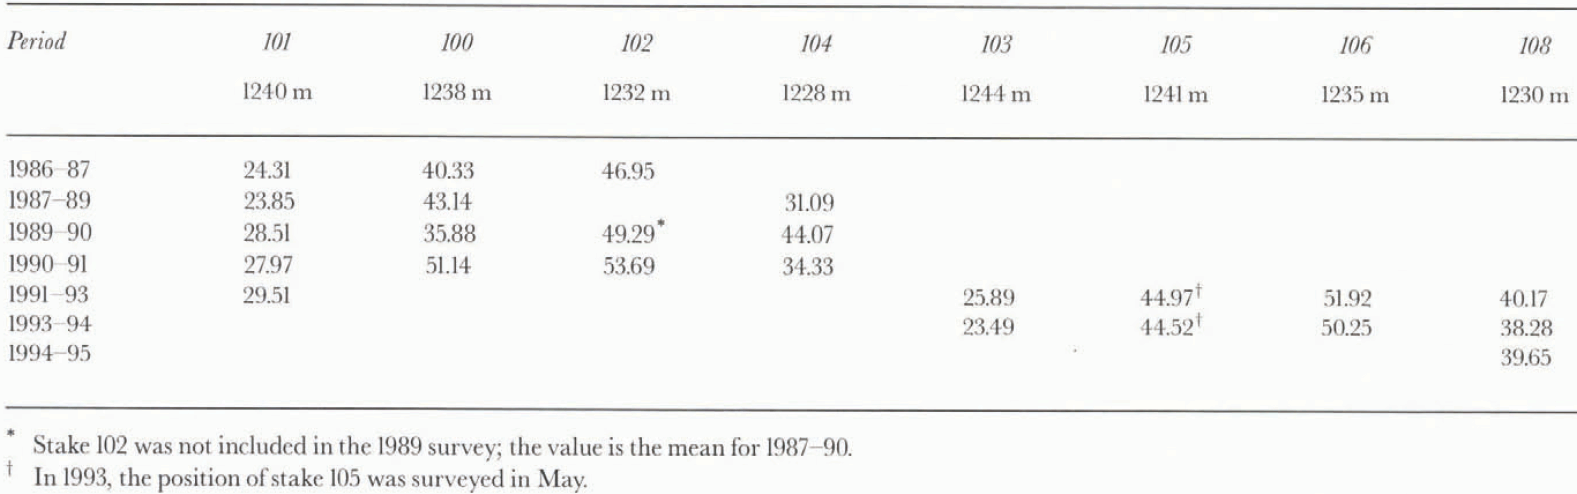
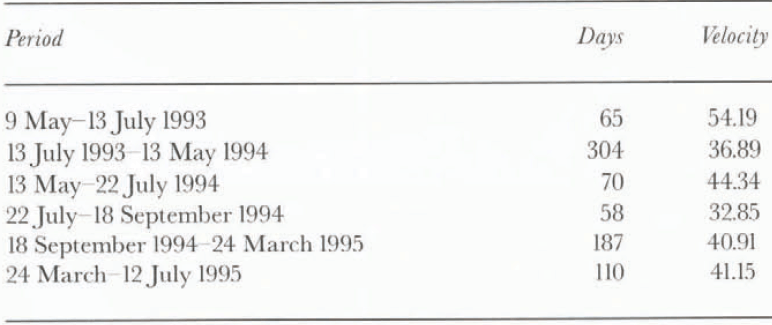
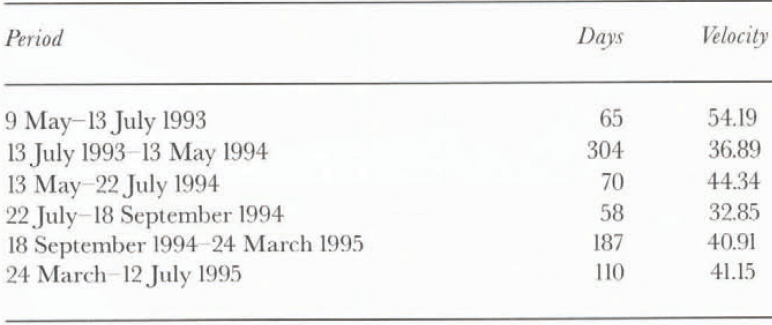
In general, mean annual velocities increased as stakes moved down-glacier through the zone of increasing gradient at the top of the icefall (table 1). This tendency was reflected in the increase of the distance separating stakes 101 and 103 between 1991 and 1993 (Fig. 2); the stakes were only a few metres away from a single particle path. The movement of slakes between successive annual surveys in July included periods in which velocities differed. Observations of stake 108 indicated that early summer (May–July) speeds were greater than those for the year as a whole, whilst the July–September velocity was lower (tables 1 and 2).
Mean annual velocities (m a-1) and original altitude (m) of stakes above the icefall. Mean annual velocities include seasonal variations (table 2)
Seasonal variations of velocity (m a-1), stake 108
Surface Flow of the Lower Glacier, 1976–78
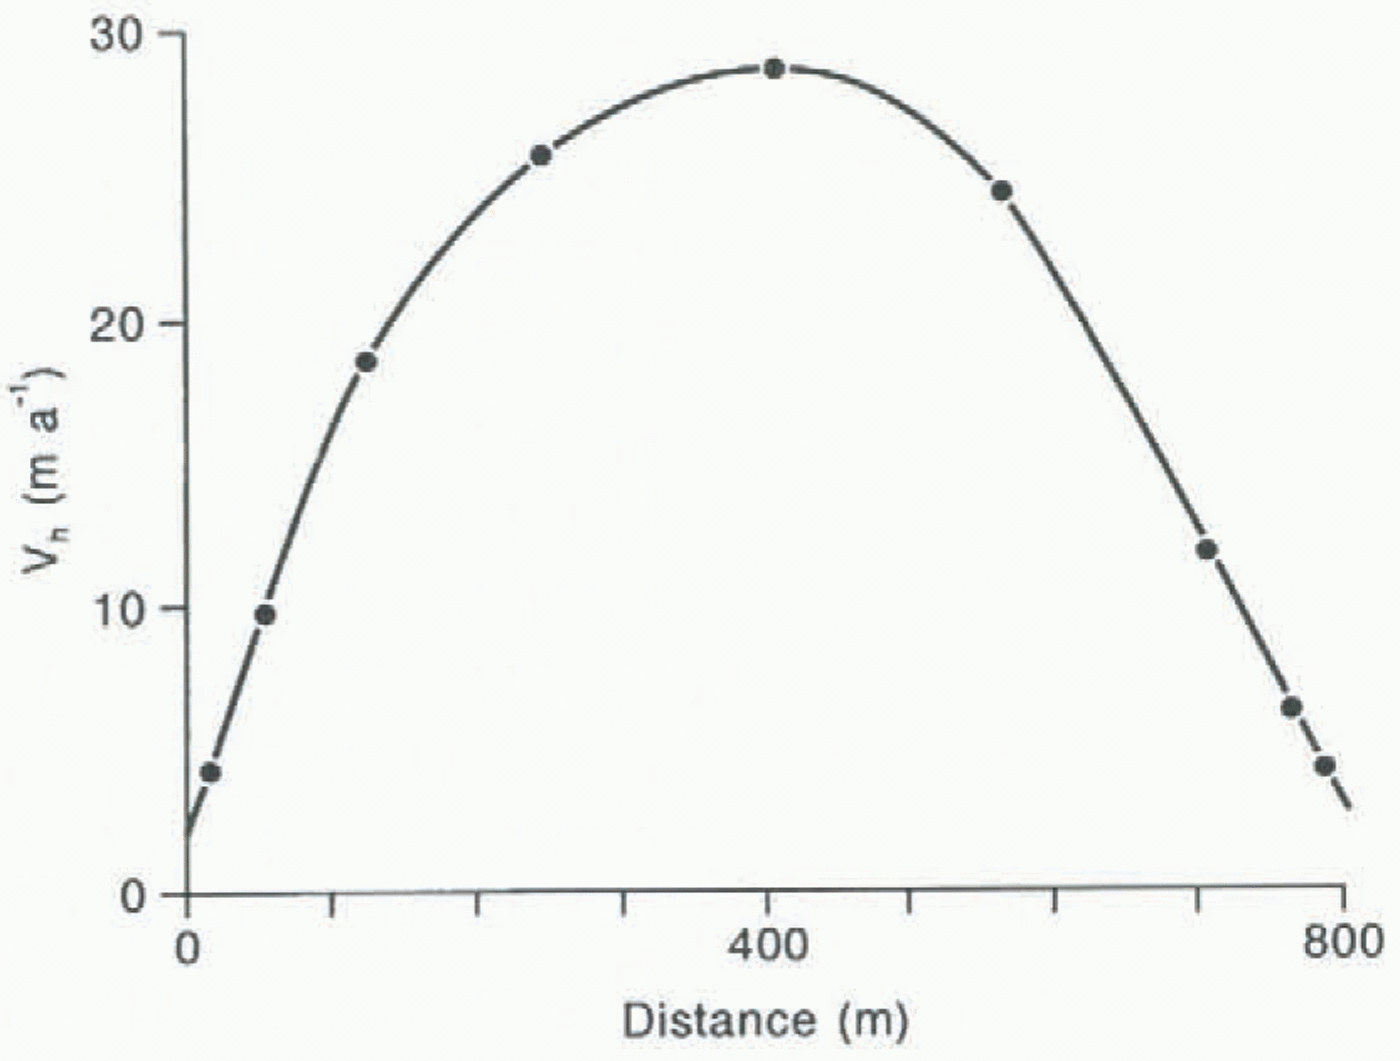
The thickness of Austre Okstindbreen decreases between the lower part of the icefall and the end of the glacier, although variations of elevation of the bed over the last 1000 m are small. Seven stakes, spaced at intervals of 200–250 m, were set in the glacier surface along the assumed centre line of flow through this zone in July 1976, with the highest slake at about 960 m a.s.l. At the same time, a transverse line of nine stakes was set out across the 800 m wide tongue at a height of about 840 m. In the following 2 years, the stakes adjacent to the sides of the glacier moved only about 8 m (Fig. 3), indicating that marginal sliding at the
Transverse, variations of surface flow at about 840 m a.s.l., 1976–78. Values are extrapolated to the positions of the glacier margin in July 1978. The northern margin is at the left.
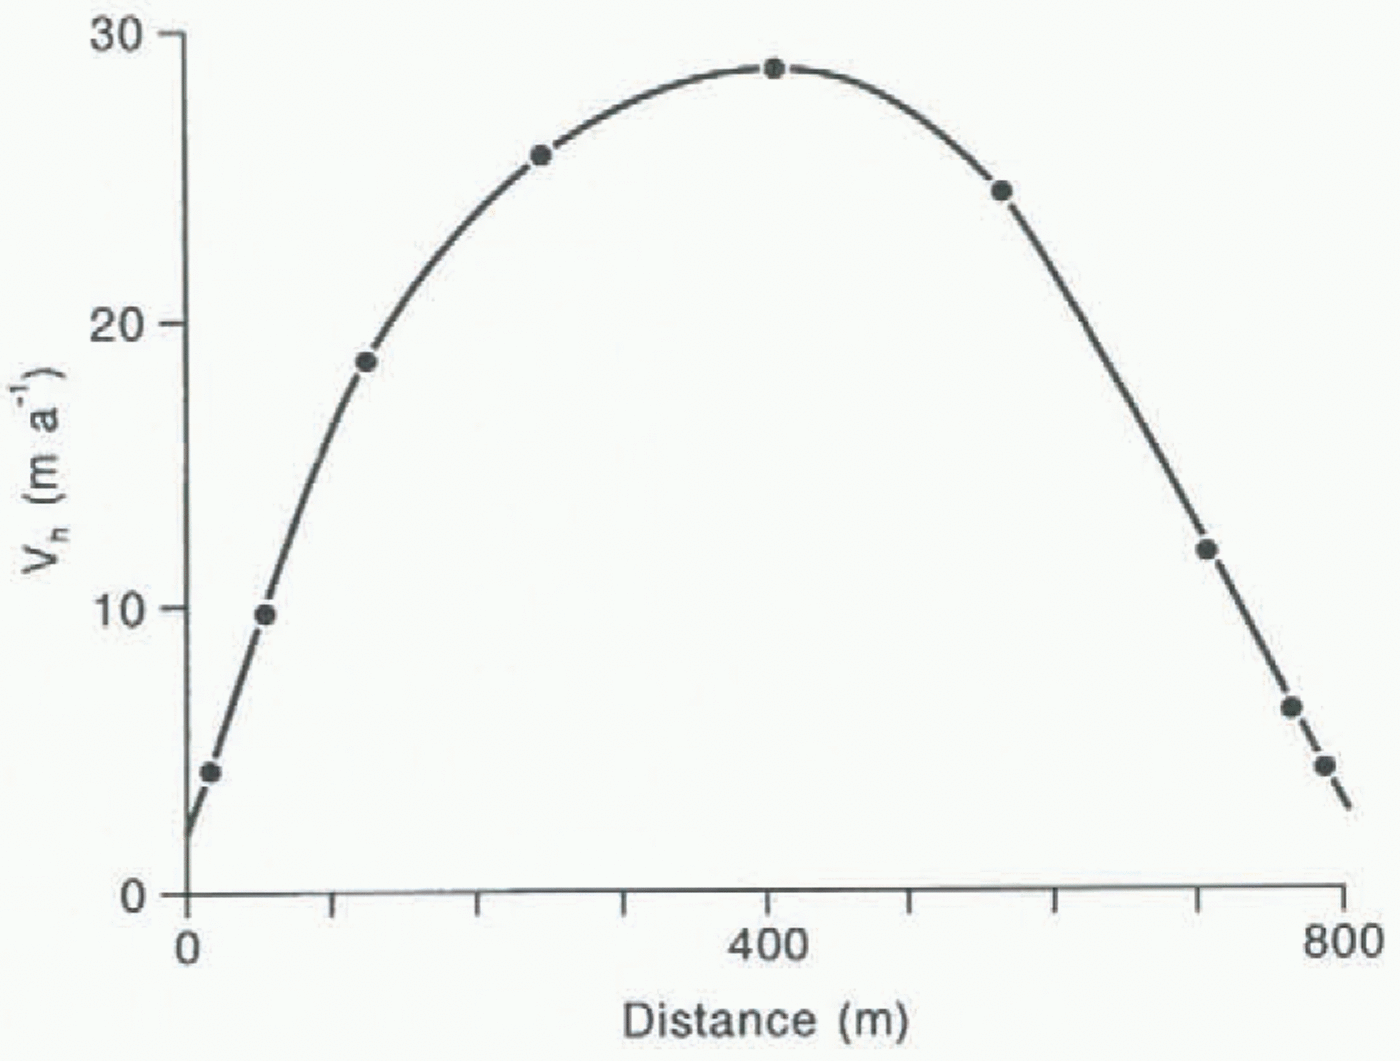
cross-profile was very slight and less than 12% of the centre-line velocity (Andreasen, 1983; Andreasen and Knudsen, 1985). The transverse velocity profile was slightly asymmetric, with the velocity maximum on the inner (southern) side of the geometric centre line, and with steeper gradients towards that side of the curving channel. The mean velocities of stakes along the curving longitudinal line decreased from about 56 m a−l at 960 m to 12 m a−1 at 745 m.
Surface Flow of the Lower Glacier, 1979–95
Spatial variations
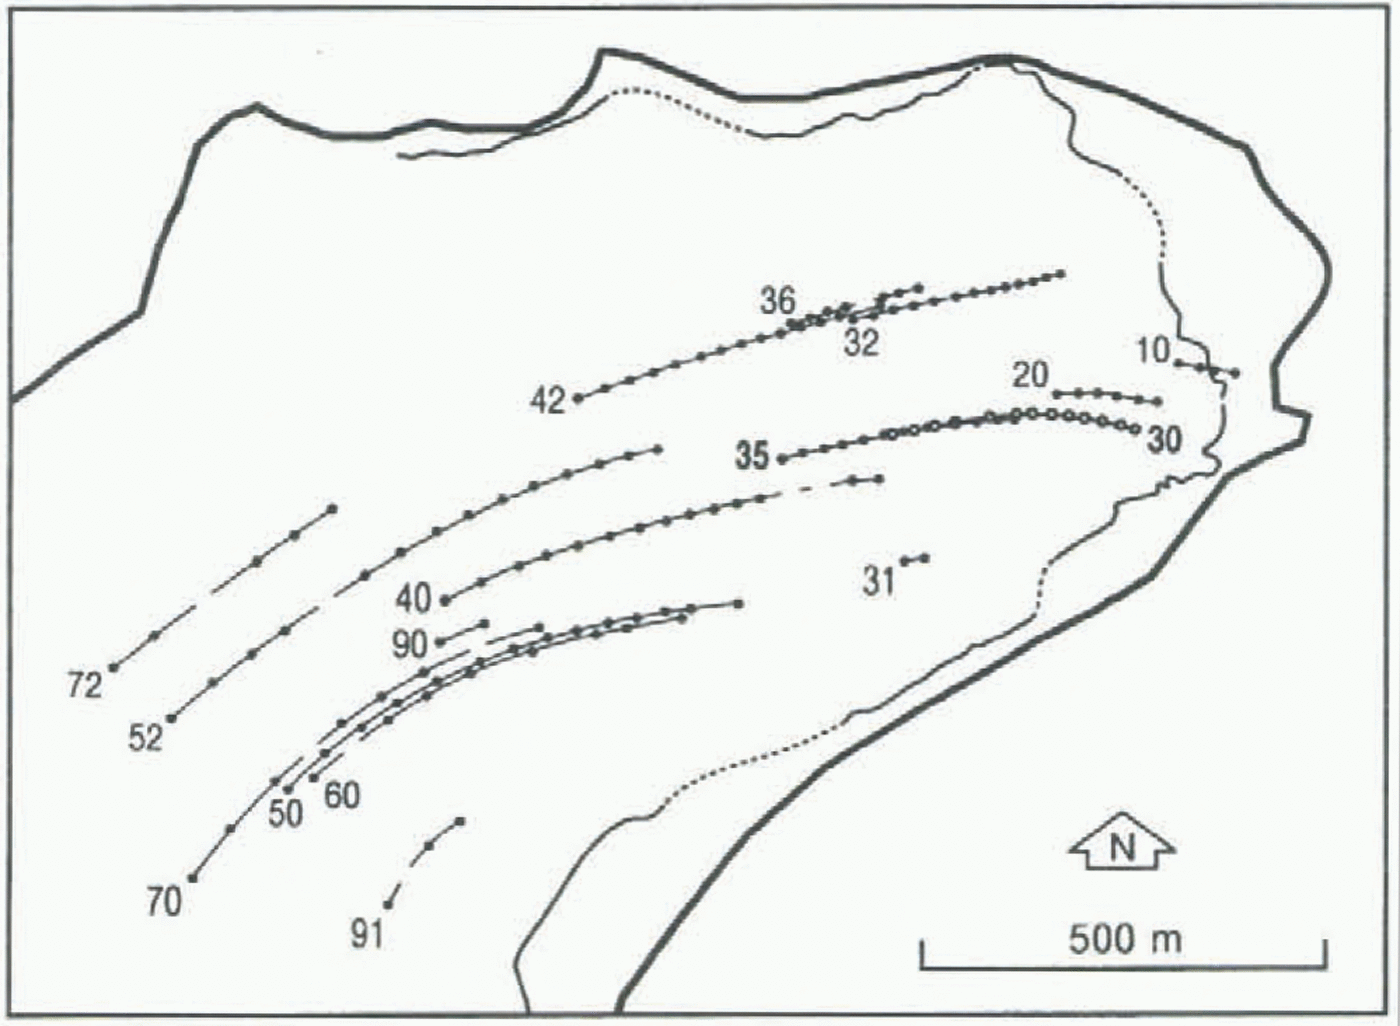
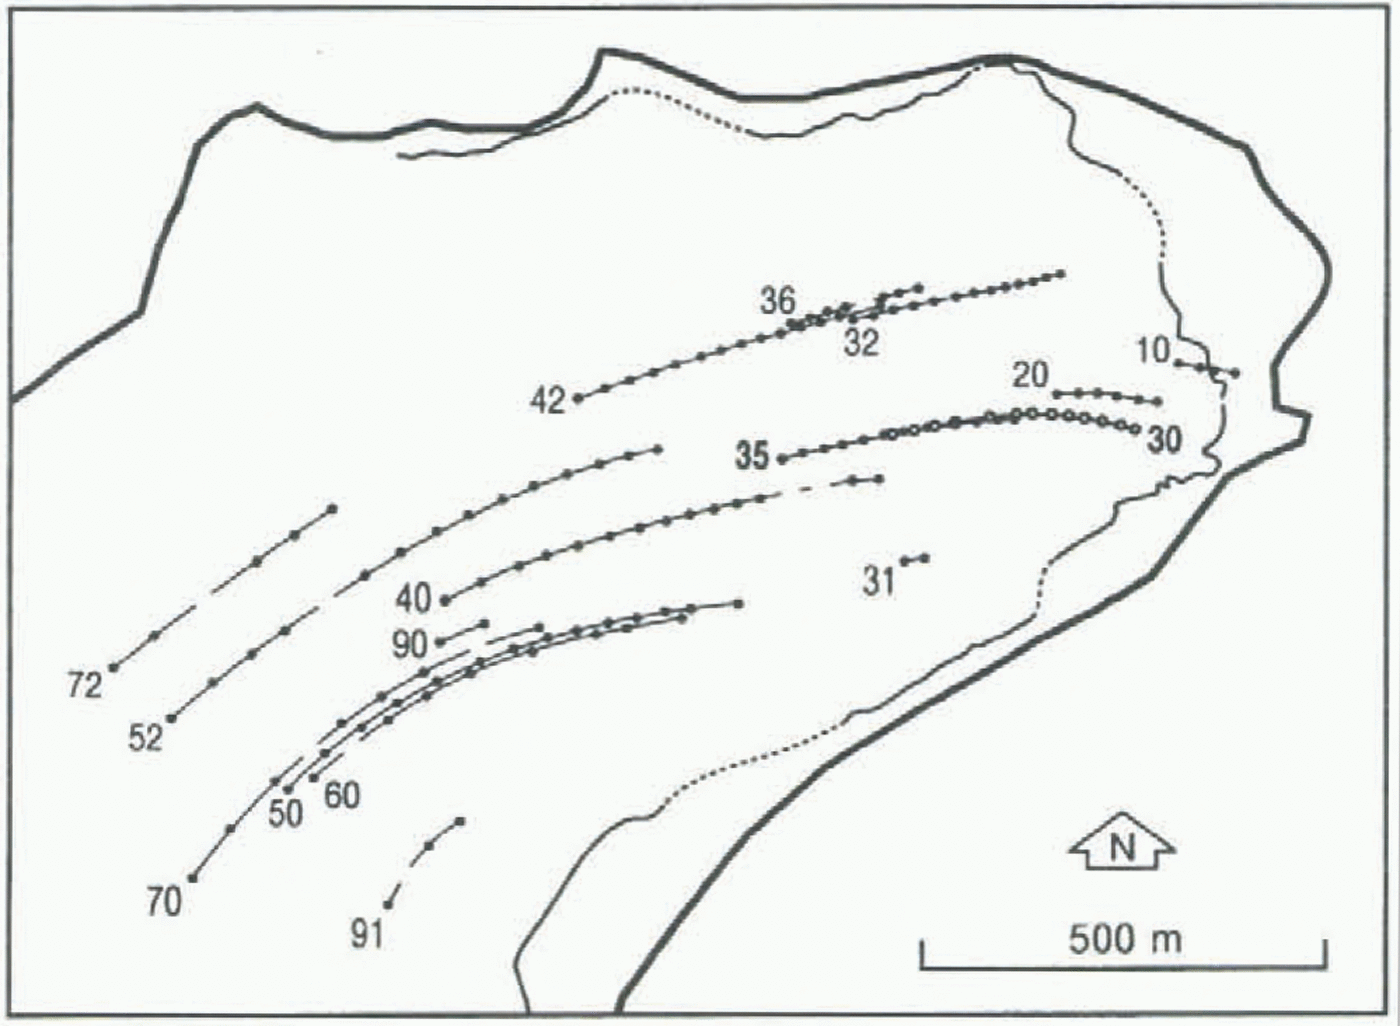
In 1979, five stakes (10–50) were placed along the centre of the glacier tongue between 789 and 970 m a.s.l., with two stakes (31, 51) to the right of the centre line and three (32, 42, 52) to its left (Fig. 4). Slake 10 melted out of the glacier 4 years later, when it was about 20 m above the level of the proglacial lake. As the glacier front retreated, it steepened and became more heavily crevassed, and stake 20 was lost in this zone of crevassing in 1985. In July 1995, stake 30 reached the end of the glacier which, at that point, had retreated about 200 m since 1979. As the original stakes moved down-glacier, the longitudinal line was extended by inserting new stakes at the highest accessible elevation (Fig. 4).
The positions of some of the stakes at the surface of the lower part of Austre Okstindbreen between 1979 arid 1995. Broken lines indicate that stakes were not visible when annual surveys were made, and their positions could not be determined. (Positions of stake 30 are shown as open circles.) The location of the glacier margin in 1979 (heavy line) and 1991 is indicated: sections of the margin which were not visible from terrestrial photogrammetric stations are shown as broken lines.
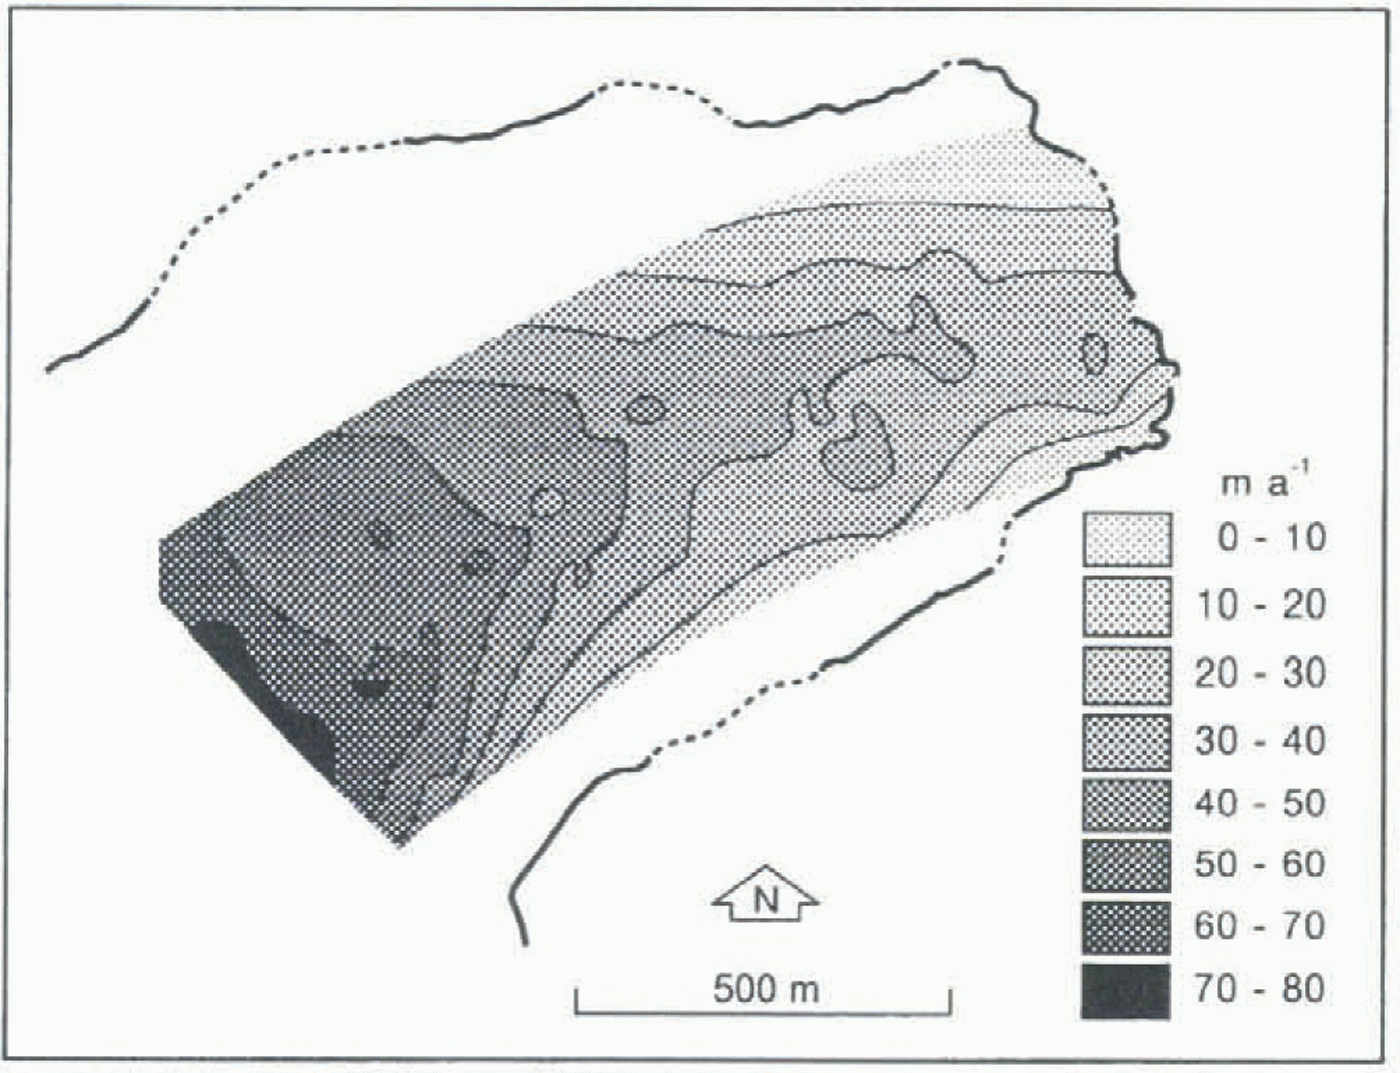
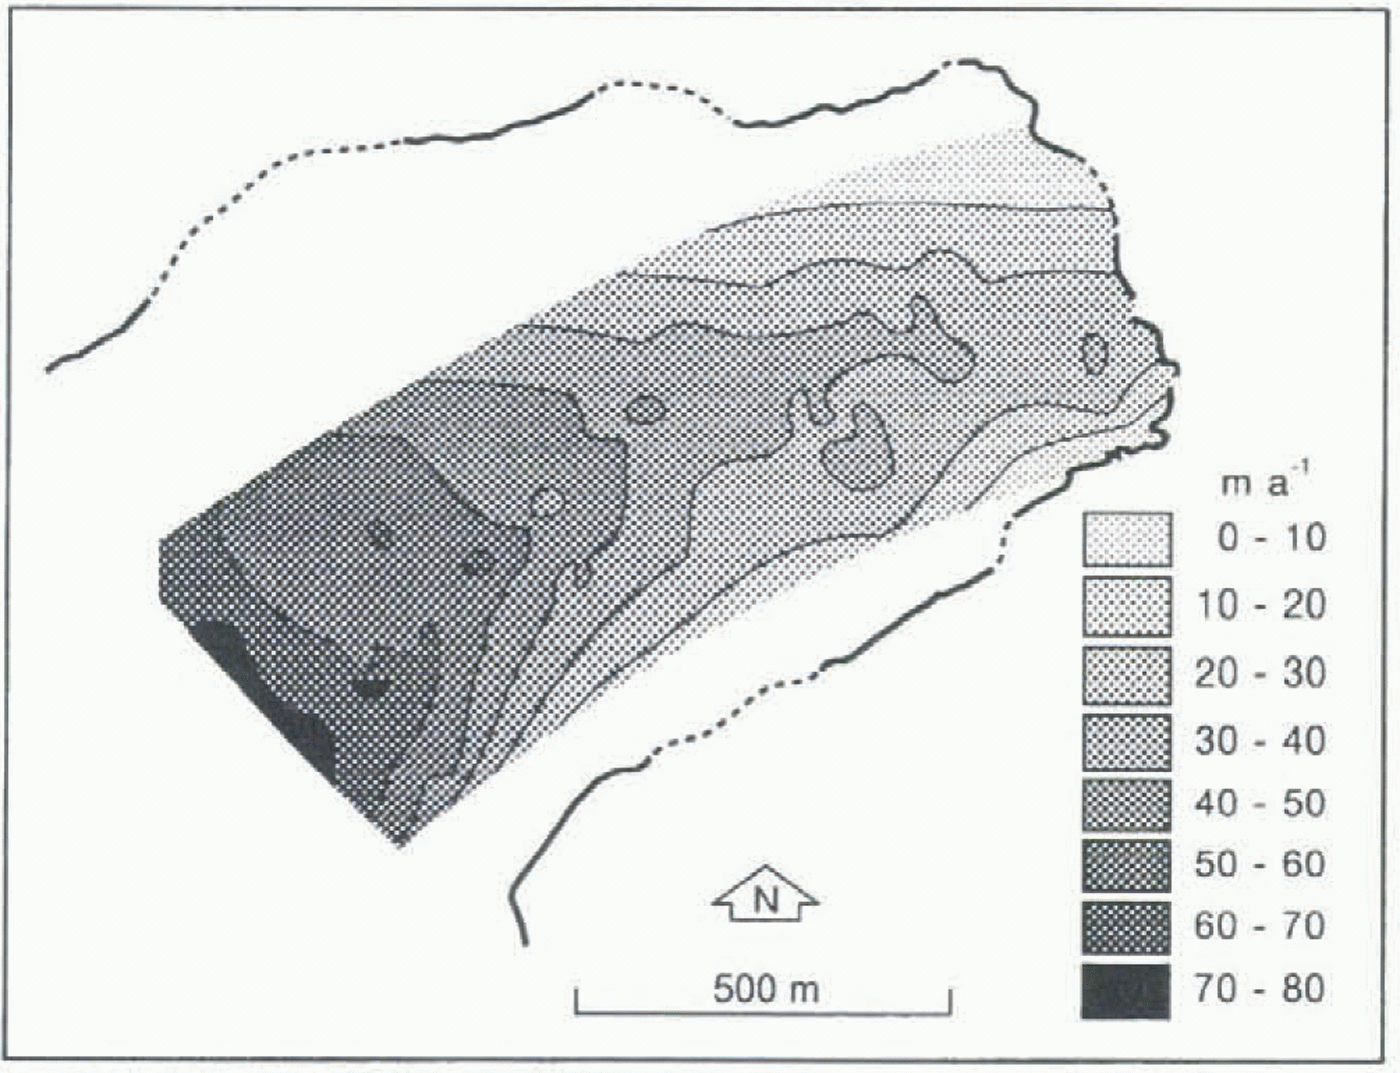
Other stakes offset from the centre line were used for periods of 1–7 years between 1981 and 1995. The positions of all slakes which were not covered by late-surviving snow were determined annually in mid-July, and their mean annual velocities were calculated. Time-averaged spatial values of surface velocity derived from 137 stake positions recorded between 1979 and 1995 indicated a rapid decrease of velocity with distance down-glacier from the lower part of the icefall (Fig. 5).
Temporal variations of flow
In general, the mean annual velocity of individual stakes decreased with time, reflecting a general trend of decreasing surface velocity down-glacier from the lower part of the icefall to the glacier terminus. However, most of the stakes moved more rapidly in 1982–83 than in the preceding year, and many moved even more rapidly in 1983–84 (Fig. 6). The 1987–88 mean annual velocities were higher than those of 1986–87.
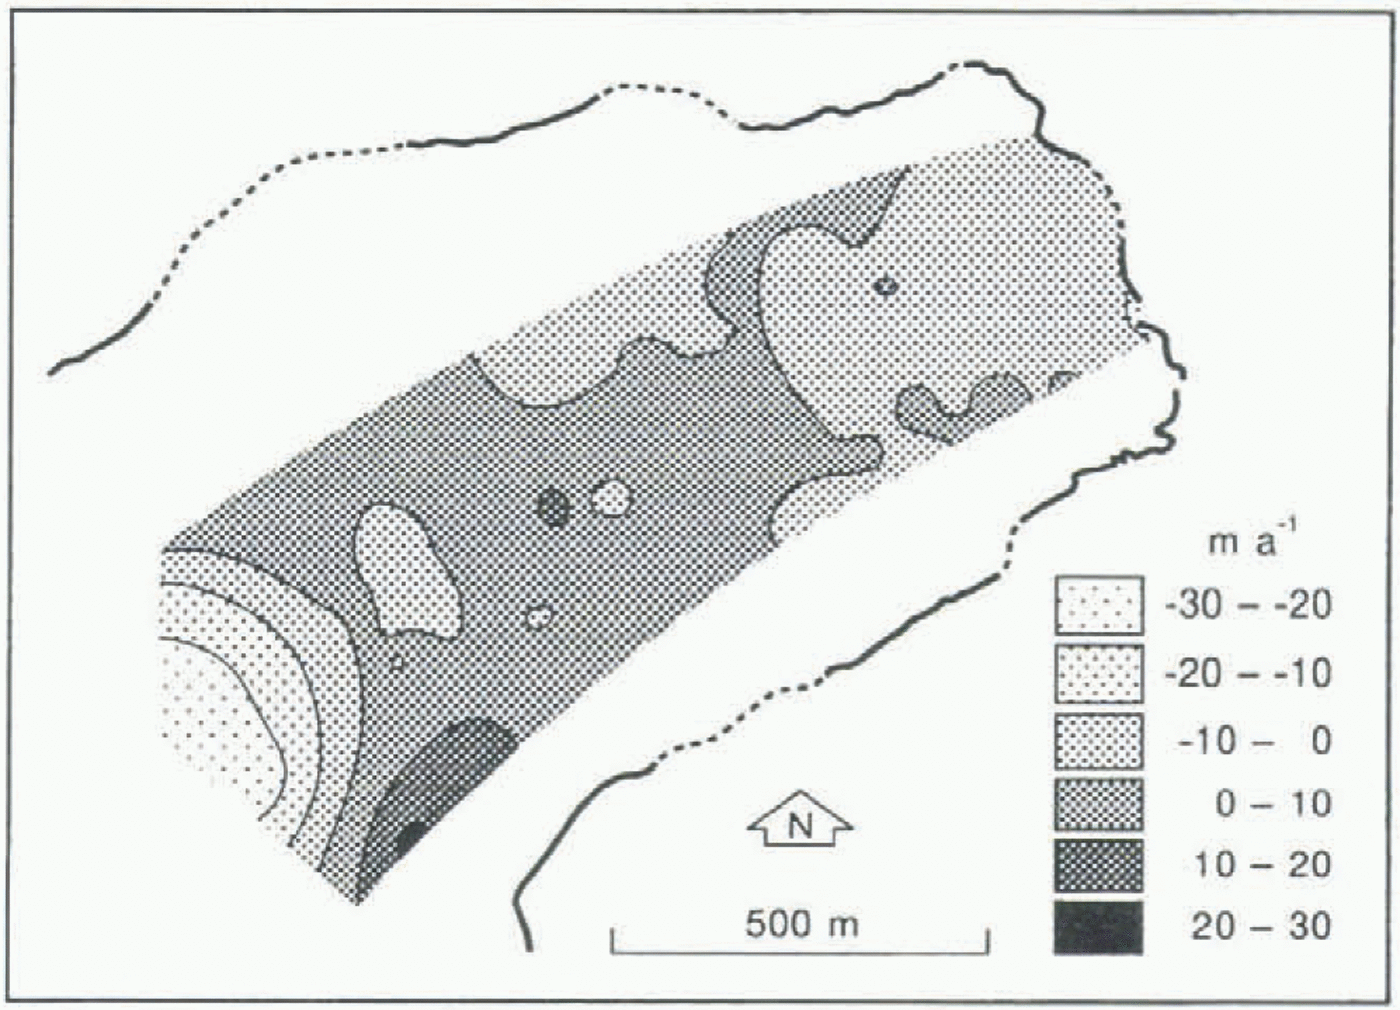
A comparison of the mean surface velocities near the glacier centre line during the 8 year period 1979–87 with those for the 8 year period 1987–95 indicates a marked decline (>10 m a−1) in the lower part of the icefall, despite rather small changes of ice thickness and surface gradient there (Fig. 7). Close to the end of the glacier, where the ice was relatively thin, the mean decrease from the first period
Time-averaged spatial distribution of the horizontal component of mean annual surface velocity along the centre of the lower part of Austre Okstindbreen, 1979–95. The map is based on 137 slake positions recorded during the 16 year period, and values were derived by minimum-curvature interpolation to a 10 m × 10 m grid.
The horizontal component of mean annual velocity of stakes at the surface of the lower part of Austre Okstindbreen, 1979–93. Distances are along the kinematic centre line, from an arbitrary origin.
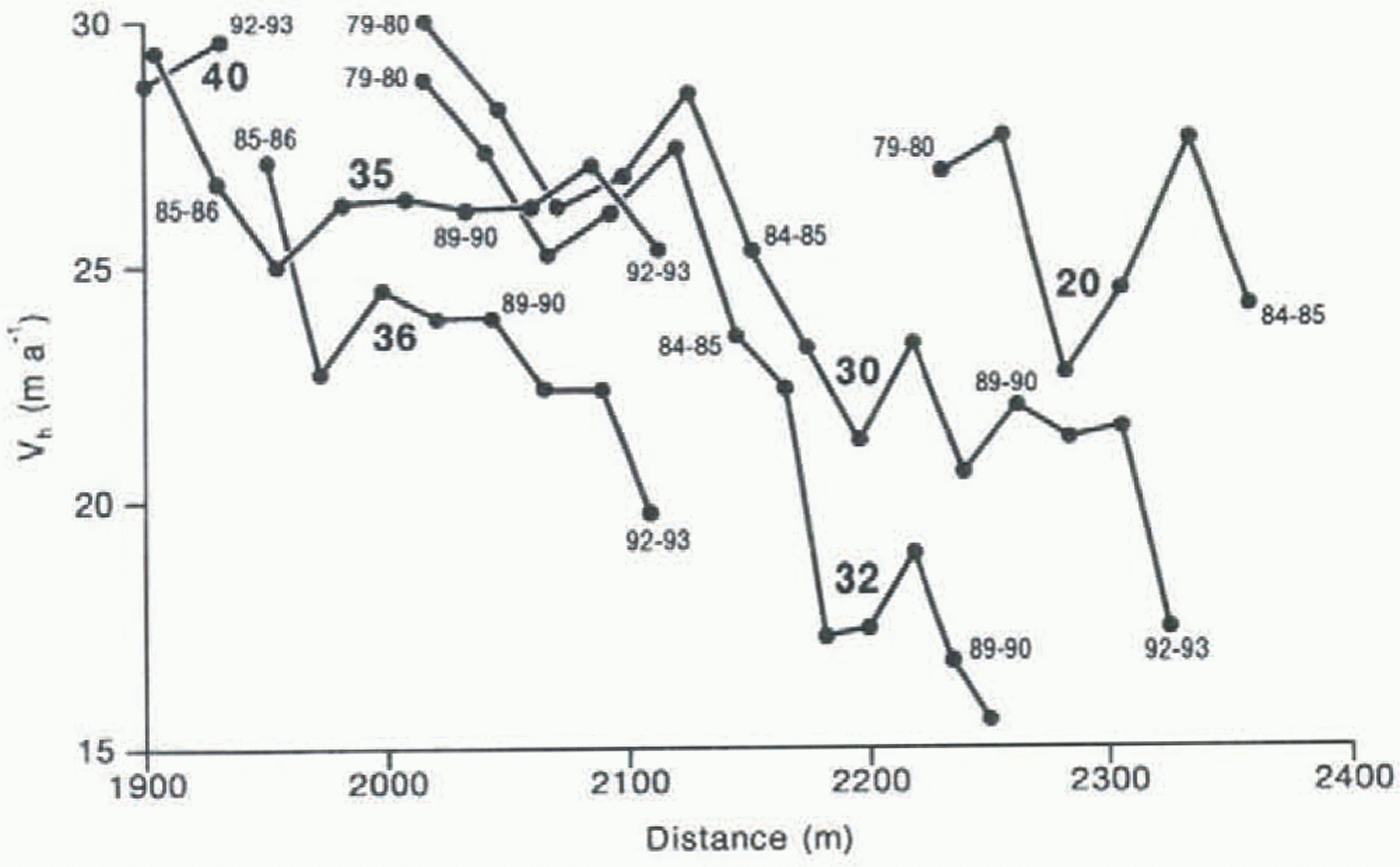
to the second generally was 0–10 m a−1. Further up-glacier, the mean annual surface velocities of 1987–95 were up to 10 m a−1 higher than those of 1979–87 (Fig. 7).
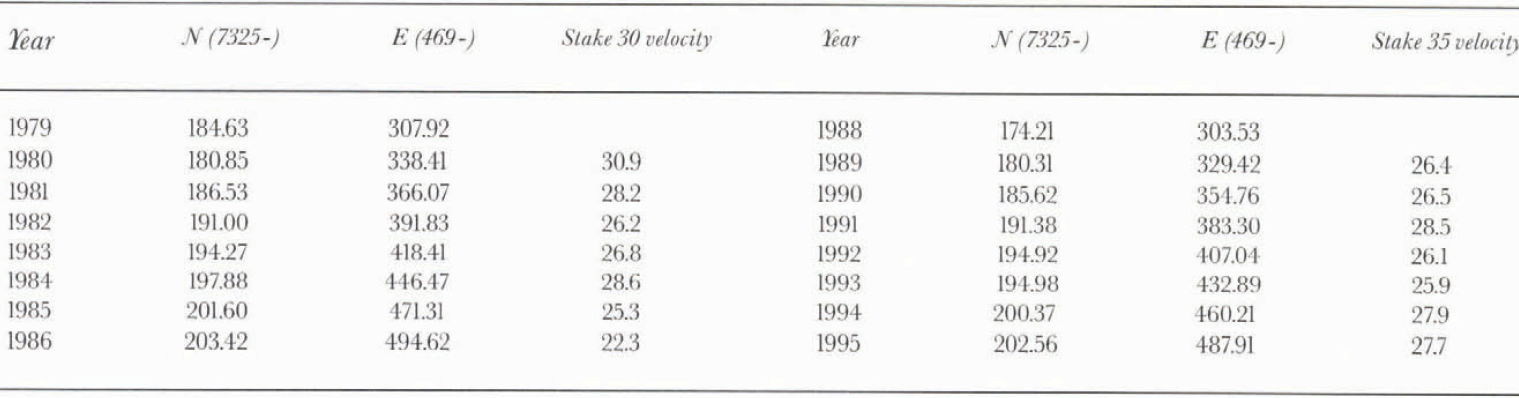
Temporal variations of velocity also were evident from the movement of stakes which followed flowlines previously taken by others. In 1988, the planimetric (x, y) position of stake 35 was within 7 m of the original (1979) position of stake 30, and the course which the stake took between 1988 and 1995 was very close to that taken by stake 30 from 1979 until 1986 (Table 3; Fig. 4). The mean annual velocity of stake 30 deceased from 30.9 m a−1 in 1979–80 to 22.3 m a−1 in 1985–86, although increases occurred in 1982–83 and 1983–84, as at most stakes. In contrast, the velocity of stake 35 showed no clear decrease during the 7 years (1988–89 to 1994–95) for which it moved along a similar course. Indeed, although stake 35 moved some 10% less rapidly than stake 30 during the first 2 years of the comparison, it moved 10% more rapidly during the last 2 years (table 3). This higher velocity of stake 35 occurred despite a 25% decrease of glacier thickness (about 15 m) in the area.
Differences of mean surface velocity along the centre of the lower part of Austre Okstindbreen between the periods 1979–87 and 1987–95. In the lower part of the icefall, the mean annual velocity decreased by more, than 20 m a-1. Over most of the tongue, however, velocities mere higher in the last 8 years than between 1979 and 1987.

Stake 30 reached the glacier margin in the proglacial lake in 1995. The size of the lake had increased throughout the 20 year period of observations, and the margin of the retreating glacier tongue had steepened. The steepening was most pronounced at the northern side of the terminus, where the lake extended furthest, and stake 30 passed through a zone of changing surface form (gradient and orientation); the changes were particularly pronounced
UTM (Universal Transverse Mercator) zone 33 coordinates of stakes 30 (left) and 35 (right), with mean annual velocities (m a-1)
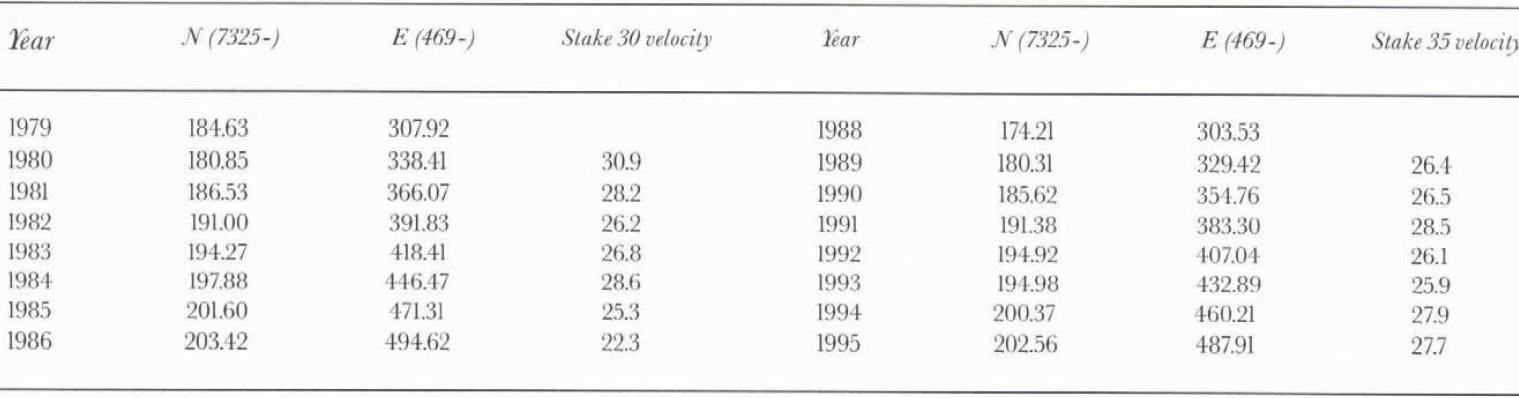
after 1982. The trajectory of the stake was influenced by the changes of glacier geometry (Fig. 4).
Surface Deformation
Glacier surface strain can be calculated from the deformation of triangles formed by arrays of stakes (Nye, 1959; Hambrey and Müller, 1978; Knight, 1992). The calculated strains
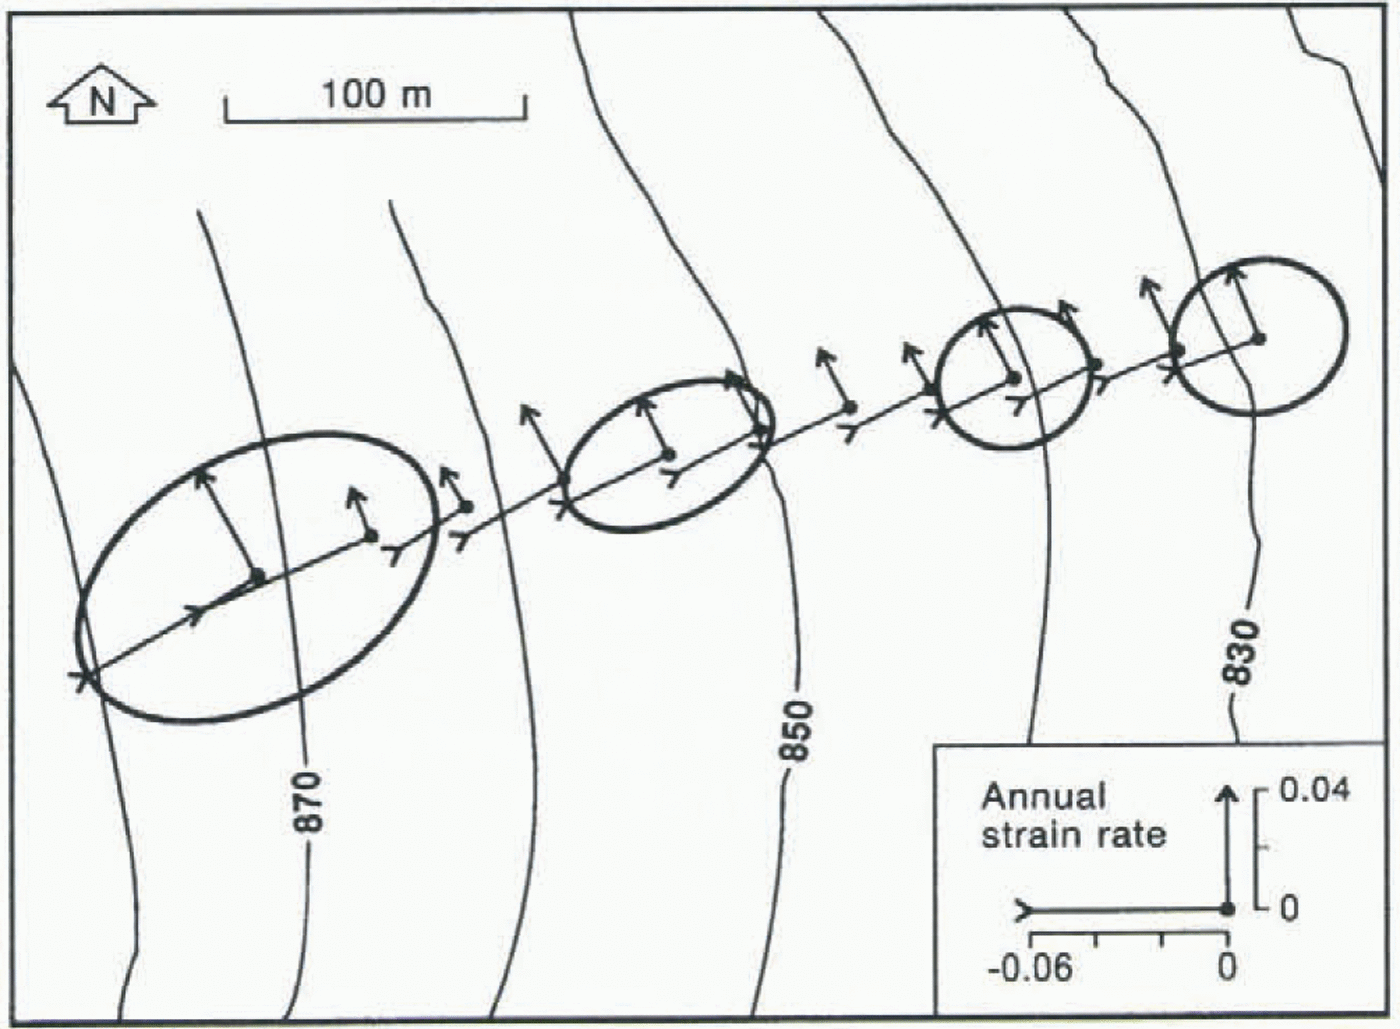
Principal strain rates determined from deformation of the triangle formed at the surface of Austre Okstindbreen by stakes 30, 40 and 42 between 1979 and 1991. The strain ellipses for the first, fifth, ninth and twelfth years are shown. The glacier surface contours are from 1985. The study area is shown in Figure 1.
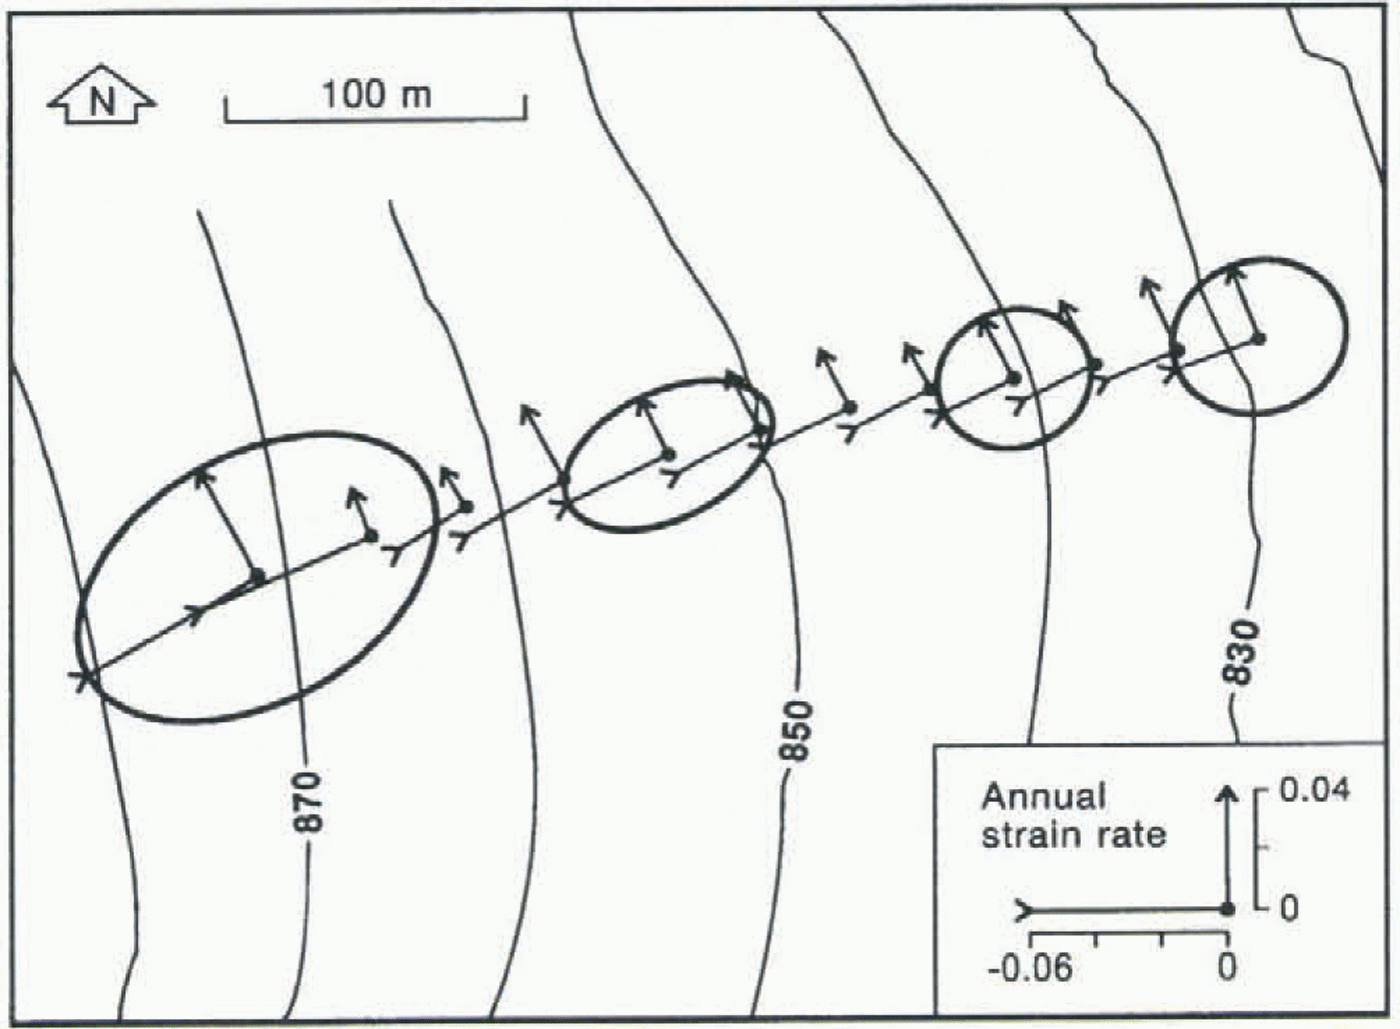
and strain rates are average values for the whole of the triangle. At Austre Okstindbreen, strain rates across the centre line of flow were determined for various triangles, using a Mohr-circle analysis (Williams and Knight, 1987). Results for the period 1979–91 for one triangle, formed by stakes 30, 40 and 42, with initial side lengths of 290–567 m, are illustrated in Figure 8. As the slakes moved down-glacier through the 12 year period, the position of the centre of the triangle changed by some 320 m, and its area decreased by 15%. Initially, the principal compressive strain was substantial (0.06 a−1 in the first 2 years), but it decreased (to 0.04 a−1) in 1982–83, as the difference of elevation of the stakes became smaller. During the last few years of observations, the compressive strain was around 0.02 a−1. The lateral extending strain during the first year was 0.04 a−1. It was 0.01 a−1 for the next 2 years, and 0.02 a−1 for the rest of the period. Although the longitudinal compressive strain rate was slightly larger than the other principal strain rate throughout the period, the difference of magnitude between the two from 1984 until 1991 was small, indicating low vertical strain. This is substantiated by the results of an analysis of changes of surface topography, based on annual terrestrial photogrammetric surveys, and of emergence velocities in relation to ablation at the stakes (paper in preparation).
Discussion
Winter, summer and net mass-balance values are determined annually for each 100 m altitudinal zone at Austre Okstindbreen (Haakensen, 1995). For the six mass-balance years 1988–89 to 1994–95, the mean net balance of that part of the glacier which was above 1300 m was 17.0 × 10⁶ m6 a−1 (range: 7.3–29.8 × 10⁶ m3 a−1). At around 1230–1250 m, a little below the mean ELA of recent years, the cross-sectional area of the glacier is of the order of 0.32 × 10⁶ m2 (Fig. 2), and the mean measured surface velocity between 1986 and 1994 was 39.0 m a−1 (table 1). As the depth-averaged velocity usually is 80–90% of the surface velocity (Paterson, 1994, p. 250), the mean annual discharge of ice there probably was about 11.2 × 10⁶ m3. This suggests that, during the study period, the glacier was not in a steady-state condition, and that its overall thickness above the mean ELA may have increased slightly. The results of recent surveys of the glacier’s accumulation area provide evidence of such a change (Jacobsen and Theakstone, 1997).
The crevassed nature of the glacier surface in the area immediately above the icefall provided abundant opportunities for melt water to enter the body of the glacier. The seasonal variations of surface velocity there (table 2) indicate that the basal sliding rate increased as meltwater reached the glacier bed early in the ablation season, and that the sliding rate decreased with the decline of ablation in late summer, as the amount of water reaching the bed declined and parts of the basal drainage system closed (Theakstone and Knudsen, 1996). Year-to-year differences of sliding rate immediately above the icefall are a likely response to variations in the amount of water gaining access to the glacier bed there. The stakes nearest the glacier margin above the icefall moved less rapidly in 1990–91 than in 1989–90, despite the general trend of down-glacier increase of surface velocity (table 1): in 1991, the start of the ablation season was delayed, the summer remained cool, and net ablation was much lower than in the previous year. A similar situation occurred in 1994, when net ablation again was small and rates of surface flow were lower than in the preceding year.
Year-to-year fluctuations of surface velocity may result from changes of ice thickness and surface slope, but most of the changes of mean annual surface velocity recorded clown-glacier of the icefall are likely to have been caused by-variations of basal sliding in response to differences in the availability of water entering the glacier. The 1988 summer balance (ablation) was the highest on record, with twice as much surface melting as in the previous year, and the increase of surface velocity noted in 1987–88 could have resulted from an increase of the rate of basal sliding.
The centre-line surface velocity resulting from internal deformation is proportional to sinn a and to h (n+1), where a is the surface slope averaged over 5–10 times the glacier thickness, h, and n is the flow-law exponent (Nye, 1965). Most of the lower part of Austre Okstindbreen is thinner than 150 m. Calculations using n. = 3 indicate that internal deformation of the glacier tongue throughout the 19 year period of observation was relatively small, and that much of the observed surface flow must have resulted from basal sliding. Some of the changes of mean annual surface flow rates from one year to another were similar over the whole of the lower part of the glacier; this suggests that changes of sliding velocity over a large area beneath the glacier tongue were of the same order.
Temporal changes of spatial patterns of surface velocity were noted during the 19 years of study. The velocity close to the glacier terminus was higher in 1993–95 than in the preceding period, despite a 25% decrease of glacier thickness (table 3). This increased rate of flow again is likely to have resulted from higher sliding velocities. The mean velocity in the lower part of the icefall decreased after 1987, but it increased further down-glacier (Fig. 7). However, the decrease of ice thickness was less in the lower part of the icefall than further down-glacier.
Longitudinal curvature in a glacier valley is expected to influence the distribution of stress and velocity (Echelmeyer and Kamb, 1987). The Austre Okstindbreen icefall and the section of the tongue immediately down-glacier of it are confined between steep valley walls which gradually change direction through almost 90°, and the curving form of the trajectories of stakes passing through this zone between 1978 and 1995 (Fig. 4) reflected the geometry of the valley sides. Both the 1976–78 observations (Fig. 3) and those of surface velocities averaged over the 16 year period 1979–95 (Fig. 5) indicated that the cross-glacier distribution of surface velocities was asymmetrical, with the point of maximum velocity on transverse sections between the geometric centre line and the inside of the bend.
The general down-glacier decrease of surface velocity over the lower part of tile tongue of Austre Okstindbreen resulted in longitudinal compression. The curving nature of the steep valley sides in the xy plane (plan view) influenced both the orientation of surface velocity vectors (Fig. 4) and the strain-rate pattern (Fig. 8). The lower part of the glacier was less confined, and lateral extension was characteristic of the tongue.
The size of the proglacial lake at Austre Okstindbreen increased throughout the 20 year period of observations, and the adjacent retreating glacier margin steepened. The steepening was most pronounced at the northern side of the terminus, where the lake extended furthest. The changing surface form of the glacier there influenced the trajectory of slake 30 (Fig. 4).
Conclusion
The horizontal component of surface velocity close to the equilibrium line at Austre Okstindbreen varied between and within years. The trend of increasing velocity as stakes moved down-glacier resulted from their entering a steeply sloping icefall. Other velocity differences could be accounted for by variations in the amount of water reaching the glacier bed, both seasonally and annually. The discharge of ice through a cross-section near the equilibrium line in the 8 years of study was less than the volume which accumulated above it, indicating that the glacier was not in a steady-state condition.
The changing orientation of the steep valley walls which bordered the icefall and the section of the tongue immediately down-glacier of it influenced the trajectories of stakes which passed through the zone between 1978 and 1995. Surface velocities were asymmetrically distributed across the glacier tongue, with the maximum located between the geometric centre line and the inside of the bend. The general trend of down-glacier decrease of mean annual surface velocities was interrupted in some years by a velocity increase at most of the stakes. The increased velocities noted in 1987–88 were associated with the highest ablation values recorded in any summer at Austre Okstindbreen, suggesting that sliding velocities were raised by the increased supply of water to the bed. In general, such increases of surface velocity differed rather little from place to place, indicating that, under much of the glacier tongue, the increased rate of basal sliding was of a similar order of magnitude. Internal deformation is unlikely to have contributed substantially to surface flow at the lowest part of the glacier, which was less than 150 m thick.
Acknowledgements
The studies reported here were supported by research grants from the U.K. Natural Environment Research Council (GR3/8373, GR3/7253), Statens Naturvidenskablige Forskningsråd, the Royal Society, the Norwegian Power Authority (Statkraft), the British Council and the University of Manchester. We are grateful to many members of the Okstindan Glacier Project for assistance in the field and we owe special thanks to J. T Møller, both for advice and for all the terrestrial photogrammetric mapping which he undertook at Austre Okstindbreen. The comments of P. Jansson and another referee resulted in substantial improvements to the paper.