Introduction
Bipolar disorder is a complex condition associated with dysregulation in multiple domains, including affective, cognitive, and social function. It has been proposed that the hippocampus, amygdala, and their interconnections with the frontal cortex play seminal roles in the pathogenesis of this disorder (Hajek et al., Reference Hajek, Carrey and Alda2005). Specifically, the amygdala has been associated with affective cognition, such as the encoding and retrieval of emotionally salient memories (Elliott et al., Reference Elliott, Zahn, Deakin and Anderson2011), whereas the hippocampus has been implicated in the regulation of mood and emotional behavior, and has a key role in cognitive function, especially declarative memory (Frey et al., Reference Frey2007).
Numerous previous studies of younger cohorts have demonstrated regional brain volume changes associated with bipolar disorder (Arnone et al., Reference Arnone2009). Factors such as sex (Murphy et al., Reference Murphy1996), age (Doty et al., Reference Doty, Payne, Steffans, Beyer, Krishnan and Labar2008), psychotic bipolar disorder (Strasser et al., Reference Strasser2005), and the use of psychotropic medication, in particular lithium (Hallahan et al., Reference Hallahan2011), have been associated with inconsistencies in the literature with regard to hippocampal and amygdala volume changes. Structural changes have been more consistently found in chronic and recurrent bipolar disorder, rather than at illness onset, suggestive of a neuroprogressive course (Berk et al., Reference Berk2010).
In contrast, there have been few studies of older bipolar disorder samples which have reported neuroanatomical data. Two structural magnetic resonance imaging (MRI) studies have examined hippocampal, and one amygdala, volumes in older adults with bipolar disorder with conflicting results. The first study unexpectedly reported an increase in left hippocampal volume, although lithium use was correlated with individual and total hippocampal volumes (Beyer et al., Reference Beyer2004). The second MRI study found no difference in either hippocampal or amygdala volumes (Delaloye et al., Reference Delaloye2009).
The examination of an older cohort provides an opportunity to clarify the descriptive neurobiology of bipolar disorder in later life. The primary aim of this study was to compare hippocampal and amygdala volumes between older bipolar disorder patients and healthy controls. In addition, gray matter (GM), white matter (WM), and cerebrospinal fluid (CSF) volumes were compared.
Given that there have been so few previous neuroimaging studies of bipolar disorder in this age group, no clear trend in the association between age and brain volumes has been established. We hypothesized, however, that hippocampal and amygdala volumes would be smaller and negatively associated with duration of mood episodes in the bipolar disorder patients because of the likelihood of a more chronic course with age (Hallahan et al., Reference Hallahan2011).
Methods
Participants
Patients aged 45 years and over with bipolar I disorder were recruited via local psychiatry networks and advertisements in the general and health media.
A DSM-IV diagnosis of bipolar I disorder was confirmed by a psychiatrist (CW), using the Structured Clinical Interview for DSM-IV (SCID) (First et al., Reference First, Spitzer, Gibbon and Williams1997), to ensure diagnostic consistency. Each patient reported retrospectively the history of the onset, duration, and number of mood episodes. Sociodemographic and other clinical data were obtained from a standard clinical interview. Current mood state was assessed using the Young Mania Rating scale (YMRS) (Young et al., Reference Young, Biggs, Ziegler and Meyer1978) and the 17-item Hamilton Depression Rating scale (HAM-D) (Hamilton, Reference Hamilton1960).
The following exclusion criteria were applied to ensure consistency of clinical phenotype and mood state: a history of schizophrenia; current substance abuse; acute physical illness; dementia, developmental delay; or Mini Mental State Examination (MMSE) score <24 (Folstein et al., Reference Folstein, Folstein and McHugh1975). Patients with a current depressive, manic, or hypomanic episode were excluded to ensure that hippocampal and amygdala volumes were not confounded by current mood state (Sweeney et al., Reference Sweeney, Kmiec and Kupfer2000).
Healthy controls were recruited from the community by advertisement, or from control participants in other contemporaneous studies of brain imaging carried out by our group. The control group was matched for sex and age to within five years of the bipolar disorder group, had no history of mood disorder, and met the same exclusion criteria.
The study was approved by the Human Research Ethics Committee of the South Eastern Sydney Area Health Service, Eastern Section. All participants provided written informed consent.
MRI procedures
All participants were scanned using a Philips 3T Achieva Quasar scanner (Philips Medical Systems, Best, The Netherlands) located at Neuroscience Research (NeuRa) Australia in Sydney. Acquisition parameters for all T1-weighted structural MRI scans were as follows: TR = 6.39 ms, TE = 2.9 ms, flip angle = 8°, matrix size = 256 × 256, FOV = 256 × 256 × 190, and slice thickness = 1 mm with no gap in-between, thereby yielding 1 × 1 × 1 mm3 isotropic voxels. T1-weighted structural MRI scans were segmented into GM, WM, and CSF using SPM8 (Ashburner and Friston, Reference Ashburner and Friston2005). The segmentation results were inspected visually. Intracranial volume (ICV) was calculated by adding GM, WM, and CSF volumes.
Analyze software 10.0 (BIR, Mayo Clinic, Rochester, MN) was used to manually delineate the left and right hippocampi on T1-weighted scans by a trained rater (SS) blind to all clinical information. The tracing of the hippocampus was based on the previously published criteria (Watson et al., Reference Watson, Jack and Cendes1997). Briefly, the hippocampal tracing began on the coronal slice where the hippocampal head ventral to the amygdala first appeared, and continued on the contiguous coronal slices until the crus of the fornix was visible in its total length. The lateral border of the hippocampus was formed by the medial wall of the temporal horn. The medial border was defined by the ambient cistern in the anterior slices, and by the transverse fissure in the more posterior slices. The ventral boundary was formed by the parahippocampal gyrus, while the dorsal boundary was formed by the amygdala anteriorly and by the choroid plexus and CSF more posteriorly. Hippocampal volume was calculated separately for both sides by summing the number of voxels in the traced regions on each slice. As the voxel size is 1 mm3, hippocampal volume is equal to the total number of voxels. Intra-rater reliability was measured using a random sample of five scans (r = 0.913, p = 0.031). The inter-rater reliability with another trained rater was also examined (r = 0.885, p = 0.046).
Amygdala boundaries were based on the previously published work (Watson et al., Reference Watson, Jack and Cendes1997) with a modification as suggested by other authors (Brierly et al., Reference Brierly, Shaw and David2002; Maller et al., Reference Maller, Anstey, Reglade-Meslin, Christensen, Wen and Sachdev2007), that is, we checked for the most anterior margin (nucleus) of the amygdala by continuing to move anteriorly and verifying that this ovoid structure disappeared from view.
We examined the left and right hippocampi, and the left and right amygdalae separately, given the extensive literature suggesting the laterality of emotional regulation, and as previous studies of bipolar disorder have reported lateralization of brain volume changes (Strakowski et al., Reference Strakowski, DelBello and Adler2005).
Statistical analyses
The age, years of education, and sex ratio of bipolar disorder patients were compared with those of controls using t- or χ2 tests. One healthy control with missing data for years of education was assigned the mean value of other controls. The neuroimaging characteristics of patients and controls were compared using analysis of covariance (ANCOVA), controlling for ICV, sex, age, and years of education. Within patients, associations between each of hippocampal and amygdala volumes and (a) time elapsed since first episodes of mania and depression (in years), and (b) total duration of depressive, manic, and all mood episodes (in weeks) were investigated using partial correlations that controlled for ICV, sex, age, and years of education. The hippocampal and amygdala volumes of patients on lithium were compared with those of patients not on lithium using ANCOVA, controlling for ICV, sex, age, and years of education. All statistical analyses were performed using PASW Statistics 18 (SPSS).
Results
Demographic and clinical characteristics
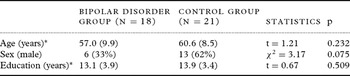
Three of the bipolar disorder patients were recruited from local psychiatry networks, while other patients and all healthy controls were recruited by advertising. There were no significant differences between the bipolar subjects and controls on age, sex, or years of education (Table 1). The age range for the bipolar group was 46–77 years, and for the control group 45–76 years. All the study participants were Caucasian.
Demographic and clinical characteristics of bipolar disorder and healthy control groups

For age and education, means are reported with SD in brackets.
As noted in the study's exclusion criteria, each of the bipolar disorder patients was euthymic at the time of study assessments. Their mean HAM-D score was 4.8 (SD 5.6), and their mean YMRS score was 2.4 (SD 3.5).
For the bipolar disorder patients, the mean age at onset of depression was 29.8 years (SD 15.1), and the mean age at onset of mania was 41.0 years (SD 14.6). The mean time elapsed since the first manic episode was 15.9 years (SD 12.9), and the mean duration of illness from any mood episode (mania or depression) was 27.8 years (SD 12.5).
Current lithium use was reported by 9/18 bipolar subjects, with mean daily lithium dose being 450 mg (SD 147.9). The current use of another mood stabilizer, such as sodium valproate and carbamazepine, was reported by 9/18, with 3/18 being treated with lithium plus another mood stabilizer.
The mean MMSE score was 28.6 (SD 1.7) in the bipolar disorder patients.
Neuroimaging characteristics
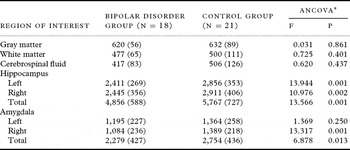
Intracranial volume was smaller in the bipolar disorder group compared with the controls (1515 mL (SD 121) versus 1637 mL (SD 171), t = 2.54, p = 0.015). Comparison of hippocampal and amygdala volumes was therefore adjusted for ICV, sex, age, and years of education (Table 2).
Hippocampal and amygdala volumes of bipolar disorder and healthy control groups

Gray matter, white matter, and cerebrospinal fluid volumes are measured in mL; hippocampal and amygdala volumes are measured in mm3. Values are means (SD).
*Controlling for ICV, age, sex, and years of education.
As detailed in Table 2, both left and right hippocampal volumes and right amygdala volume were smaller in the bipolar disorder group. There was no difference between the groups on WM, GM, and CSF.
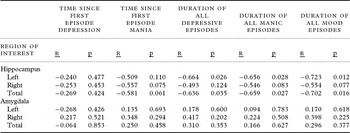
Partial correlations between hippocampal and amygdala volumes, and variables of interest were calculated after controlling for ICV, sex, age, and years of education (Table 3). Time since the first episodes of depression and mania were analyzed separately because of the difference in mean age of onset of each episode type noted earlier. There was no association between hippocampal volume and time since the first episode of depression or mania. There was no association between amygdala volume and time since the first episode of either depression or mania.
Hippocampal and amygdala volumes of bipolar disorder and healthy control groups, according to time since onset and duration of mood episodes

Hippocampal and amygdala volumes are measured in mm3; values are mean (SD).
The estimated approximate total duration of respective mood episodes was calculated by multiplying the number of episodes of each type by their average duration in weeks. As detailed in Table 3, left and total hippocampal volumes were associated negatively with the total duration of depressive, manic, and all mood episodes. There was no association between amygdala volume and the duration of any mood episodes.
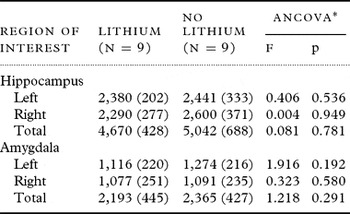
There was no significant association between lithium use and either hippocampal or amygdala volume, adjusted for ICV, sex, age, and years of education (Table 4).
Hippocampal and amygdala volumes in bipolar disorder group according to lithium use

Hippocampal and amygdala volumes are measured in mm3; values are mean (SD).
*Controlling for ICV, age, sex, and years of education.
Discussion
We found that older bipolar disorder patients had significantly smaller left, right, and total hippocampal and right amygdala volumes compared with healthy controls similar in age, sex, and education. While previous studies of bipolar patients have found differing neuroimaging changes according to variables such as the phase of bipolar disorder (Sweeney et al., Reference Sweeney, Kmiec and Kupfer2000) and the presence of psychosis (Strasser et al., Reference Strasser2005), the strength of our sample is that it exclusively consisted of patients with bipolar I disorder who were euthymic at the time of the study.
Previous volumetric studies of the hippocampus in bipolar disorder have reported variable results, such that there are as many studies showing increased hippocampal volume (Beyer et al., Reference Beyer2004; Javadapour et al., Reference Javadapour, Malhi, Ivanovski, Chen, Wen and Sachdev2010) as those reporting no differences (Altshuler et al., Reference Altshuler2000; Hauser et al., Reference Hauser2000;). Similar inconsistencies have been reported for amygdala volume in bipolar patients (Hajek et al., Reference Hajek, Kopecek, Kozeny, Gunde, Alda and Hoschl2009). This variation in findings may be best explained by small study samples leading to inadequate statistical power, differences in methodology, and the clinical heterogeneity of bipolar samples (Strasser et al., Reference Strasser2005).
Sample heterogeneity seems pertinent to the varying results of two previous studies of hippocampal volume in older bipolar patients. The first included patients, mean age 58 years, in manic and depressed phases (Beyer et al., Reference Beyer2004). The second included patients, mean age 69 years, with bipolar II disorder (Delaloye et al., Reference Delaloye2009). The mean age of our sample is similar to that of the first study but is 10 years younger than that of the second sample, which had similar age at onset but longer duration of illness. While these two studies used different MRI field strengths (1.5-Tesla and 3-Tesla respectively), this is unlikely to have been a significant source of variation (Hallahan et al., Reference Hallahan2011).
A recent multicenter mega-analysis of MRI in bipolar disorder identified lithium use and duration of illness as significant sources of volumetric heterogeneity (Hallahan et al., Reference Hallahan2011). In particular, significantly larger hippocampal and amygdala volumes were seen in bipolar patients who were administered lithium, compared with lithium-naive patients and controls. Lithium has been thought to work at the molecular level to boost neurotrophins such as brain-derived neurotrophic factor (BDNF) that help protect against stress-related neuronal changes (Foland et al., Reference Foland2008). We did not, however, find any association between hippocampal volume and lithium use, which may have been due to having a small number of patients, limiting our ability to detect any statistically significant differences. Another source of variation has been sex, with other authors reporting smaller hippocampal volume in females (Murphy et al., Reference Murphy1996). While two-thirds in our bipolar group were females, the differences remained after adjustment for sex, age, and education.
Further, our study showed an association between smaller hippocampal volume and the total duration of manic, depressive, and all mood episodes. This suggests that it may be the severity of bipolar disorder which determines smaller hippocampal volume. This is consistent with previous research in which structural abnormalities were more consistently found in recurrent unipolar depression (Sheline et al., Reference Sheline, Sanghavi, Mintun and Gado1999), and in chronic and recurrent bipolar disorder than in early bipolar disorder, suggesting a neuroprogressive clinical process (Berk et al., Reference Berk2010). It has been hypothesized that biochemical processes such as inflammatory cytokines, neurotrophins, and oxidative stress are associated with neuroprogression. Further, bipolar disorder may be associated with impaired glucocorticoid receptor function (Watson et al., Reference Watson, Thompson, Ritchie, Ferrier and Young2006), thereby leading to neuronal loss or atrophy in areas such as the hippocampus, which are saturated with glucocorticoid receptors. While the effects of stress hormones should occur, theoretically, on the whole brain, the hippocampus and amygdala appear to be particularly vulnerable (van Stegeren, Reference van Stegeren2009). The prefrontal cortex appears to have a modulating effect in this process but the overall effect on gray matter volumes may not be statistically significant.
There were a number of limitations in our study that need to be acknowledged. These include the small size of our sample, which is likely to have limited our ability to detect statistically significant differences between patients and controls. That almost all the patients were recruited by advertising introduces various biases such as the self-selection of participants and the production of an unrepresentative sample. Data such as time of onset and duration, and mood episodes, may have been confounded by the method of retrospective recall used. While there were no significant demographic differences between the patients and the healthy controls, there were more females in the control group. There was no information available on the physical health or neurocognition of the study participants. While it is acknowledged that automated methods may improve the consistency of volumetric analyses, manual tracing was appropriate to this study because of the small number of scans involved, the use of established protocols, and a single rater for hippocampal and amygdala volumes, respectively.
Conclusion
We found that hippocampal and amygdala volumes were smaller in an older bipolar disorder sample. There was a negative association between hippocampal volume and the total duration of depressive and manic episodes, which may suggest neuroprogression in this particular cohort. The role of neurodevelopmental factors is unclear; other researchers have suggested that the presence of neurocognitive deficits early in the course of bipolar disorder is suggestive of underlying neurodevelopment dysfunction of the hippocampus (Frey et al., Reference Frey2007). Longitudinal studies from the onset of bipolar disorder are required to determine the interplay of neurodevelopmental and neuroprogressive factors, in particular with regard to specific anatomical regions (Monkul et al., Reference Monkul, Malhi and Soares2005).
Conflict of interest
None.
Description of authors’ roles
C. Wijeratne helped to design the study, supervised data collection, conducted clinical interviews, and wrote the first draft. S. Sachdev collated and rated MRI scans. W. Wen was responsible for methodology of MRI ratings. O. Piguet assisted with data collection and commented on the first draft. D. Lipnicki conducted all statistical analyses. G. Malhi and P. Mitchell helped to design the study, obtain funding, and supervise data collection. P. Sachdev was involved in study design, obtaining funding, data analysis, interpretation of data, and finalizing the drafts of the paper.
Acknowledgments
The study was conducted with the support of research grants awarded by the Australian Rotary Health and the National Health and Medical Research Council (program grant no. 510135). We gratefully acknowledge the assistance of Ilana Hepner, Kristan Kang, Im Quah-Smith, Andrea Lammel, and Amanda Sharpley in data collection. Chao Suo and Andrew Turner assisted with volumetric measurement. O. Piguet is supported by a National Health and Medical Research Council of Australia Clinical Career Development Fellowship (APP1022684).