




No CrossRef data available.
Article contents
Refractoriness of host haemocytes to parasite immunosuppressive factors as a putative resistance mechanism in the Biomphalaria glabrata–Echinostoma caproni system
Published online by Cambridge University Press: 12 July 2001
Abstract
In contrast to the growing knowledge accumulated on plant resistance to pathogens, mechanisms of parasite resistance largely remain to be elucidated in animal species. In the present study we investigated mechanisms underlying resistance/susceptibility in the snail–trematode system Biomphalaria glabrata–Echinostoma caproni. In particular, we compared the effect of the parasite excretory–secretory (E–S) products on the defence functions of haemocytes from 2 susceptible and 2 resistant snail strains. In vitro experiments showed that E. caproni E–S products inhibit adhesion and phagocytosis of haemocytes from susceptible snails. A partial biochemical characterization also suggested that the interfering factor(s) is (are) heat-labile glycosylated polypeptides of molecular mass between 10 and 30 kDa. Interestingly, haemocytes from resistant snails remained unaffected by the parasite E–S products, suggesting that a constitutive difference results in their refractoriness to the parasite's immunosuppressive factor(s).
Information
- Type
- Research Article
- Information
- Copyright
- © 2001 Cambridge University Press
INTRODUCTION
Understanding the mechanisms underlying host susceptibility or resistance to given parasite species would have important consequences for various aspects of host–parasite relationships such as immunobiology (Cooper et al. 1992), population genetics, epidemiology (Antonovics & Thrall, 1994; Frank, 1996; Sorci, Moller & Boulinier, 1997), or coevolutionary processes (Kraaijeveld, Van Alphen & Godfray, 1998; Simms & Fritz, 1990). However, in contrast to the growing knowledge accumulated on plant resistance to pathogens (Halterman & Martin, 1997; Dempsey, Sylva & Klessig, 1998), mechanisms of parasite resistance largely remain to be elucidated in animal species (Stear & Wakelin, 1998; Coustau, Chevillon & ffrench-Constant, 2000).
As a vector of the human blood fluke Schistosoma mansoni, the fresh-water gastropod Biomphalaria glabrata has been particularly used to investigate snail susceptibility/resistance to trematode infections. A number of strains selected for resistance or susceptibility to S. mansoni have been extensively studied for better characterizing both the genetical basis of resistance (Richards, Knight & Lewis, 1992), and the effector mechanisms of the snail immune system. A growing number of genes or proteins involved in the cellular or humoral defence responses are being identified (Granath, Connors & Tarleton, 1994, Owe-Missi-Oukem-Boyer et al. 1994; Adema et al. 1997; Davids & Yoshino, 1998; Davids, Wu & Yoshino, 1999), but the precise biochemical mech-anisms underlying resistance to S. mansoni remain to be clarified.
In a recent study on the genetics of B. glabrata susceptibility/resistance to another trematode, Echinostoma caproni, Langand et al. (1998) were successful in selecting 2 highly susceptible and 2 highly resistant snail strains. A first study compared E. caproni development and host haemocytic response in 1 susceptible (HAC) and 1 resistant (CB) snail strain (Ataev & Coustau, 1999). Results showed that E. caproni larvae were capable, not only of penetrating resistant snails, but of migrating and reaching the final site of infection (heart area). However, once settled in the final site of infection, the parasite larvae did not develop, and were rapidly encapsulated and destroyed by the host haemocytes (Ataev & Coustau, 1999).
One particularity of larval echinostomes is that they seem to interfere with their snail host internal defence system. This notion of interference or ‘immunomodulation' is supported by numerous experimental studies carried out on several echinostome species (Lie, 1982), as well as by in vitro observations on E. paraensei (Adema et al. 1994; Adema & Loker, 1997; DeGaffé & Loker, 1998). Note that although these experiments clearly revealed an immunosuppressive effect, the lack of a real immune system in snails (comprising lymphocytes and immunoglobulins), lead many authors to use the term interference rather than immuno-suppression or -modulation.
A straightforward hypothesis regarding resistance mechanisms towards a parasite producing immuno-modulating factors is the hypothesis that resistant hosts present modified E–S targets or receptors (Coustau et al. 2000). As a first approach in investigating this possibility, we compared the effect of the parasite E–S products on the defence functions of haemocytes from susceptible and resistant snails. In vitro experiments carried out on 2 susceptible (HAC and EAF) and 2 resistant (CB and KB) strains confirmed this interference hypothesis. Furthermore, results revealed that haemocytes from the resistant snails were not affected by the parasite E–S products.
MATERIALS AND METHODS
Animals
The isolate of Echinostoma caproni (previously referred to as E. liei) originated from Egypt (Jeyarasingam et al. 1972), and was maintained in mice (SWISS OF1 stock) and Brazilian albino strain of B. glabrata as described previously (Trouvé et al. 1996). The 4 strains of B. glabrata were previously selected for their susceptibility or resistance to the Egyptian strain of E. caproni: 2 susceptible strains HAC and EAF and 2 resistant strains KB and CB have been obtained (Langand et al. 1998). Snails were maintained under controlled temperature (26 °C), light cycles (12L/12D), and food supply. In order to avoid stimulation of the internal defence system of the snails by micro-organisms or protozoa introduced with fresh lettuce, snails were fed artificial food (Moore et al. 1953).
Collection of excretory–secretory (E–S) products
The procedure for obtaining eggs of E. caproni in vitro was adapted from that described by Reddy & Fried (1996) as described previously (Ataev & Coustau, 1999). Similarly, collection of eggs and hatching of miracidia have been performed according to previously described protocols (Ataev & Coustau, 1999). Miracidia were transferred into 24-well sterile tissue culture plates containing CBSS plus 1% of an antibiotic/antimycotic (AB/AM) mixture (penicillin 100 units/ml, streptomycin 0.1 mg/ml and ampho-tericin 0.025 μg/ml; Sigma). After 24 h and 48 h, the CBSS (Chernin, 1963) containing sporocyst E–S products was collected. E–S products were filter-sterilized with a 0.22 μm filter. Sterile E–S were placed at −80 °C, lyophilized and stored until use. Protein content of E–S fraction was determined using the BCA-protein kit assay (Pierce, Rockford, IL) using bovine serum albumin as a standard. Prior to being used in the bio-assays, E–S were solubilized in CBSS at the concentration of 90 μg of protein/ml previously used with E–S products from S. mansoni (Lodes & Yoshino, 1989). For experiments, E–S were also solubilized at concentrations of 22.5, 45, 225 and 450 μg of protein/ml.
Haemolymph collection
Because susceptibility and resistance have been selected at the adult stage of the snails, we used for our experiments B. glabrata measuring a minimum of 9 mm in shell diameter. Haemolymph from susceptible or resistant snails was extracted from the headfoot (Sminia & Barendsen, 1980) and placed on a plastic Petri dish for 2 min to allow shell debris or mucus to sediment. Generally, 50–100 μl of haemolymph were extracted from each snail. Because of possible inter-individual variations (Coustau & Yoshino, 1994a), haemolymph from at least 4 individuals was pooled for each sample.
Haemocyte monolayers
For each replicate, a 100 μl pool of haemolymph was laid onto a 96-well sterile tissue culture plate. Haemocytes were allowed to settle and adhere for 30 min at 26 °C. The monolayers were then rinsed 3 times with CBSS and the AB/AM mixture.
Haemocyte spreading assay
The monolayers were treated with either 100 μl of CBSS, whole E–S, or treated E–S. After 3 h of incubation, a minimum of 100 haemocytes from each replicate were scored as ‘spread' (with conspicuous lamellipodia) or ‘round' (round and refractile under phase optics) (Coustau & Yoshino, 1994b); the percentage of spread cells was calculated.
Haemocyte viability
In order to test whether E–S had a significant effect on haemocyte viability during the course of the bioassays, we used a fluorescent test (Davids & Yoshino, 1998). Briefly, pools of haemolymph were placed in wells of separate Teflon-coat printed glass slides and haemocytes were allowed to settle and adhere for 20 min in a humidity chamber at 26 °C. After several washes with CBSS, haemocytes were incubated either with CBSS or with E–S products. After 3 h, 1 μl of propidium iodide (Sigma; 200 μg/ml stock diluted in CBSS) was added to each well and observed using a fluorescent microscope (DAS Mikroskop Leica DM LB). Cells were evaluated for fluorescence and the percentage of live cells (non-fluorescent) was calculated.
Phagocytosis assay
Haemocyte monolayers were incubated in 50 μl of CBSS or E–S for 3 h. Latex beads of 3 μm diameter (SIGMA®) were then added to the monolayers. Prior to use in phagocytosis assay, beads were washed with CBSS for 30 min in constant agitation and then rinsed again 3 times with CBSS. Then 10 μl of bead solution were put in suspension in 1 ml of CBSS in order to obtain a suspension with 1% of latex beads. Then, 10 μl of this 1% bead suspension were added to the haemocyte monolayers. Immediately after bead sedimentation and every hour, the percentage of haemocytes containing beads was recorded. Because it is difficult to clearly distinguish beads present at the surface of haemocytes from beads that have actually been phagocytosed, all the beads observed in contact with haemocytes were scored as ‘phagocytosed' (Uchikawa & Loker, 1992).
E–S product treatments
Heat treatment consisted in placing E–S products in a boiling water bath for 5 min. They were then cooled to room temperature and used in a haemocyte spreading assay. In order to test the effect of trypsinization, E–S products were divided into 4×150 μl aliquots. The first aliquot was mixed with 75 μl of a trypsin solution (bovine pancreas trypsin type II, SIGMA 0.5 mg/ml, in CBSS) and was incubated for 30 min at room temperature under constant agitation. A volume of 75 μl of trypsin inhibitor (SIGMA, 0.5 mg/ml, in CBSS) was then added and the mixture was incubated for another 30 min. The second aliquot was exposed to 150 μl of a pre-mix of trypsin–trypsin inhibitor solution and was allowed to incubate for 60 min at room temperature under constant agitation. The third aliquot was prepared as the first but mixed with 75 μl of CBSS instead of trypsin. The fourth one was not treated. In order to control for a possible effect of the chemicals on haemocyte spreading, 3×150 μl aliquots of CBSS received the same treatment as the E–S products. Fifty μl of the different treated E–S or controls were used in the haemocyte spreading assay.
Because standard deglycosylation methods such as treatment with deglycosylases or sodium metaperiodate were not compatible with a bioassay on live cells, we chose to partially deglycosylate E–S products by adsorption on the lectin concanavalin A (ConA). Therefore, Sepharose 4B beads coated with conA (ConA–Sepharose®, Pharmacia Biotech) were used. Beads were rinsed 3 times in CBSS before use. E–S were divided in 2×500 μl aliquots. The first was incubated with 50 μl of ConA-coated beads diluted at 1% in CBSS and maintained under constant agitation for 60 min at room temperature. Beads were eliminated by centrifugation at 10000 g for 10 min and the supernatant was collected. The second aliquot was not treated but used as control E–S. Also as a control 500 μl of CBSS were treated with ConA-coated beads. Treated E–S and controls were used in a haemocyte spreading assay.
Fractionation of E–S products
Freshly collected E–S products were fractionated using Centricon-300 units, Centricon-100, Centricon-30, and Centricon-10 units (Vectaspin 3 polysulfone®, Fisher). The 5 fractions obtained with this method were lyophilized and then solubilized in CBSS at a concentration of 90 μg of protein/ml. Each fraction (<10 kDa, 10–30 kDa, 30–100 kDa; 100–300 kDa,>300 kDa) was then tested in the haemocyte spreading assay as described above.
Statistical analyses
Each experiment was performed on 3 replicates, and repeated 3 times independently i.e. with different pools of haemocytes and E–S products from different batches of parasites. Results are shown as mean percentage and standard deviation, but statistical tests were carried out on arcsine–transformed data. Differences between values were tested by using Mann–Whitney U-test for non-parametric data. Differences were considered as significant at P<0.05.
RESULTS
Effect of Echinostoma caproni E–S products on haemocyte spreading
After 3 h in CBSS, haemocytes from the 4 strains exhibited a similar proportion of spread versus unspread haemocytes (Fig. 1). Exposure to E–S products from 0–24 h cultures had a significant effect on the spreading of haemocytes from the 2 susceptible strains (P<0.001). E–S-exposed haemocytes from the 2 susceptible HAC and EAF snails clearly retracted their pseudopodia and rounded up (Fig. 2A–D). Interestingly, this effect of E–S products on spreading was not observed on E–S-exposed haemocytes from the 2 resistant CB and KB snail strains (Fig. 1). Haemocytes from these resistant snails remained well spread (Fig. 2E–F), and no difference was observed between the spreading of these haemocytes and those maintained in CBSS (P>0.1). In contrast to E–S products from 0–24 h cultures, E–S products from 24–48 h cultures had no effect on haemocyte spreading (Fig. 1).

Fig. 1. Percentage of spread haemocytes from the 2 susceptible HAC and EAF strains, and the 2 resistant KB and CB strains of Biomphalaria glabrata, after a 3 h exposure to CBSS, or Echinostoma caproni E–S products from 0–24 h (E–S 24 h) or 24–48 h (E–S 48 h) cultures. Asterisks indicate a significant difference from control (P<0.001) using the Mann–Whitney U-test.

Fig. 2. Morphology of haemocytes from the 2 susceptible HAC (A, B) and EAF (C, D) snail strains when exposed to CBSS (A and C) or Echinostoma caproni E–S products (B and D). Haemocytes from the 2 resistant KB and CB strains remained well spread after exposure to E. caproni E–S products (E and F).
Dose-dependent activity of E–S products
As shown in Fig. 3, the negative effect of E–S products on haemocyte adherence and spreading was dose dependent. For haemocytes from the 2 susceptible snail strains, the negative effect on spreading was significant (P<0.05) at a concentration of 22.5 μg E–S protein/ml and highly significant (P<0.001) at higher concentrations (Fig. 3A).

Fig. 3. Dose-dependent action of E–S products (A) or CBSS (B) on the spreading of haemocytes from the 2 susceptible HAC and EAF and the 2 resistant KB and CB strains of Biomphalaria glabrata. Significant decreases in spreading are indicated by asterisks (P<0.001; Mann–Whitney U-test).
On the contrary, haemocytes from the 2 resistant snail strains remained unaffected by E–S products at concentrations up to 225 μg E–S protein/ml (Fig. 3A). Their spreading was significantly decreased when exposed to E–S products at 450 μg E–S protein/ml.
Because E–S products were originally collected in CBSS and then lyophilized, it was necessary to test whether this spreading inhibition could be due to the salt concentration in the E–S samples. Therefore, increasing concentrations of lyophilized CBSS were used as a control in the haemocyte spreading assay. Results showed that only the highest concentration of 40 mg of lyophilized CBSS/ml had a significant effect on the spreading of haemocytes from the 4 strains (Fig. 3B). This value corresponds to an over-estimate of the salt concentration in E–S samples of 450 μg protein/ml. These results confirm that the strong decrease in spreading observed in susceptible haemocytes exposed to E–S ranging from 45 to 225 μg protein/ml was the result of E–S product activity and not CBSS salt concentration. Furthermore, they show that the concentration of 90 μg protein/ml originally used in the bioassay (Lodes & Yoshino, 1989) was the optimal value for detecting E–S activity in the spreading assay.
Effect of E–S products on haemocyte phagocytosis
The effect of E–S products from 24 h and 48 h cultures on phagocytosis was tested on haemocytes of snails from the 4 strains. As shown in Fig. 4, haemocytes from the 2 susceptible snail strains displayed a lower phagocytic activity when incubated in E–S products, as compared to haemocytes maintained in CBSS (P<0.001). Both E–S products from 0–24 h and 24–48 h cultures had a significant effect on phagocytosis (Fig. 4). In contrast, haemocytes from the 2 resistant snail strains showed a similar phagocytosis activity when incubated in CBSS or E–S from 0–24 h or 24–48 h cultures.

Fig. 4. Percentage of beads phagocytosed by haemocytes from the 2 susceptible HAC and EAF strains, and the 2 resistant KB and CB strains of Biomphalaria glabrata, after a 3 h exposure to CBSS, or Echinostoma caproni E–S products from 0–24 h (E–S 24 h) or 24–48 h (E–S 48 h) cultures. Asterisks indicate a significant difference from control (P<0.001) using the Mann–Whitney U-test.
Effect of various treatments on the activity of E–S products
Following a heat treatment of 5 min at 100 °C, E–S products lost their effect on the spreading of haemocytes, showing that the E–S active factors were heat labile (Fig. 5). Similarly, adsorption of E–S products onto concanavalin A-coated beads correlated with a loss of activity of E–S products (Fig. 5), suggesting that E–S active factor(s) is (are) glycosylated.

Fig. 5. Percentage spread of haemocytes from the 2 susceptible (HAC and EAF) strains, and 2 resistant (KB and CB) snail strains after a 3 h incubation in CBSS, heat-treated, concanavalin A-adsorbed or untreated E–S products. Asterisks indicate a significant difference from control (P<0.001) using the Mann–Whitney U-test.
Following incubation with trypsin and neutralization with a trypsin inhibitor, E–S products lost their negative effect on the spreading of haemocytes from the susceptible snails (Fig. 6). In contrast, E–S simultaneously exposed to trypsin and trypsin inhibitor, as well as E–S exposed to trypsin inhibitor, displayed an effect on haemocyte spreading comparable to that of untreated E–S products (Fig. 6). Results shown in Fig. 6 suggest that the E–S active factor was trypsin inhibited and show that the various chemicals (trypsin and/or trypsin inhibitor) did not negatively affect haemocyte spreading when solubilized in CBSS.

Fig. 6. Effect of various treatments on the E–S ability to affect the spreading of haemocytes from the 2 susceptible strains (HAC and EAF). T, trypsin treatment; T+I, trypsin + trypsin inhibitor treatment; I, inhibitor treatment. Significant differences (P<0.001) with the corresponding CBSS treatment using the Mann–Whitney U-test are indicated with an asterisk.
Effect of fractionated E–S products
E–S reconstituted with the 5 fractions retained a significant effect on haemocyte spreading (P<0.001). Only the fraction containing molecules of molecular mass between 10 and 30 kDa showed a significant effect on haemocyte spreading (Fig. 7). The percentage spread of haemocytes incubated in this fraction was significantly lower than the percentage of spread of haemocytes in control CBSS (P<0.001).

Fig. 7. Effect of various fractions of E–S products on the spreading of haemocytes from the 2 susceptible (HAC and EAF) strains. Asterisks indicate a significant difference compared to control CBSS using the Mann–Whitney U-test (P<0.001).
However, fractions containing molecules >30 kDa and the fraction containing molecules <10 kDa had no significant effect on haemocyte spreading. These results suggest that the active factor(s) responsible for the unspreading of susceptible haemocytes were of molecular mass between approximately 10 and 30 kDa.
DISCUSSION
Suppression or modulation of host defence functions via parasite excretory–secretory (E–S) products has been documented in a number of macroparasite species including entomopathogenic fungi (Vilcinskas & Götz, 1999), nematodes or nematobacterial complexes (Pastrana et al. 1998; Ribeiro et al. 1999), and other helminths (Lightowlers & Rickard, 1988).
Regarding trematode larvae, the clearest demonstration of an interference with host immune functions comes from echinostome species (van Der Knaap & Loker, 1990). Several studies showed that molluscs infected with echinostomes, including E. caproni, became ‘immunodeficient' and abnormally susceptible to other parasites (Lie, 1982; Lie & Heineman, 1977). More recently, in vitro studies demonstrated that E. paraensei sporocysts released soluble factors that alter behaviour of B. glabrata haemocytes (Loker, Cimino & Hertel, 1992). In particular, a time-lapse study revealed that in the presence of sporocysts, haemocytes moved away and rounded up (Adema et al. 1994).
The present study further confirmed the idea that echinostomes actively interfere with the defence response of their gastropod hosts via their E–S products (Lie, 1982). Using an in vitro approach, we showed that E. caproni E–S products significantly alter spreading and adhesion of haemocytes from susceptible B. glabrata snails. This parasite–mediated interference is further confirmed by the observed effect of E–S products on haemocyte phagocytotic activity. Because these functions are crucial in the process of encapsulation, it is likely that such an inhibitory effect directly prevents capsule formation in vivo.
Using a susceptible strain of B. glabrata, DeGaffé & Loker (1998) demonstrated that the infectivity of E. paraensei larvae in vivo was positively correlated with the ability of their E–S products to interfere with the spreading behaviour of host haemocytes in vitro. In the present study, we observed that, in contrast to haemocytes from susceptible snails, the haemocytes from resistant snails retained their adhesion and phagocytosis activity when exposed to E–S from E. caproni. Although further studies are needed to elucidate the precise resistance mechanism, it seems likely that the observed refractoriness of haemocytes to E–S products is directly involved in resistance. Because the in vitro experiments were carried out in the absence of snail plasma, the differential response of haemocytes may be attributed to constitutive differences in haemocyte composition. According to the present results, a possible resistance mechanism would be a quantitative or qualitative change in the target receptor or molecule of the active E–S factor.
Whether one or several parasite-secreted molecules are responsible for the alteration of haemocyte defence functions remains to be elucidated. The fact that phagocytosis is decreased in the presence of both E–S products from 24 and 48 h cultures, whereas adhesion and spreading are affected only by 24 h E–S products may reflect the action of several factors acting on different pathways. A multifactorial effect has been reported for example in the nematobacterial complex Steinernema carpocapse–Xenorhabdus nematophilus (Ribeiro et al. 1999). Here the authors characterized at least 2 E–S factors presenting an unsticking and a cytotoxic activity respectively. In our system, it is also possible that a unique factor acts on the pathways involved in spreading, adhesion and phagocytosis but at different concentrations. Both phagocytosis and spreading involve complex adhesive processes. Although the regulation of their pathways remain poorly understood (Ellis & Mellor, 2000), in particular in invertebrates, there is evidence that the binding of a particular adhesion receptor may affect multiple adhesion processes. For example, studies on integrins from several invertebrate species showed that the binding of the integrin ligand peptides could inhibit haemocyte spreading, cell–cell aggregation, phagocytosis of bacteria or haemocyte encapsulation reactions (Davids et al. 1999).
The partial biochemical characterization of E. caproni active factor(s) showed that the biological activity was present in a fraction of molecular mass between 10 and 30 kDa. In addition, this activity was lost after heat treatment, trypsinization, and adsorption on ConA-coated beads, suggesting that the active factor (or at least one of the key active factors) is a glycosylated polypeptide. Future analyses will aim at determining whether the sugar determinant of the E–S factor is involved in the ligand–binding interaction. More specifically, the potential involvement of a lectin–carbohydrate interaction will be investigated. To date, 2 genes coding for adhesion lectins have been characterized in B. glabrata, namely, an integrin-like gene (Davids & Yoshino, 1998; Davids et al. 1999) and a selectin-like gene (Duclermortier et al. 1999). Although the precise role of the corresponding lectins in snail haemocyte functions has not been fully clarified, such molecules represent good candidates for the observed differential adhesion of susceptible versus resistant haemocytes in response to E. caproni E–S products.
This work was financed by the CNRS (Sciences de la Vie). E. H. was supported by a fellowship from the French ‘Ministère de l'Education Nationale, de la Recherche et de la Technologie'.
References
ADEMA, C. M., ARGUELLO, D. F. II, STRICKER, S. A. & LOKER, E. S. (1994). A time-lapse study of interactions between Echinostoma paraensei intramolluscan larval stages and adherent haemocytes from Biomphalaria glabrata and Helix aspersa. Journal of Parasitology 80, 719–727.CrossRefGoogle Scholar
ADEMA, C. M., HERTEL, L. A., MILLER, R. D. & LOKER, E. S. (1997). A family of fibrinogen-related proteins that precipitates parasite-derived molecules is produced by an invertebrate after infection. Proceedings of the National Academy of Sciences, USA 94, 8691–8696.CrossRefGoogle Scholar
ADEMA, C. M. & LOKER, E. S. (1997). Specificity and immunobiology of larval digenean-snail associations. In Advances in Trematode Biology (ed. FRIED, B. & GRACZYK, T. K.), pp. 229–263. CRC Press, Boca Raton.
ANTONOVICS, J. & THRALL, P. (1994). The cost of resistance and the maintenance of genetic polymorphism in host–pathogen systems. Proceedings of the Royal Society of London, B 257, 105–110.CrossRefGoogle Scholar
ATAEV, G. L. & COUSTAU, C. (1999). Cellular response to Echinostoma caproni infection in Biomphalaria glabrata strains selected for susceptibility/resistance. Developmental and Comparative Immunology 23, 187–198.CrossRefGoogle Scholar
CHERNIN, E. (1963). Observations on hearts explanted in vitro from the snail Australobis glabratus. Journal of Parasitology 49, 353–364.CrossRefGoogle Scholar
COOPER, E. L., RINKEVICH, B., UHLENBRUCK, G. & VALEMBOIS, P. (1992). Invertebrate immunity: another viewpoint. Scandinavian Journal of Immunology 35, 247–266.CrossRefGoogle Scholar
COUSTAU, C. & YOSHINO, T. P. (1994a). Schistosoma mansoni: modulation of hemocyte surface polypeptides detected in individual snails, Biomphalaria glabrata, following larval exposure. Experimental Parasitology 79, 1–10.Google Scholar
COUSTAU, C. & YOSHINO, T. P. (1994b). Surface membrane polypeptides associated with hemocytes from Schistosoma mansoni-susceptible and -resistant strains of Biomphalaria glabrata (Gastropoda). Journal of Invertebrate Pathology 63, 82–89.Google Scholar
COUSTAU, C., CHEVILLON, C. & FFRENCH-CONSTANT, R. (2000). Resistance to xenobiotics and parasites: can we count the cost? Trends in Ecology and Evolution 15, 378–383.Google Scholar
DAVIDS, B. J. & YOSHINO, T. P. (1998). Integrin-like RGD-dependent binding mechanism involved in the spreading response of circulating molluscan phagocytes. Developmental and Comparative Immunology 22, 39–53.CrossRefGoogle Scholar
DAVIDS, B. J., WU, X.-J. & YOSHINO, T. P. (1999). Cloning of a β integrin subunit cDNA from an embryonic cell line derived from the freshwater mollusc, Biomphalaria glabrata. Gene 228, 213–223.CrossRefGoogle Scholar
DEGAFFE, G. & LOKER, E. S. (1998). Susceptibility of Biomphalaria glabrata to infection with Echinostoma paraensei: Correlation with the effect of parasite secretory-excretory products on host hemocyte spreading. Journal of Invertebrate Pathology 71, 64–72.CrossRefGoogle Scholar
DEMPSEY, M. A., SILVA, H. & KLESSIG, D. F. (1998). Engineering disease and pest resistance in plants. Trends in Microbiology 6, 54–61.CrossRefGoogle Scholar
DUCLERMORTIER, P., LARDANS, V., SERRA, E., TROTTEIN, F. & DISSOUS, C. (1999). Biomphalaria glabrata embryonic (Bge) cells express a protein with a domain homologous to the lectin domain of mammalian selectins. Parasitology Research 85, 481–486.CrossRefGoogle Scholar
ELLIS, S. & MELLOR, H. (2000). Regulation of endocytic traffic by rho family GTPases. Trends in Cell Biology 10, 85–88.CrossRefGoogle Scholar
FRANK, S. A. (1996). Statistical properties of polymorphism in host-parasite genetics. Evolutionary Ecology 10, 307–317.CrossRefGoogle Scholar
GRANATH, W. O. JR, CONNORS, V. A. & TARLETON, R. L. (1994). Interleukin 1 activity in haemolymph from strains of the snail Biomphalaria glabrata varying in susceptibility to the human blood fluke, Schistosoma mansoni: presence, differential expression, and biological function. Cytokine 6, 21–27.CrossRefGoogle Scholar
HALTERMAN, D. A. & MARTIN, G. B. (1997). Signal recognition and transduction involved in plant disease resistance. Essays in Biochemistry 32, 87–89.Google Scholar
JEYARASASINGAM, U., HEYNEMAN, D., LIM, H. K. & MANSOUR, N. (1972). Life cycle of a new echinostome from Egypt, Echinostoma liei sp. nov. (Trematoda: Echinostomatidae). Parasitology 65, 203–222.Google Scholar
KRAAIJEVELD, A. R., VAN ALPHEN, J. J. & GODFRAY, H. C. (1998). The coevolution of host resistance and parasitoid virulence. Parasitology 116 (Suppl.), S29–S45.CrossRefGoogle Scholar
LANGAND, J., JOURDANE, J., COUSTAU, C., DELAY, B. & MORAND, S. (1998). Cost of resistance, expressed as a delayed maturity, detected in the host-parasite system Biomphalaria glabrata/Echinostoma caproni. Heredity 80, 320–325.CrossRefGoogle Scholar
LIE, K. J. (1982). Survival of Schistosoma mansoni and other trematode larvae in the snail Biomphalaria glabrata. A discussion of the interference theory. Tropical and Geographical Medicine 34, 111–122.Google Scholar
LIE, K. J. & HEINEMAN, D. (1977). Studies on resistance in snails: Interference by nonirradiated echinostome larvae with natural resistance to Schistosoma mansoni in Biomphalaria glabrata. Journal of Invertebrate Pathology 29, 118–125.CrossRefGoogle Scholar
LIGHTOWLERS, M. W. & RICKARD, M. D. (1988). Excretory–secretory products of helminth parasites: effects on host immune responses. Parasitology 96 (Suppl.), S123–S166.CrossRefGoogle Scholar
LODES, M. J. & YOSHINO, T. P. (1989). Characterization of excretory-secretory proteins synthesized in vitro by Schistosoma mansoni primary sporocysts. Journal of Parasitology 75, 853–862.CrossRefGoogle Scholar
LOKER, E. S., CIMINO, D. F. & HERTEL, L. A. (1992). Excretory–secretory products of Echinostoma paraensei sporocysts mediate interference with Biomphalaria glabrata hemocyte functions. Journal of Parasitology 78, 104–115.CrossRefGoogle Scholar
MOORE, D. V., THILLET, G. J., CARNEY, D. M. & MELENEY, H. E. (1953). Experimental infection of Bulinus truncatus with Schistosoma haematobium. Journal of Parasitology 39, 215–221.CrossRefGoogle Scholar
OWE-MISSI-OUKEM-BOYER, O., PORCHET, E., CAPRON, A. & DISSOUS, C. (1994). Characterization of immunoreactive TNFα molecules in the gastropod Biomphalaria glabrata. Developmental and Comparative Immunology 18, 211–218.CrossRefGoogle Scholar
PASTRANA, D. V., RAGHAVAN, N., FITZGERALD, P., EISINGER, S. W., METZ, C., BUCALA, R., SCHLEIMER, R. P., BICKEL, C. & SCOTT, A. L. (1998). Filarial nematode parasites secrete a homologue of the human cytokine macrophage migration inhibitory factor. Infection and Immunity 66, 5955–5963.Google Scholar
REDDY, A. & FRIED, B. (1996). Egg laying in vitro of Echinostoma caproni (Trematoda) in nutritive and nonnutritive media. Parasitology Research 82, 475–476.CrossRefGoogle Scholar
RIBEIRO, C., DUVIC, B., OLIVEIRA, P., GIVAUDAN, A., PALHA, F., SIMOES, N. & BREHÉLIN, M. (1999). Insect immunity-effects of factors produced by a nematobacterial complex on immunocompetent cells. Journal of Insect Physiology 45, 677–685.CrossRefGoogle Scholar
RICHARDS, C. S., KNIGHT, M. & LEWIS, F. A. (1992). Genetics of Biomphalaria glabrata and its effect on the outcome of Schistosoma mansoni infection. Parasitology Today 8, 171–174.CrossRefGoogle Scholar
SIMMS, E. L. & FRITZ, R. S. (1990). The ecology and evolution of host-plant resistance to insects. Trends in Ecology and Evolution 5, 356–360.CrossRefGoogle Scholar
SMINIA, T. & BARENDSEN, L. (1980). A comparative morphological and enzyme histochemical study on blood cells of the freshwater snails Lymnaea stagnicola, Biomphalaria glabrata, and Bulinus truncatus. Journal of Morphology 165, 31–39.CrossRefGoogle Scholar
SORCI, G., MOLLER, A. P. & BOULINIER, T. (1997). Genetics of host-parasite interactions. Trends in Ecology and Evolution 12, 196–200.CrossRefGoogle Scholar
STEAR, M. J. & WAKELIN, D. (1998). Genetic resistance to parasitic infection. Revue Scientifique et Technique O. I. E. (Office International des Epizooties) 17, 143–153.CrossRefGoogle Scholar
TROUVÉ, S., RENAUD, F., DURAND, P. & JOURDANE, J. (1996). Selfing and outcrossing in a parasitic hermaphrodite helminth (Trematoda, Echinostomatidae). Heredity 77, 1–8.CrossRefGoogle Scholar
UCHIKAWA, R. & LOKER, E. S. (1992). Echinostoma paraensei and Schistosoma mansoni: Adherence of unaltered or modified latex beads to hemocytes of the host snail Biomphalaria glabrata. Experimental Parasitology 75, 223–232.CrossRefGoogle Scholar
VAN DER KNAAP, W. P. W. & LOKER, E. S. (1990). Immune mechanisms in trematode–snail interactions. Parasitology Today 6, 175–190.CrossRefGoogle Scholar
VILCINSKAS, A. & GÖTZ, P. (1999). Parasitic fungi and their interactions with the insect immune system. Advances in Parasitology 43, 267–313.CrossRefGoogle Scholar

Fig. 1. Percentage of spread haemocytes from the 2 susceptible HAC and EAF strains, and the 2 resistant KB and CB strains of Biomphalaria glabrata, after a 3 h exposure to CBSS, or Echinostoma caproni E–S products from 0–24 h (E–S 24 h) or 24–48 h (E–S 48 h) cultures. Asterisks indicate a significant difference from control (P<0.001) using the Mann–Whitney U-test.
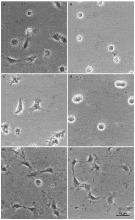
Fig. 2. Morphology of haemocytes from the 2 susceptible HAC (A, B) and EAF (C, D) snail strains when exposed to CBSS (A and C) or Echinostoma caproni E–S products (B and D). Haemocytes from the 2 resistant KB and CB strains remained well spread after exposure to E. caproni E–S products (E and F).
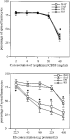
Fig. 3. Dose-dependent action of E–S products (A) or CBSS (B) on the spreading of haemocytes from the 2 susceptible HAC and EAF and the 2 resistant KB and CB strains of Biomphalaria glabrata. Significant decreases in spreading are indicated by asterisks (P<0.001; Mann–Whitney U-test).

Fig. 4. Percentage of beads phagocytosed by haemocytes from the 2 susceptible HAC and EAF strains, and the 2 resistant KB and CB strains of Biomphalaria glabrata, after a 3 h exposure to CBSS, or Echinostoma caproni E–S products from 0–24 h (E–S 24 h) or 24–48 h (E–S 48 h) cultures. Asterisks indicate a significant difference from control (P<0.001) using the Mann–Whitney U-test.
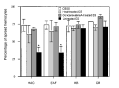
Fig. 5. Percentage spread of haemocytes from the 2 susceptible (HAC and EAF) strains, and 2 resistant (KB and CB) snail strains after a 3 h incubation in CBSS, heat-treated, concanavalin A-adsorbed or untreated E–S products. Asterisks indicate a significant difference from control (P<0.001) using the Mann–Whitney U-test.

Fig. 6. Effect of various treatments on the E–S ability to affect the spreading of haemocytes from the 2 susceptible strains (HAC and EAF). T, trypsin treatment; T+I, trypsin + trypsin inhibitor treatment; I, inhibitor treatment. Significant differences (P<0.001) with the corresponding CBSS treatment using the Mann–Whitney U-test are indicated with an asterisk.
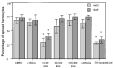
Fig. 7. Effect of various fractions of E–S products on the spreading of haemocytes from the 2 susceptible (HAC and EAF) strains. Asterisks indicate a significant difference compared to control CBSS using the Mann–Whitney U-test (P<0.001).
 You have
Access
- 43
- Cited by