1. Introduction
African wildlife species, such as the elephant, exhibit substantial, multiple values, including their importance to preservationists and significance to African economic welfare. Wildlife has potential consumptive direct use values, non-consumptive direct use values, indirect use values, and non-use values (e.g., Barbier et al., Reference Barbier, Burgess, Swanson and Pearce1990; Barnes, Reference Barnes1998, Reference Barnes2001). In particular, African wildlife generates substantial revenues from tourism. However, terrestrial wildlife species also generate a social opportunity cost through their use of resources such as land. Additional direct costs are associated with their requirements for management resources like game wardens. Finally, wildlife generates negative externalities for people living near them (Bell, Reference Bell, Bell and Mcshane-Caluzi1984; Wambuguh, Reference Wambuguh1998; Hoare, Reference Hoare1999), via the damage associated with destruction of crops, property, and human life (Swanson, Reference Swanson1994; Sutton, Reference Sutton1998).
Realistic economic models of wildlife management require accurate measurement of both the magnitude and distribution of costs, particularly those incurred by farmers who share their environment with the wildlife. However, a challenge to the incorporation of these costs into management models is the difficulty of their measurement. Most work to date has involved qualitative descriptions of wildlife–human conflict (e.g., Kiiru, Reference Kiiru1995; Ngure, Reference Ngure1995). In some cases, farmers have been interviewed systematically regarding the damages incurred (e.g., Wambuguh, Reference Wambuguh1998; Bandara and Tisdell, Reference Bandara and Tisdell2002). However, farmers may not keep accurate damage records and may have an incentive to inflate damages to increase potential reparation payments (Swallow and Woudyalew, Reference Swallow and Woudyalew1994; Kangwana, Reference Kangwana and Kangwana1996; Hoare, Reference Hoare1999; Bandara and Tisdell, Reference Bandara and Tisdell2002).
Some ecologists have attempted direct, physical measurement of damages by placing someone proximate to the place and time of the attack to estimate the damage to crops or structures (e.g., O'Connell, Reference O'Connell1995a, Reference Kiiru1995b; Hoare, Reference Hoare1999). A financial value is then placed on the damaged goods. With this method, the researcher does not have to rely on the farmer's word. However, this approach is expensive and significant subjectivity is involved. Accurately determining the value of crops destroyed requires predicting what the harvest quantity and price would have been without the attack. As this information is difficult to come by, damages are frequently assessed by assigning retail market prices to average yields, which is rather inexact.
The direct measurement of damages also overlooks the indirect costs of living with wildlife (Sutton, Reference Sutton2001), which may be higher than the direct costs. The indirect costs include the opportunity cost of growing less valuable crops because they are less attractive to wildlife and planting smaller areas that are easier to guard, and the psychological cost of threats to humans from fearsome species.
Finally, the direct measurement of damages, as typically applied (e.g., Hoare, Reference Hoare1999), suffers from sample selection bias. The data include only those households that actually report wildlife damage. Farmers who employ illegal deterrent methods, such as shooting at wildlife, are less likely to report damage incidents, as are small-scale farmers.Footnote 1 On the other hand, even in surveys where farmers are randomly selected to participate, the survey sites are typically chosen because of their high incidence of conflict, which could overestimate damages for a region (e.g., Bandara and Tisdell, Reference Bandara and Tisdell2002). Because random sampling methods are not typically employed for the direct physical measurement approach, conclusions from studies employing it cannot be generalized across either human or wildlife populations.
This paper measures the costs to farmers of living with wildlife by assessing farmers' willingness to pay (WTP) for technologies that prevent wildlife damage. This WTP to avoid damage from an externality is, by definition, the damage cost from the externality (Freeman, Reference Freeman1993). By focusing on the WTP to avoid damage, we can utilize the contingent valuation method (CVM) to obtain a damage measure that does not suffer from the problems that plague the direct physical measurement approach. CVM has been used in numerous studies to elicit the viewing value of wildlife from western tourists (e.g., Brown and Henry, Reference Brown, Henry and Barbier1993; Stoltz, Reference Stoltz1997; Krug, Reference Krug1998), or the existence value to urban residents in developing countries (Bandara and Tisdell, Reference Bandara and Tisdell2004). We believe this is the first rigorous application of CVM to measure externality costs to local people who live with wildlife in developing countries. The information elicited directly measures the shadow costs of the wildlife problem households seek to avoid. In theory, the approach allows for the accurate measurement of both the direct and indirect costs in a relatively quick and cost-effective way. By using a random sample, problems of sample selection bias are avoided and the results can be aggregated for a region. By focusing on farmers' payments for a private good to reduce their externality costs, the incentive problems that plague the physical measurement approach are reduced.
We also ask WTP questions in two ‘currencies’, money and bags of maize, that are analyzed jointly in a utility-theoretic framework. The use of two currencies has important advantages over standard applications of CVM, particularly in working with subsistence farmers whose economic transactions may not be wholly monetized. In response to our survey, less than 30 per cent of households reported selling any maize at all during the previous year. Since many smallholder households in the survey area are cash-constrained, the possibility of exchanging a household staple like maize may offer a more practical option. Asking WTP in multiple currencies also provides more information about the preferences of each household. Use of the dual CVM responses to estimate WTP provides a third payoff, which is an estimate of the monetary value of the non-monetary currency – in our case, the household shadow value of maize.Footnote 2 Because the shadow values are random variables whose standard errors are estimated, our methodology allows for the possibility of testing whether household shadow values differ significantly from market prices. Household shadow values may differ substantially from market prices due to transaction costs and market imperfections,Footnote 3 and our approach provides a new way of assessing them.
2. The study setting
The damage assessment approach is implemented for farm households in the eastern Caprivi Region of Namibia. The Caprivi Region is blessed with an abundance and diversity of wildlife and is one of the few places in Namibia where significant numbers of large mammals roam freely outside the confines of parks or game ranches (Rodwell et al., Reference Rodwell, Tagg and Grobler1995). It is also home to a rapidly growing human population that relies primarily on natural resources for subsistence and economic development (Mendelsohn and Roberts, Reference Mendelsohn and Roberts1997). The combination of these factors has resulted in considerable conflict between Caprivi farmers and the local wildlife (O'Connell, Reference O'Connell1995a, Reference O'Connell1995b). In addition, tourism is an important and growing sector that relies largely on the possibility of viewing charismatic megafauna such as elephant, lion, hippo, and buffalo. But these are the same species that farmers accuse of causing the most damage. They also – particularly in the case of elephant – can have wide ranges that take them across national boundaries, which means that wildlife management in Caprivi affects not only agriculture and tourism in Namibia, but in other countries as well.
The household survey conducted for this assessment used a two-stage, random sample stratified by agro-ecological zones and villages (Directorate of Planning, 1999). Two villages were randomly selected in each of three zones, for a total of six villages. The average number of households per village was 110. In five of the villages which were all of similar size, 30 households were randomly selected using census data, while in the sixth village 20 households were selected due to its lower population. The sample was also selected to reflect the proportion of male- and female-headed households in each village. Of the 170 households selected for the survey, five refused to participate and 17 were later dropped as ‘protesters’.Footnote 4 Thus, a total of 165 households completed the survey. The six villages represent the diversity of agricultural practices, ethnicities, market conditions, and environmental characteristics found in this area of the Caprivi, including the continuum of farmer conflict with wildlife. The survey instrument was developed and refined using focus groups and pre-testing. A comparison of data means from our sample and from a sample previously taken by the Directorate of Planning suggests that our sample is reasonably representative of this zone of the Caprivi, which is where farmer conflict with wildlife is thought to be important.Footnote 5 But this problem is also relevant for other areas of Namibia, as well as for other African countries, in particular the neighboring nations of Angola, Botswana, Zambia, and Zimbabwe.
The survey asked households their WTP for a deterrent to wildlife attacks – specifically, an electric fence. This is a familiar technology, since electric fences have been used on an experimental basis in the Caprivi Region to protect villages and crops from wildlife for some time (O'Connell, Reference O'Connell1995a). Visual aids were also used to illustrate the concept. Though the study began with a focus on elephants, it was soon realized that an electric fence would also be effective against other wildlife types and domestic livestock. By including those species as well as the elephant in the CVM survey, the study controls for their effects on WTP and also generates separate estimates of their shadow costs to farmers. Animal species were divided into four groups: elephants, other wild herbivores, wild predators, and livestock. Elephants pose unique management problems and were identified in other studies (e.g., von Rohr, Reference von Rohr1997) and our own prior interviews with farmers and wildlife management specialists as the species causing the greatest concern to farmers. In addition to the CVM data collected, we also surveyed households on their agricultural production and other economic activities, as well as their demographics.
As described in the survey, the hypothetical electric fencing would surround both the household's fields and its livestock corral. Thus, it would protect crops from being eaten or trampled and protect livestock from being killed in the corral. It was made explicit to respondents that their household alone would own the fence and that the household would be required to pay for it every year, in either money or maize. The fence would therefore be a private good, characterized by individual property rights and the excludability of other users. The level of investment in the fence should only enter into the choice problem of the concerned household (though the government may subsidize the cost).Footnote 6
The characteristics of the fence deterrent, for example cost and the proportion of wildlife attacks deterred for each wildlife type, were varied randomly across households. It is realistic to assume that different types of fences protect differentially against different types of wildlife and that success is related to cost. By varying these characteristics randomly across the sample, we can identify the WTP to reduce attacks by each wildlife type.
After the fence deterrent had been described in detail, including fence cost and the proportion of attacks prevented, the respondent (typically the head of household) was asked whether he or she would be willing to pay a specified amount (the ‘bid’) every year for a permanent reduction in attacks. Two sets of questions were asked: one set for WTP money, with no payment of maize, and a second set for WTP in bags of maize, with no money payment. For each, a ‘two-and-a-half’ bounded format was used (e.g., Cooper et al., Reference Cooper, Hanemann and Signorello2002). This is an extension of the standard double-bounded, referendum-style format to include an additional question for those who answer ‘no’ to both the initial and follow-up WTP questions. The advantages of the referendum format are well known and include ease of use and minimal information demands on respondents (Mitchell and Carson, Reference Mitchell and Carson1989).Footnote 7 The use of a follow-up question can improve estimation efficiency (Hanemann et al., Reference Hanemann, Loomis and Kanninen1991). It is generally accepted that WTP, rather than willingness to accept (WTA), is the correct measure of the value of a private or public good that is not currently owned by the respondent, as is the case here (Mitchell and Carson, Reference Mitchell and Carson1989; Freeman, Reference Freeman1993).
3. The farm household model
The WTP equations for both cash and maize payment are based on a farm-household behavioral model developed to describe decision-making by Caprivi households (Singh et al., Reference Singh, Squire and Strauss1986; de Janvry et al., Reference de Janvry, Fafchamps and Sadoulet1991; Sadoulet and de Janvry, Reference Sadoulet and de Janvry1995). This approach allows for the definition of both WTP measures in a manner that is internally consistent and grounded in utility theory. The model is simplified to focus on the two constraints related to the two WTP values elicited by the questionnaire: money and maize. The questions were framed in the temporal context of the households having just completed their prior season's harvest. Thus, their production and total maize availability is predetermined.
The farm-household's problem becomes one of allocating their fixed money budget M and fixed maize stock S to maximize utility. This is achieved by purchasing a vector of m market goods x with money prices p, and by using maize for n non-market activities c, including household consumption, barter, and livestock feed. Use of grain also has a ‘price’ or unit cost of consumption t that reflects wastage or spillage in converting units of stock to units of consumption of grain. This is not a market price, but can be thought of as a technical conversion coefficient. It would be 1.0 if no wastage occurs and higher if some does occur. The household maximizes its utility given socio-economic characteristics of the household z and the vector of fixed levels of government-sponsored programs to deter wildlife attacks g. The household faces strictly binding constraints on its money budget M = px and on its stock of maize S = tc.Footnote 8 The household's primal problem then leads to the indirect utility function V(p,t,g,z,M,S), defined as

where u(x, c; g, z) is the household's direct utility function. The standard properties of indirect utility functions hold for V(·) in (1). In addition, it is decreasing in t and increasing in S. The money and grain budgets have been normalized by deflators δM(p, M) and δS(t, S), each homogeneous of degree 1 in its arguments, to maintain homogeneity of degree 0 of the indirect utility function in the arguments of each constraint (i.e., (t, S) and (p, M)).
The interpretation of the Lagrange multipliers is straightforward. From the Envelope Theorem applied to (1), the marginal utility of money is VM ≡ ∂V(·)/∂M = λ, and the marginal utility of maize stock is V S ≡ ∂V(·)/∂S = μ. The ratio of these multipliers (μ/λ) gives the shadow value of maize in units of dollars per kilo.
The first-order conditions for market goods imply

where u i ≡ ∂u/∂x i. This is the standard result that the household's optimal level of market good purchases is reached by equating the marginal value of consuming a market good (ui/λ) with its money price pi. The units are monetary. The problem also generates first-order conditions for the consumption of maize for non-market activities, which implies

where uj ≡ ∂u/∂cj. This result says that the household's optimal level of non-market good consumption is reached by equating the marginal value of using maize for consumption (uj/μ) with the cost of this use. In this case, the units are physical (e.g., kilos of maize).
Defining the function υ(·), where

represents the shadow value of maize, the results of Larson and Shaikh (Reference Larson and Shaikh2001) and Larson (Reference Larson2002) can be used to identify arguments of υ(·). They show that the normalized shadow value is homogeneous of degree 0 in (p, M), (t, S), and (p, t, S, M), a specification that is satisfied if υ(·) is a function of household characteristics z and independent of the budget arguments. Specifying the maize shadow value this way, as υ(z), one can rewrite the problem in (1) as

This equivalent representation of the two-constraint household choice problem can be interpreted as a single-constraint problem where the resource constraint is ‘full’ budget M + υ(z)·S, against which money expenditures px and grain expenditures monetized by the shadow value of maize, υ(z)·tc, are made. The problem in (3) suggests that the household's indirect utility function has the form

which is a function of money prices p, monetized maize prices υ(z)·t, and full budget M + υ(z) · S (as well as the deterrent program g and household characteristics z). Larson and Shaikh (Reference Larson and Shaikh2001) showed that the full budget, monetized prices formulation in (4) is consistent with the hypothesis that both constraints bind. Also, it is straightforward to see that in (4), VS/VM = υ(z); that is, the functional form in (4) is consistent with the definition of the maize shadow value in (2). This relationship is used to develop WTP measures based on both money and maize currencies.
4. Willingness to pay measures
The indirect utility function V(·) defined in equation (4) can be used to derive two compensating variation measures of the household's WTP, in money and in maize, in a manner consistent with the household's utility-maximizing behavior. The parameter change represents the implementation of the government-sponsored deterrent program, from g 0 to g 1. The WTP in money (wtpM) is determined by the change in the money budget necessary to maintain the household at the same level of utility after the deterrent program as before, with the household free to choose the levels of other activities

where V 0 is the initial level of utility. Since indirect utility is monotonically increasing in the full budget argument M + υ(z)·S, it can be inverted with respect to this argument (see Larson et al., Reference Larson, Shaikh and Layton2004) to obtain

which can be solved for money WTP explicitly, resulting in

The WTP for the deterrent program in terms of maize stocks (wtpS) is derived in a similar manner. It is defined by

Since maize stocks are part of the same full budget argument as money budget, (8) can also be inverted with respect to this argument to obtain

which can be solved for maize WTP explicitly as

It should be noted that both (7) and (10) provide measures of households' WTP for discrete – rather than marginal – changes in the level of government-sponsored deterrent programs g. The discrete measure is believed to be more realistic than the marginal measure because government programs are typically implemented to effect substantial changes, such as a 50 per cent reduction in animal attacks, which is the context in which the contingent valuation survey questions were posed.
To examine the relationship between the two WTP measures, observe that equations (6) and (9) have the same right-hand side, f(p, υ(z) · t, g1, z, V 0). As a result, equating the left-hand sides of each

and simplifying shows that

Thus, a household's WTP in money and its WTP in maize for the government-sponsored deterrent program (g) are related by υ(z), the shadow value of maize. This is intuitive, as υ(z) converts a household's WTP in maize into monetary units, according to the internal value that the household places on a physical unit of maize.
To summarize, by beginning with a behavioral model of farm–household choice with two constraints – one on money budget and one on maize stock – and exploiting the structure of the problem, the following three estimates have been derived in a theoretically rigorous and internally consistent manner: (1) WTP money, (2) WTP maize, and (3) the monetary equivalent of maize to the household. Econometric estimates of the shadow values of maize are produced as part of the likelihood maximization corresponding to the household's choice of fence deterrent. These estimates allow us to test whether the shadow value of maize is significantly different from the prevailing market price. This provides a gauge for the existence of a well-functioning maize market, as well as an indication of the bias that would be incurred from using market prices to approximate the shadow price values, as has been done elsewhere (e.g., Shyamsundar and Kramer, Reference Shyamsundar and Kramer1996).
5. Econometric model
To develop an econometric model, functional forms for the WTP functions, the shadow value of maize, and the error distribution must be chosen. The household's true valuation in money terms is denoted wtpM. It is composed of a systematic component h(Xγ), where X is the matrix of explanatory variables that influence the value the household places on the deterrent program and γ is a conformable parameter vector. Added to this is an unobservable random component ϵm that encompasses the determinants of the household's value for the program that cannot be measured by the researcher. It is assumed that WTP in money has a lognormal distribution, because the program being evaluated is a good and therefore households should only place a positive value on it. It can therefore be specified as

where σm is a scale factor used to transform the error term into a standard normal random variable, and ϵm is therefore marginally distributed N(0,1).
Similarly, the household's true valuation for the deterrent program being evaluated in maize terms is denoted wtpS. It is composed of the same systematic component h(Xγ), and an unobservable random component ϵs. For the relationship between WTP money and WTP maize in (11) to hold, it must be the case that

so that from (12), it is apparent that

where σs is a scale factor and ϵs is marginally distributed N(0,1). The separate error ϵs is used to reflect the fact that there may be some sources of error specific to the maize question. In any event, as it includes ϵm, it is likely to be correlated with ϵm.
The Generalized Leontief functional form was selected to represent the systematic component h(Xγ) of WTP, resulting in the expression
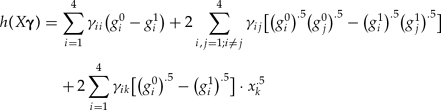
where g i represents the effectiveness of (number of animals repelled by) deterrents against one of the four animal threat types i either before (g 0) or after (g 1) the implementation of the government-sponsored program, while g j represents the level of effectiveness against one of the other animal types. The γii are therefore the parameters to be estimated for the own-effects of a deterrent type on WTP, while the γij are estimated parameters on the cross effects between animal types deterred. The x k represent all other variables that might explain a household's WTP for a deterrent program, such as the size of its fields or cattle herd. These are also interacted with each of the four types of deterrent effectiveness g i, and the resulting parameters represented by γik.
Only the change in the effectiveness of the government program in deterring each of the four types of animal attack also appears as a separate explanatory variable. All other regressors appear only as cross effects with the change in the deterrent program. In addition, the model does not contain an intercept. Each of these features is somewhat unique in WTP models. They are incorporated because the good being valued is private (although a CVM approach is still appropriate since the good is not actually purchased by the respondent). We assume that WTP would be 0 if the respondent household did not expect to benefit from the deterrent program. The functional form specified in (14) also conforms to the requirements of (4), is fairly flexible, and allows for curvature in the relationships between explanatory variables and WTP.
The general form of the shadow value of maize υ(z) was a linear function

where Y is the matrix of household characteristics thought to influence the household's shadow value for maize and β is a conformable vector of parameters.
Although money and maize bids were each varied randomly across the sample, one would expect the household's true WTP in the two numeraires to be related. Estimating a model based on the joint distribution of the two amounts allows for more efficient use of the available information. A bivariate probit model was estimated in which ϵm and ϵs are jointly distributed N(0,0,1,1,ρ), where ρ is the covariance between the two error terms.
Because the response format was two-and-a-half bounded, five intervals of WTP are defined for both money and maize. Indexing the set of all 25 possible response patterns in the joint estimation by r, and defining an indicator variable I r = 1 if response pattern r occurs, I r = 0 otherwise, the likelihood function for the observed patterns of responses across the sample can be written succinctly as

6. Estimation
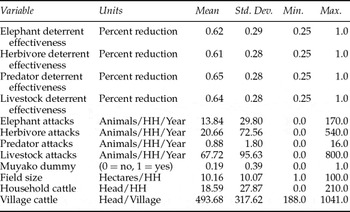
To jointly estimate the parameters in equations (12), (13), and (15), the log of the likelihood function in (16) was maximized using the Maximum Likelihood Module Version 4.0.26 of Gauss Version 3.2.32. Table 1 summarizes the variables that provide the foundation for creating the regressors of the model. The deterrent effectiveness variables represent the deterrent qualities of the electric fence that varied across households. The effectiveness was specified for each of the four animal types as a 25, 50, 75, or 100 per cent reduction in the number of animal attacks experienced by the household relative to the previous year. Other variables represented the number of attacks of each animal type experienced per household during the past year. The number of attacks ranged widely, e.g. from an average of only 0.88 predator incidents per household to 67.72 livestock incidents. The interactions between the animal attack variables and the deterrent effectiveness variables yield estimates of the reductions achieved in the numbers of animals attacking.
Descriptive statistics for the sample (n = 148)Footnote 17

Table 1 describes additional potential determinants of WTP, including the area of a household's cropland, which averages over 10 hectares; the number of cattle it owns, which averages 18.59 head; and the number of cattle in an entire village, which is nearly 500 head. A dummy variable was introduced for the village of Muyako, as it is structurally different from the other villages in the sample. The average household in Muyako owns significantly more cattle, has larger fields, produces more maize, has a higher cash income, and is generally better off.
7. Results
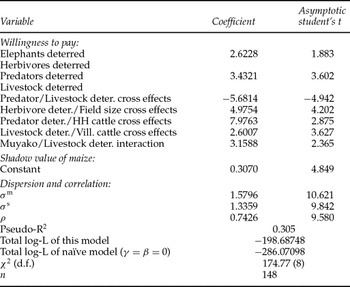
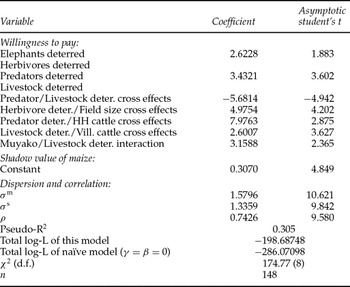
Table 2 provides the bivariate probit results for a model that jointly estimates the parameters for WTP in cash, WTP in maize, and the shadow value of maize. Numerous forms of the WTP and shadow value functions were estimated in an effort to take full advantage of the rich survey data collected on farm households in Caprivi and to explain the sources of variation in WTP. Cross effects between the numbers of different animal types deterred as indicated in (14) were estimated. Measures of the importance of different agricultural activities to the household – such as the value of their livestock, the total numbers of their livestock, the total value of their annual harvest, and the size of their fields – were examined. Agricultural practices, such as the start date of cultivation, were included. The Muyako dummy was also interacted with variables such as the number of each animal type deterred by the program. Various estimates of the full money and maize budgets were included, such as money income and the value of maize harvests. These did not prove to be very good predictors of WTP, possibly because incomes and harvests are not well measured or accurately reported.
Joint bivariate probit estimates of WTP and the shadow value of maize
A number of variables were also created from Geographic Information System (GIS) data, including measures of the local elephant population, farming potential, conservation potential, distance from the nearest conservation area, and percentage of cultivated area (see Mendelsohn and Roberts, Reference Mendelsohn and Roberts1997). These variables were interacted with the animals-deterred variables as indicated by (14). The GIS variables became insignificant as other, more powerful determinants of WTP were added, probably because the GIS variables were village-level aggregates, unlike the household-level data we collected.
In addition to a constant, dummy variables for other characteristics hypothesized to affect the value households placed on maize were included in the shadow value function. Among these were indicators of whether the household sold any maize during the past year, whether the household was estimated to be in a grain production deficit, and whether the household was located in Muyako. Several combinations of these status indicators were also employed (e.g., located in Muyako and a grain seller).
The model presented in table 2 was the most effective in explaining jointly the WTP money and maize and the shadow value of maize. The model is highly significant as measured by the total log-likelihood, resulting in a likelihood ratio test statistic of 174.77 and a pseudo-R2 of 0.305. The number of elephants deterred is significant at the 3 per cent level, with a Student's-t statistic of 1.88. All of the other explanatory variables – the number of predators deterred, the cross effects between the number of predators and livestock deterred, the cross effects between the number of herbivores deterred and the household's field size, the cross effects between the number of predators deterred and the size of the household's cattle herd, the cross effects between the number of livestock deterred and the size of the village cattle herd, and the interaction between the Muyako dummy variable and the number of livestock deterred – are significant at the 1 per cent level, with t-statistics of 2.37 or greater in absolute values, as reported in table 2. The shadow value of maize and the dispersion and correlation parameters are also highly significant. The shadow value has a t-statistic of 4.85, the standard errors of money and maize have t-statistics of 10.62 and 9.84, respectively, and the correlation ρ has a t-statistic of 9.58 (all resulting in P-values of 0). The estimated model offers a considerable improvement over a naïve model using only the dispersion and correlation parameters.
The herbivores deterred/field size cross effects variable indicates that households with larger areas under cultivation are willing to pay more to deter herbivores. The predators deterred/household cattle cross effects variable suggests that households with larger cattle herds are willing to pay more to deter predators from attacking. The livestock deterred/village cattle cross effects variable indicates that in villages with larger cattle populations, households are willing to pay more for a deterrent to livestock attacks. The Muyako/livestock deterred interaction variable implies that Muyako households are willing to pay more to deter livestock attacks. All of these results seem reasonable and intuitive. The elephants deterred variable is significant and positive, indicating that households are willing to pay to prevent elephant attacks. However, the variable was not significant when interacted with other variables.
The estimated correlation parameter ρ is 0.74, representing a high degree of correlation between the error terms. Hypothesis testing reveals that ρ is highly significantly different from 0 and from 1. This result supports the use of a bivariate model to estimate WTP across the two currencies.Footnote 9
Ultimately, the shadow value of maize υ(·) was estimated as a constant: the other variables used in this expression became insignificant as the variation in WTP became better explained. The estimated (farm-gate) shadow value of N$0.31/kg of maize was highly significant. Unfortunately, there is no equivalent market price information collected at the farm gate in Caprivi, which would allow for comparison. In this case, the only information that we could obtain on a market price was the unofficial mill-door price for maize in the regional capital, which was reported to be N$0.86/kg,Footnote 10 significantly higher than our calculated farm-gate shadow value.
Indeed, farmers' shadow values should be lower than the mill-door price because of transportation and other transaction costs involved in getting the maize to the mill. The difference could also be indicative of imperfections in the rural Caprivi maize market, such as the existence of a few traders with monopsony power and a lack of access to market information by farmers, or of a simple error in price reporting. Regardless, the result demonstrates the potential for error if WTP is estimated by multiplying households' WTP in a non-market currency by the market price to determine their WTP money.Footnote 11
8. Willingness to pay estimates
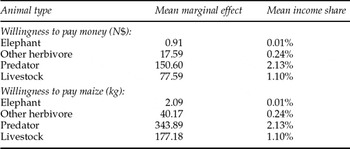
Table 3 presents the marginal effects of a reduction of one attack by each animal type deterred on WTP in cash and in maize. These values are the derivative of the WTP with respect to an animal type deterred, evaluated at each household's actual level of attacks, and averaged across the sample. The mean household WTP to deter one predator from attacking one time is N$150.60 in cash or 343.89 kg in maize.Footnote 12 Surprisingly, the mean WTP to deter one elephant attack is only N$0.91 or 2.09 kg of maize. The WTP to deter attacks by one livestock or one wild herbivore falls in-between, at N$77.59 and N$17.59 respectively. At the margin, therefore, given the level of attacks experienced from each animal type during the previous year, households were most concerned about deterring an attack from an additional predator. This makes sense, since there are relatively few predators and they tend to attack as individuals or in small groups, yet are capable of destroying a Caprivi farm household's most valuable asset – its cattle. In fact, surveyed households reported that the average price for a head of cattle sold during the previous year was N$627, which is quite a bit more than the WTP to deter a predator attack.Footnote 13 It is also possible that there is a higher psychological fear of predators. The average household appears to place substantially less value on deterring the attack of an additional elephant. Table 3 also shows the WTP to deter an attack as a share of the household's total income. Since these measures reflect the cost of only one animal attacking one time, the shares of mean income are generally low. However, the WTP to deter a single predator attack equals over 2 per cent of mean annual income.
Marginal effects on household WTP money and maize of one animal deterred and mean income share, by animal type

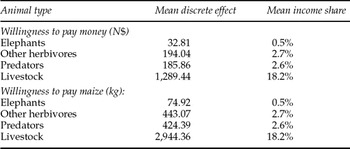
Table 4 provides estimates of the annual household WTP in money and in maize for a 100 per cent reduction in each type of animal attack, holding constant the levels of the other three types of animal attack. These estimates show the total estimated annual cost of damage incurred from each of the four animal types. That is, while table 3 provides information on households' WTP for a marginal reduction in attacks, table 4 shows the more relevant information for policy-making, which is the estimated effect on WTP of eliminating animal attacks.
Discrete effects on annual household WTP money and maize of a 100% reduction in one type of animal attack and mean income share

The relative importance of each type of animal changes when its total, rather than its marginal effect, is considered. Strikingly, the mean WTP money for a 100 per cent reduction in livestock attacks, at N$1,289.44 or 2,944.36 kg of maize per year, is much higher than for any of the other animal types, largely because of their high frequency of occurrence. Other wild herbivores have the second highest mean total effect at N$194.04, while predators are third at N$185.86. The mean WTP for a 100 per cent reduction in elephant attacks is again lowest, at N$32.81. The WTP for complete elimination of all animal attacks is 24 per cent of annual household income, with wildlife accounting for 6 per cent and livestock attacks for 18 per cent. The 6 per cent figure is an estimate of the cost borne by villagers from living with wildlife and thus provides a quantitative dimension to the anecdotal evidence supplied by villagers in discussions and interviews.
9. Conclusions
This paper presents estimates of the costs of living with wildlife suffered by African smallholder farmers. These Namibian farmers inhabit a region in which significant numbers of wildlife are present and desired for a tourism-based economy, but at the same time the wildlife is often feared for the damage it can cause. Our cost estimates are obtained by using contingent valuation stated preference methodology. Compared to past approaches to measuring wildlife damage costs, this approach offers a theoretically more rigorous estimate, while being relatively simple and fast to implement. Ours is the first study to use contingent valuation methods to accurately measure the costs to local communities of living with wildlife. It also presents the first use of a utility-theoretic approach to joint estimation of a household's WTP for a non-market good or government program in both cash and a non-monetary numeraire good, along with the shadow value for the non-monetary numeraire.
The WTP measures are Hicksian compensating variation measures of farmers' welfare that encompass the major costs to farmers of living with wildlife, including the opportunity costs of changes in production practices caused by the threat of animal attacks. These latter costs have not been captured when damages have been measured using traditional ‘physical’ damage measurements. As the results are obtained using representative households for this area, they can be used to estimate the total cost of wildlife damage for the area and, as a reasonable approximation, for the entire region. The joint WTP-shadow value approach could be used to value nearly any non-market good or public program.
The empirical results demonstrate that rural Caprivi farmers incur significant costs from living with elephants and other types of wildlife. The marginal WTP measures reveal that households are most concerned about preventing individual attacks by predators, and then by herbivores other than elephants, though anecdotally elephants are often cited as the greatest problem. It is possible that undue attention is given to the damages caused by the awe-inspiring elephant relative to those caused by other less obvious herbivores or predators. Other studies have focused on communities where elephant damage is acute. Because our sample was randomly selected, it includes communities farther from elephant habitat. Since smaller wildlife species are often widely dispersed, they could still cause damage to households in those communities.
However, we also have to allow for the possibility that farmers may have systematically undervalued the costs of living with elephants. Although our survey involved a good that should have been known to local farmers, respondents (though they did not so indicate) may have been skeptical about the efficacy of the electric fences in deterring elephants, given the animal's great intelligence, strength, and determination, even if the fences would have worked well against other wildlife and cattle. If so, their WTP to protect their crops against elephant attacks would be smaller. This issue is always a concern in WTP, since the respondent must believe that he/she will receive precisely what is being offered. It is of particular concern in developing countries, where respondents may not be accustomed to ‘assuming’ the qualities of a hypothetical good. If the offer is perceived to be infeasible, the respondent may discount the good or service relative to what it would be worth if it truly worked. It is also possible that farmers consider the deterrent methods that they are currently using – such as beating drums, building brush fences, tying lines with bells or other objects around fields – have some effect. However, in survey questions on this subject, only 58 per cent of respondents reported that their traditional methods were effective.Footnote 14
The discrete WTP results also indicate that livestock generate high total costs to farmers by eating their crops. In most studies of wildlife damage, there is no mention of livestock damages. We included livestock in the analysis in recognition that fences would protect crops from marauding livestock as well as from wildlife. Had we not done so, the results would have been seriously biased. It is not clear how widespread in Africa this problem with livestock damage to crops is, but in the Caprivi Region the lack of property rights enforcement appears to be an important cause of economic loss.
Several policy implications can be drawn from this analysis. First, Caprivi farm households incur significant costs from wildlife attacks, while research has shown that they receive few benefits from the presence of wildlife (Sutton, Reference Sutton2001). In contrast, since wildlife is the main tourist attraction in Namibia, the tourism industry – including tour operators, lodges, restaurants, and car rental companies – and the government (tax revenues) gains greatly. For reasons of efficiency and equity, mechanisms should be developed to compensate Caprivi farmers for damages incurred from wildlife.Footnote 15 Without such mechanisms, incentives are distorted since Caprivi farmers have motivation to kill wildlife and convert wildlife habitat, rather than preserve them, even though both are of national and global value. Similarly, income distribution is worsened. Farmers – who are predominantly poor, black, and rural – bear the costs of living with wildlife, while others – who are predominantly white, urban, and often foreign – gain the benefits.
Because wildlife contribute public as well as private benefits, funds for compensation could come from government, including the Namibian Government's Game Products Trust Fund, which generates money from the sale of stockpiled ivory and other wildlife products, as well as from the tourism industry and from national and international conservation organizations. The Game Products Trust Fund is allowed to fund community-level investments, but not to pay compensation to individual farmers (Barnard, Reference Barnard2002). Further work is warranted to evaluate policies such as the establishment of community wildlife conservancies that may provide direct benefits to villagers (e.g., Barnes et al., Reference Barnes, MacGregor and Weaver2001), and to determine how their scope and effectiveness may be increased. Given the WTP estimates generated here, it is unlikely that most Caprivi households could justify an electric fence, whose unsubsidized cost is about N$8.60/m (Pricewaterhouse, 1998), or a minimum of about N$11,042 for the average farm in the sample.Footnote 16 However, they have been shown to be effective against wildlife in trials, and a subsidy could be warranted on the grounds stated above.
Second, the results point to the importance of controlling livestock – i.e., reducing livestock crop damage – to improve the welfare of rural Caprivians. An important step in controlling livestock would be to develop well-defined property rights regarding where livestock can graze and who is responsible for damages caused when livestock graze elsewhere (Jarvis, Reference Jarvis1984). Barbed-wire fencing of crops is more economical than electric and is effective against livestock, but it may not be as broadly effective against wildlife and might be damaged by elephants. Third, to reduce the costs of wildlife attacks at the margin, priority should be given to developing methods to deter predator attacks. Farmers' responses indicate that individual predator attacks are costly, whether this is from damage to livestock or psychological costs to humans.
The damages from wildlife–human interactions estimated in this study are moderate relative to average farmer incomes (though not necessarily to the incomes of individual farmers who are attack victims). The damages are very small relative to the values that wildlife generates for Namibia and the world. Thus, our results call attention to the need to manage wildlife in a manner that optimizes social utility by maximizing benefits, while at the same time reducing damages and rectifying inappropriate societal transfers. Over time, this issue will become increasingly important. There is vast potential for development of wildlife tourism in this region of Namibia, particularly as it provides a link for tourists seeking a variety of wildlife experiences such as those available in other parts of Namibia as well as in Botswana, Zimbabwe, and South Africa. However, as Namibia develops economically, farming in this region should become increasingly intensive. Any agricultural development will result in significantly larger wildlife–human interactions of the type studied here. There is clearly need for additional study of how best to manage wildlife, but increased payments to farmers and residents in the region are an important place to begin.