
I. INTRODUCTION
In the early 1970’s, emerging ceramic fiber–matrix composite (CFMC) technologies received significant attention due to their unique mechanical characteristics. Reference Phillips1–Reference Sambell, Briggs, Phillips and Bowen5 The initial work was driven by the need for high performance materials in jet and rocket engines, where high temperature properties, high specific strength, and mechanical reliability and predictability are required. While CFMC research and development for aircraft applications continue today, advancement of these composites also led to new applications in the nuclear industry and for microwave absorption shielding. Reference Yin, Cheng, Zhang, Travitzky and Greil6–Reference Katoh, Snead, Szlufarska and Weber11 These materials show great promise for use in extreme environments, yet challenges remain that require further research and understanding of CFMC failure mechanisms.
The atomic bonding structure of ceramic materials can provide valuable high temperature (>800 °C) properties including strength, creep resistance, and a variety of unique electrical and optical properties. However, due to the same underlying physics, monolithic ceramics exhibit little to no dislocation movement at relatively low temperatures and are therefore inherently brittle. Ceramic fracture of ceramics is a function of flaw size and fracture toughness, characteristics that can vary widely depending on the manufacturing and microstructure of the component. Reference Hertzberg, Vinci and Hertzberg12,Reference Carter and Norton13 Weibull statistics quantify these properties and govern the predictability of bulk failure. Without plastic deformation and, therefore, strain energy absorption at the crack tip, unstable crack propagation will proceed at characteristically low values of critical stress (and corresponding low critical fracture toughness), resulting in a catastrophic failure that is statistically difficult to predict. Traditionally, this has isolated ceramics to niche applications where tensile and bending stresses are avoided. However, CFMCs have opened the doors to variable load-bearing applications through unique toughening mechanisms. On the microscale, brittle failure is tied to the intrinsic fracture toughness of the material and it is unavoidable. Reference Evans and Zok14 However, due to crack deflection toughening mechanisms, strain on the bulk scale is observed to be nonlinear with respect to the applied stress. This behavior is described as pseudo-ductility and accounts for the improved predictability and graceful failure of CFMCs.
A wide variety of ceramics have been studied for use in both fiber and matrix form including alumina, lithium-silicate glasses, and nonoxides such as silicon carbide (SiC). Of these, SiC has emerged as the leading engineering material for extreme environment applications. It has proven particularly useful for high temperature applications where it exhibits exceptional strength, creep resistance, chemical stability, and low coefficient of thermal expansion. Reference Katoh, Snead, Henager, Nozawa, Hinoki, Iveković, Novak and Gonzalez De Vicente15–Reference Hinoki, Lara-Curzio and Snead19 Studies have also shown that SiC has excellent neutronic properties including low thermal neutron capture cross section, low tritium permeability, and high radiation tolerance. Reference Katoh, Snead, Henager, Nozawa, Hinoki, Iveković, Novak and Gonzalez De Vicente15,Reference Nozawa, Katoh and Snead20,Reference Katoh, Ozawa, Shih, Nozawa, Shinavski, Hasegawa and Snead21 As a result, SiCf/SiCm composites are being considered for application as accident tolerant fuel cladding Reference Zinkle, Terrani, Gehin, Ott and Snead22 as well as structural components for high temperature fission and fusion reactors. This article describes the physics and toughening mechanisms of CFMCs and how they relate to SiC/SiC composite development in the context of the nuclear industry. Specific attention is paid to the influence of pyrolytic carbon (PyC) interfaces on composite toughening and to the methods for identifying and extracting the governing interface properties. By reviewing specific material data as well as the testing methods used to extract fundamental properties, gaps in the existing knowledge base will be identified. Although focused on SiC/SiC, this review also provides insight into key parameters and experimental property extraction techniques for all CFMCs with a range of fiber, interphase, and matrix compositions.
A. Interfaces and interface design
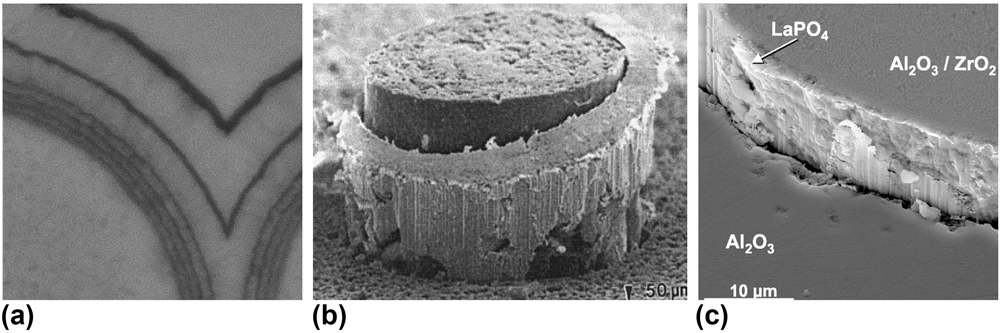
Many of the fracture characteristics of CFMCs are heavily dependent on the interface between the fiber and matrix. The interface is a thin coating layer (∼0.05–1 μm) deposited on the fiber surface that can be engineered as a single layer or an alternating sequence of coating and matrix. This layer or layering is often referred to as the fiber–matrix interphase. The interphase is commonly deposited via chemical vapor deposition/infiltration (CVD/CVI) to promote matrix crack deflection and fiber pull-out during mechanical loading. Figure 1 shows examples of the varying geometric and material forms of different interface coatings.
(a) SiC/PyC/SiC with alternating PyC–SiC interlayer architecture including varying thickness and spacing, reproduced with permission from Ref. Reference Katoh, Ozawa, Shih, Nozawa, Shinavski, Hasegawa and Snead21. Copyright 2014 Elsevier. (b) Deformation and debonding of a ductile platinum coating in the Al2O3/Al2O3 composite. (c) LaPO4 coating on alumina reinforced with the alumina fiber composite. Images (b) and (c) are reproduced with permission from Ref. Reference Kerans and Hay23. Copyright 2002 John Wiley and Sons.

An optimal interface exhibits a balance of low toughness, to promote crack deflection, and resistance to sliding to increase energy absorption during fiber pull-out. Details of deflection criteria and related interface properties are discussed further below. However, it is important to acknowledge the variety of interface designs that have been considered in the past and why PyC is of interest with respect to SiC composites in the nuclear industry. The design of an interphase is characterized by the deposited material and deposition sequencing geometry (i.e., spacing, thickness, density, and layer schedule). Metals, oxides, and materials with low-energy slip plane crystal structures have been proposed to optimize energy absorption and crack deflection. Fugitive interfaces, Reference Kerans and Hay23,Reference Keller, Mah, Parthasarathy and Cooke24 where a physical gap is created by coating removal after matrix infiltration, have also exhibited reasonable mechanical properties and toughening characteristics. However, this design can allow environmental degradation of the exposed fiber and introduce challenges for components requiring hermeticity, which is important for nuclear fuel cladding. Metallic coatings [Fig. 1(b)] have shown promise with crack deflection and energy absorption through unique ductile phenomena. However, manufacturing challenges with matrix densification and limits on operational temperature have hindered the advances of these designs. Reference Kerans and Hay23,Reference Wendorff, Janssen and Claussen25 Additionally, many metals have neutron interactions such as transmutation and capture that are undesirable in nuclear applications. Oxide interfaces, inherently oxidation resistant, were introduced following observation of environmental degradation of nonoxide interfaces under aerospace engine component conditions. Reference Kerans and Hay23,Reference Filipuzzi, Camus and Naslain26–Reference Parthasarathy, Folsom and Zawada29 Some of the proposed oxides, such as phyllosilicate micas and hexaluminates, exhibit layered crystal structures with low-energy slip planes, similar to those of aromatic stacking observed in graphite-like carbon and boron nitride (BN). Other designs exploit isotropic oxides that have inherently weak bonding at the fiber/coating interface such as monazite (LaPO4), where fracture occurs at the interface as opposed to within the coating. With regard to chemical stability, oxide interfaces are generally most compatible with oxide/glass fibers and matrices. However, introducing an oxide coating to nonoxide (SiC) composites may limit application to low temperatures to avoid thermodynamically driven oxidation of the fiber. This phenomenon weakens the fiber and increases the fiber/coating interface strength, ultimately reducing toughness. Reference Kerans and Hay23
For SiCf/SiCm, most interface studies have focused on nonoxide graphite-like material; PyC and hex-BN. The established deposition processes and extensive bulk and microtesting make these coatings more desirable from the view of product maturity and industry implementation. Reference Katoh, Ozawa, Shih, Nozawa, Shinavski, Hasegawa and Snead21,Reference Naslain and Langlais30–Reference Lamon32 Characteristic properties, including high temperature stability, SiC chemical compatibility, and desirable fracture properties (enhanced by anisotropy), have popularized the fabrication and analysis of these interfaces. Reference Katoh, Ozawa, Shih, Nozawa, Shinavski, Hasegawa and Snead21,Reference Khalifa, Deck, Gutierrez, Jacobsen and Back33–Reference Naslain, Pailler and Lamon36 BN has been shown to exhibit worse oxidation resistance at elevated temperatures in aqueous environments. Reference Morscher, Bryant and Tressler37,Reference Cofer and Economy38 Additionally, boron-10 (20% naturally occurring) has a neutron capture cross section approximately two orders of magnitude larger than carbon-12 (CENDL-3.1 nuclear cross-section database), causing the interface to act as a neutron poison and reduce thermal fission and reactor efficiency. Finally, it has been discussed that boron impurities in SiC can lead to reduced radiation tolerance and mechanical strength. Reference Newsome, Snead, Hinoki, Katoh and Peters39 As a result, PyC has emerged as the premier contender in the nuclear industry.
B. Physics of CFMC toughening
CFMCs are composed of three constituents; the matrix, fiber, and interphase. Each plays a critical role in the composites’ ability to absorb strain energy and combined serve as a reliable load bearing material. In general, the linear elastic properties of these composites are derived from the corresponding properties of the fiber and matrix. However, at the onset of matrix cracking in a CFMC, nonlinear stress–strain behavior (pseudo-ductility) is observed due to flaw distribution and composite load-sharing characteristics such as fiber volume fraction and elastic debond properties. Reference Evans and Zok14 Microcracks will propagate until they encounter the fiber/matrix interphase. At the crack tip, local strain fields interact with the interphase and fiber, where the elastic and fracture properties of the interface govern the evolution and propagation of the crack. Reference Yin, Cheng, Zhang, Travitzky and Greil6,Reference Evans and Zok14,Reference Lamon and Bansal40,Reference Xia and Li41
At the instance of crack tip impingement on the interphase zone, the He–Hutchinson (HH) criterion is commonly used to describe the fundamental phenomenon governing how the crack tip will progress, either through the fiber (low toughness composite) or along the axis of the fiber at the interface (high toughness composite). This criterion is built on an integral evaluation of the plane strain problem between dissimilar materials as outlined by He. Reference He and Hutchinson42 This evaluation considers the fracture energy release rate, Γ (J/m2), required by the interface and fiber to cause crack deflection, as a function of Dundurs’ elastic mismatch parameters, α and β Reference Dundurs43 ; β is frequently assumed to be 0 in an effort to reduce complexity, and α is interpreted as the material mismatch of the plane strain tensile modulus (E′):
 $$\alpha = {{E_1^\prime - E_2^\prime } \over {E_1^\prime + E_2^\prime }}\quad ,$$
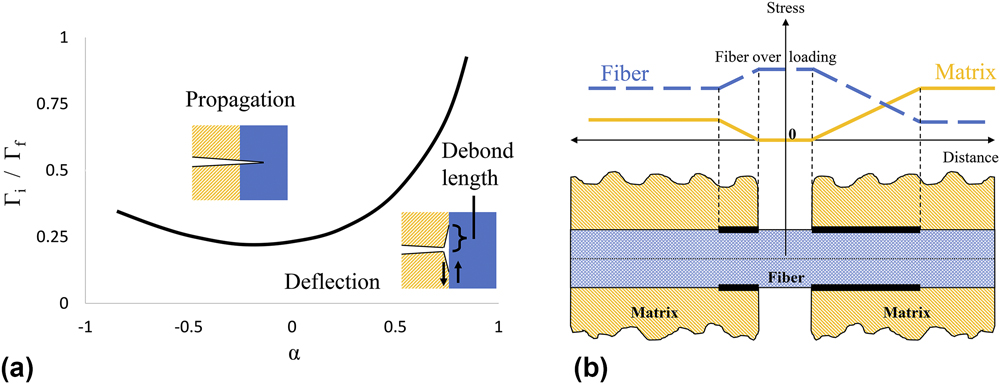
where E′ = E/(1 + ν2), subscripts 1 and 2 refer to the interfacing fiber and matrix materials, and E and ν are the Young’s modulus and Poisson’s ratio, respectively, for each phase. Ultimately, there exists a critical ratio of the mode I fracture energy release rates between the interface and fiber, Γi and Γf, respectively, which determines if the impinging crack will propagate along the fiber or through the fiber. The fracture energy release rate is an intrinsic material property described by an energy balance between strain and surface energy at the fracture plane. For brittle materials, this property can be evaluated using a J-integral approach that characterizes the elastic energy released during fracture, per unit surface area created. Experimentally, this property is obtained by dividing the area under a load versus the displacement curve by the area of the two generated fracture surfaces. Figure 2(a) is a graphical interpretation of the HH criterion that generates a threshold curve to denote the crack propagation versus the crack deflection regimes, as a function of the elastic (α) and fracture (Γ) properties of the respective materials.
(a) Graphical representation of the HH criterion. A representative debond length due to mode II shear is pointed on the deflection zone schematic. (b) Schematic displaying the load sharing characteristics between the fiber and matrix on a bridged microcrack as a function of debond length, modified and reproduced with permission from Ref. Reference Lamon and Bansal40. Copyright 2015 John Wiley and Sons.

This evaluation has major implications with respect to modeling and interface design. For a composite system with similar elastic properties between the fiber and matrix (α → 0) such as SiC/SiC, the criterion requires
 $${\Gamma _{\rm{i}}} \le 0.25{\Gamma _{\rm{f}}}\quad$$
to achieve deflection. Typically, ceramic fibers have a fracture energy of Γf ∼ 20 J/m2, suggesting that Γi should be smaller than 5 J/m2 to achieve deflection. Reference Evans and Zok14 Additionally, a common takeaway from this criterion is that increasing the relative modulus of the fiber will shift the α parameter to positive values and increase the allowable deflection ratio Γi/Γf. For composite design, this suggests that implementation of highly stoichiometric and stiff fibers will improve toughness. Together, this formula suggests that a tough composite, one that exhibits significant crack deflection and fiber pull-out, would be achieved through implementation of a stiff fiber matched with a weak, low toughness interface. The criterion discussed here is simplified, while further evaluations have looked at deflection sensitivity to the mismatch parameter β, the phase angle and fracture mode mixity at the impinging crack tip and interface anisotropy. Reference Kerans and Hay23,Reference Ahn44–Reference Fleck48 These considerations have shown influence on the characteristics of doubly deflected cracking and allowable HH criterion ratio limits. Continued refinement of these physics models matched with experimental validation of the intrinsic material properties will be key to model development, fidelity, and composite predictability.
Once the crack has deflected, the propagation and debond length along the fiber are governed by intrinsic shear strength properties of the interface under mode II fracture. Reference Evans and Zok14,Reference Kerans and Hay23,Reference Isaksson and Stahle49 In the context of thin interfaces, mode II crack propagation is expected to evolve in the form of secondary cracking and/or echelon cracking. Both phenomena are dependent on flaw distribution and the local stress state of the interface. Reference Isaksson and Stahle49–Reference Blackman51 Details concerning the application and assumptions associated with mode II failure are outlined clearly by Cedric and Xia. Reference Xia and Li41,Reference Cedric and Hutchinson50 Cedric’s analysis derived the following relationship for the fracture energy of mode II as it relates to mode I:
 $${\Gamma _{{\rm{II}}}} = \left( {3.1\;{\rm{to}}\;4.2} \right) \times {\Gamma _{\rm{I}}}\quad .$$
This relationship is applied to experimental property extraction for ΓI and discussed further below.
An important parameter directly related to the mode II shear strength is the effective debond length along the fiber from the impinging microcrack, briefly expressed in Fig. 2(a). This debond length contributes to the macroscale composite toughness and ultimate strength by defining microcrack density and frictional pull-out resistance. Adjusting the interface properties to tailor the debond length plays a critical role in composite optimization and performance. Short debond lengths, characteristic of a stronger interface, lead to high strength and high toughness composite via matrix load sharing and increased microcrack density, respectively. However, if too short, the localized stress of the crack tip is not dissipated and the fiber will fracture in plane with the impinging crack, reducing toughness and composite reliability. Long debond lengths, characteristic of a weaker interface, provide enhanced toughening through extended fiber pull-out but at the expense of reduced fiber/matrix load sharing thereby reducing the proportional limit of the composite. For most applications, it is generally accepted that there is an optimal debond length that allows for evenly distributed load sharing by the fiber and matrix. Reference Evans and Zok14,Reference Lamon and Bansal40 In this state, energy dissipation parameters such as microcracking density and fiber pull-out length are optimized without overcompensation, allowing for balanced macroscopic strength, toughness, and predictability. Figure 2(b) shows a qualitative interpretation for fiber/matrix load sharing as a function of debond length. Reference Lamon and Bansal40 An ideal case may occur when the debond length matches the fiber/matrix stress intersection, where the stress is shared equally outside of the debonded region. However, the fiber/matrix stress intersection is expected to shift depending on the elastic property ratios of the fiber versus the matrix, the frictional sliding resistance of the debonded interface, and extrinsic parameters such as residual clamping stress. Thereby, the optimized debond length will vary for different composite compositions and fabrication parameters. Ultimately, increased loading and/or encounter of a defect at the debond length provides a local stress state large enough to cause fiber fracture. At this point, energy absorption is governed by shear strength properties of the debonded interface during fiber pull out.
As always, optimization is dependent on the application and it is important to understand the intrinsic and extrinsic parameters that influence the interface. These parameters include extrinsic influences such as fiber roughness (fabrication dependent), residual clamping stress (N R, dependent on constituent thermo-elastic properties and fabrication temperature), and interphase thickness. Increased fiber roughness and residual clamping stress would increase the internal friction coefficient, thereby reducing debond length and making the composite more brittle. Intrinsic properties include anisotropy, fracture energy release rate, debonding shear strength, and internal (bonded) and dynamic (debonded) friction coefficients. Reference Evans and Zok14,Reference Lamon and Bansal40,Reference Fleck48,Reference Handin52 Many of these properties and parameters are interdependent. Without fundamental quantification of the intrinsic and extrinsic properties with respect to one another as well as verification of resulting deflection and propagation length, it becomes difficult to create a comprehensive model that incorporates the appropriate assumptions to predict composite failure at a fundamental level. This discussion on composite toughening mechanisms and the associated physics models as they relate to bulk composite behavior has been extensively analyzed, and more detailed discussion can be found from Hutchinson (1994 Reference He, Anthony and Hutchinson53 ), Evans (1994 Reference Evans and Zok14 ), Kerans (2002 Reference Kerans and Hay23 ), Naslain (2010 Reference Naslain, Pailler and Lamon36 ), Xia (2012 Reference Xia and Li41 ), Lamon (2015 Reference Lamon and Bansal40 ), Yin (2016 Reference Yin, Cheng, Zhang, Travitzky and Greil6 ), and Braginsky (2016 Reference Braginsky and Przybyla45 ).
C. Interface properties and property extraction
From the above discussion, it is reasonable to summarize CFMC toughening into three primary stages of interface-dependent mechanisms:
-
(i) matrix microcrack evolution and crack deflection at the interphase,
-
(ii) crack propagation along the fiber, and
-
(iii) fiber failure and pull-out.
Accordingly, the governing interface properties associated with each stage are
-
(i) the mode I fracture energy release rate, ΓI, as it relates to the HH criterion ratio,
-
(ii) the interface debond shear strength (τdebond) and internal friction coefficient (μi), and
-
(iii) the frictional sliding stress (τsliding), as a function of the dynamic friction (μ).
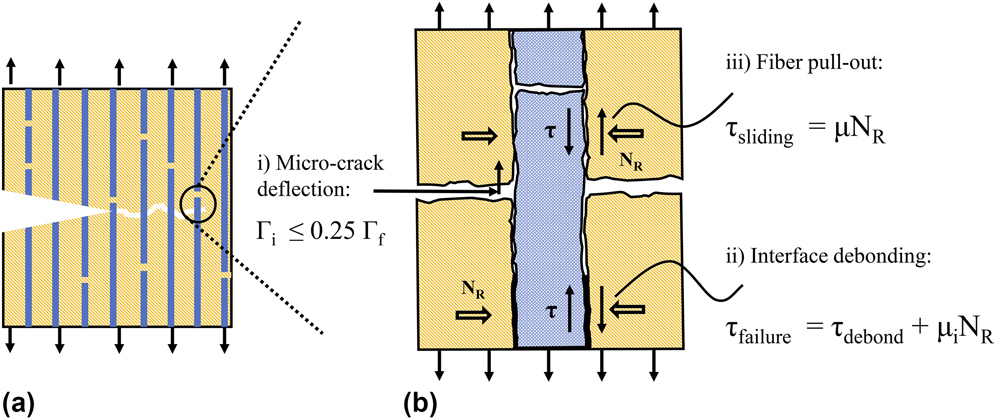
Figure 3 is a schematic that illustrates the contributing properties as they relate to the respective toughening mechanisms in a strained composite. Generally, stages i, ii, and iii occur in succession; however, this schematic represents all stages in a single frame.
(a) Crack propagation occurring around a notch defect, where pull-out traction redistributes the stress. (b) Three stages related to CFMC toughening and the governing interface properties; (i) Γi, (ii) τdebond and μi, and (iii) τsliding and μ. Extrinsic influences such as fiber surface roughness, interface thickness, and residual clamping stress (N R) are illustrated. Inspired by and adapted from Evans and Lamon and reproduced with permission from Ref. Reference Evans and Zok14. Copyright 1994 Springer and Ref. Reference Lamon and Bansal40. Copyright 2015 John Wiley and Sons.

Experimental extraction of each property is critically important for the validation of governing physics models as well as for component simulation via finite element models. Accurately identifying property values that are the representative of the interface as it exists within the composite has posed significant challenges. The first challenge is simply length scale. Fiber coatings can be on the order of tens to hundreds of nanometers, making even standard small scale testing techniques such as nanoindentation a difficult task. Additionally, complex geometries associated with fiber weave, fiber diameter, and fabrication processes can complicate and influence the repeatability and data analysis required for property extraction. To date, several test methods and data analysis techniques have been developed to probe the interface while attempting to adjust for these challenges. The most common and direct technique is fiber push-out and push-in testing. Other techniques include scaling of bulk monolithic properties as well as indirect extraction techniques such as cyclic tensile testing and fracture characterization. The latter requires interpretation and deconvolution of loading/unloading hysteresis loops, saturation microcrack spacing, matrix cracking stress, permanent strain, and residual crack opening. Reference Evans and Zok14,Reference Lamon and Bansal40,Reference Ozawa, Hinoki, Nozawa, Katoh, Maki, Kondo, Ikeda and Kohyama54 Both push-out testing and indirect extraction techniques exhibit a wide range of complexities.
The intent of this paper is to illuminate some of the complexities associated with fiber push-out testing and present micropillar compression as a way to reduce complexity and increase fidelity in direct property extraction. With regard to SiC/PyC/SiC composites, this paper looks comprehensively at the governing interface properties, methods of extraction, and how small-scale mechanical testing (SSMT) may improve our understanding of the contributing phenomena.
1. Fiber push-out testing
The fiber push-out test is a well-documented testing method across the composite literature, allowing direct measurement of the interfacial strength and sometimes friction between the fiber and matrix after debonding. Reference Hsueh, Rebillat, Lamon and Lara-Curzio55 At first guise, the process for property extraction is quite simple. First, prepare a thin sample with fibers moving through the matrix orthogonal to the polished surface, then use a micro/nano-indentation instrument to apply force to the end of the fiber, and record the load required to debond and slide the fiber. Finally, divide through by the fiber surface area to extract the respective debond and sliding shear stresses.
If a normal stress at the fiber surface is known, then the friction coefficients associated with debond and sliding can be resolved. However, both the experimental execution and physics models for property extraction impose complexities that have led to data scatter and potential for property misrepresentation. During testing, it is observed that steady state debonding occurs along the interface until the applied force causes instantaneous failure across the remaining bonded length. A visual representation of this phenomenon can be found in Fig. 2 of Rebillat’s work. Reference Rebillat, Lamon, Naslain, Lara-Curzio, Ferber and Besmann56 Not only has the prediction of the steady state debond length proven difficult, but also there are many factors that affect the debonding phenomena. Reference Lamon and Bansal40,Reference Xia and Li41,Reference Rebillat, Lamon, Naslain, Lara-Curzio, Ferber and Besmann56–Reference Shetty58 The most prominent factors are the Poisson and roughness effects along the length of the fiber. Rigorous shear lag analyses carried out by Shetty, Lawrence, and Hsueh Reference Hsueh, Rebillat, Lamon and Lara-Curzio55,Reference Hsueh57,Reference Shetty58,Reference Lawrence59 have laid the foundation for understanding these effects and have established appropriate elastic models to describe the local stress states. The analyses describe how Poisson and roughness characteristics give rise to variable axial force along the length of the fiber, resulting in large shear and normal stresses near the point of indentation. Relatively complex analytical solutions to the applied elastic model were developed for effective property extraction. Although theoretically sound, simplifying assumptions were indeed placed, Reference Hsueh57 experimental data scatter has been consistently observed (see compiled data in the discussion), limiting confidence in the extracted properties.
Beyond the complexities in data deconvolution, experimental execution of push-out testing presents its own set of difficulties and limitations. For example, while large fibers of >100 µm diameter may be easily tested using a universal testing machine and a flat punch, the accuracy of alignment needed for the typical fiber diameter of <10 µm in SiC/SiC composites is only achievable using micromechanical testing methods such as nanoindentation and precise positioning stages. As noted in the work of Rebillat et al. Reference Rebillat, Lamon and Guette60 and Mueller et al., Reference Mueller, Moosburger-Will, Sause and Horn61 this leads to difficulties in producing and handling very thin sections of composites suitable for push-out testing, where the final thickness must be accurately known and consistently achieved. An additional difficulty is that the physics models assume that fibers are orientated perpendicular to the polished surface without subsurface deflection. In practice, this may be difficult to verify and care must be taken that fibers oriented at oblique angles are not considered. In addition, the presence and variation of defects along the interphase may contribute significantly to the scattering of the results as described in detail below.
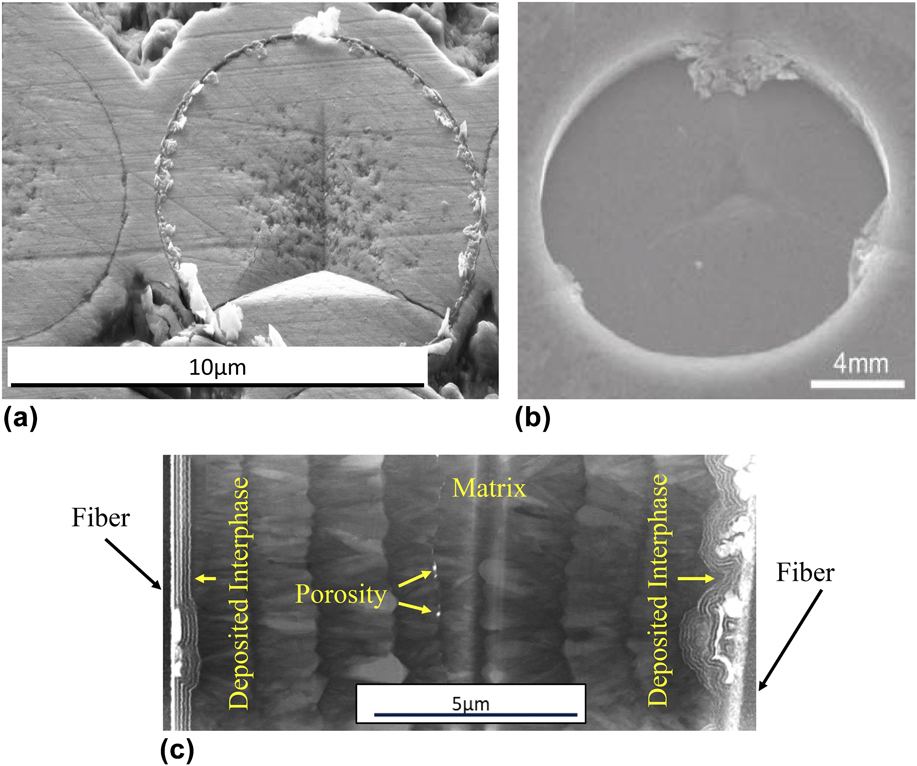
A related consideration is that the type of the indenter tip used to perform the test can have a significant influence on the obtained results. Berkovich indenter tips (relatively large angle pyramidal tips) are a common type used in indentation experiments, Reference Katoh, Ozawa, Shih, Nozawa, Shinavski, Hasegawa and Snead21 but there are several disadvantages to this approach for push-out tests. First, the tip causes deformation and penetrates the fiber before pushing it out which must be accounted for during analysis, adding uncertainty. Second, due to the high stress field under the tip, fracture of the fiber can occur before interface debonding and cause wedging effects in the fiber channel, and this can be seen in Fig. 4(a). Third, due to the low aspect ratio of such tip geometry, only a small push-out depth can be obtained before deformation of the surrounding matrix occurs. Damage to the surrounding matrix after full displacement [Fig. 4(b)] will impact push-back tests that aim to extract the debonded frictional properties by pushing the debonded fiber (of the original push-out test) back into the matrix from the backside of the sample. As such, it is generally perceived that a flat punch-type indenter is preferable to reduce material impression and potential wedging. However, this comes with its own disadvantages. As seen in the work of Mueller et al., Reference Mueller, Moosburger-Will, Sause and Horn61 if either the flat punch or sample is not perfectly flat, a true flat contact will not be made and result in similar bedding effects to that of a sharp indenter discussed above. Second, the calibration required to assure a perfect microscope to indenter alignment is more challenging. This can result in inaccurate placement of the indentation as seen in Fig. 4(a), as well as slower throughput and testing yield.
(a) Cracking of fiber before push-out and observation of indenter tip misalignment. (b) Indenter tip interference with the matrix material limiting push-out displacement and impacting push-back testing. Reproduced with permission from Ref. Reference Katoh, Ozawa, Shih, Nozawa, Shinavski, Hasegawa and Snead21. Copyright 2014 Elsevier. (c) Transmission electron micrograph of two fibers 15 µm apart from each other embedded in the same matrix. It can be seen that the interphase has different structures that are likely to cause difficulties without push-out testing and data interpretation.

A final consideration when interpreting fiber push-out data is the effect that the local microstructure can have on the measured results. Meuller et al. Reference Mueller, Moosburger-Will, Sause and Horn61 found that the number of fibers surrounding the pushed fiber could have a significant effect on the measured interfacial shear stress. Furthermore, because the fiber is fully imbedded in the matrix, characterizing defects such as voids, contamination, and nonuniform interphase deposition are extremely difficult. Figure 4(c) is a scanning transmission electron microscopy image of a thin foil that contains the interphase of two separate fibers (far left and far right). The fibers, imbedded less than 15 μm apart in the matrix, exhibit significantly different levels of contamination as well as axis alignment.
Future work is required to investigate the implications of these characteristics and develop a microstructurally informed model. SSMT is a potential solution to address these challenges associated with experimental execution, interface characterization, and complex shear lag analyses. A variety of SSMT techniques to extract useful material properties have been applied successfully to brittle ceramics and interfaces. Reference Shin, Jin, Kim and Park62–Reference Hosemann67 However, only recently have researchers applied SSMT to characterize CFMC interface properties. Shih et al. were the first to apply micropillar compression to SiC/PyC/SiC composites in 2013. Reference Shih, Katoh, Leonard, Bei and Lara-Curzio68 This paper as well as the work of Kabel et al. Reference Kabel, Yang, Balooch, Howard, Koyanagi, Terrani, Katoh and Hosemann69 build on Shih’s preliminary efforts by advancing the test methods and property analysis. Major refinements include increasing the number of tested pillars, extending the range of interface inclines, and in situ SEM compression for improved confidence in test validity. Technology improvements have also made examination of the interface fracture surface significantly easier, allowing the heterogeneity of the matrix and interface to be quantified and accounted for. The mechanics and capabilities of interface-containing micropillars are described below.
2. Micropillar compression
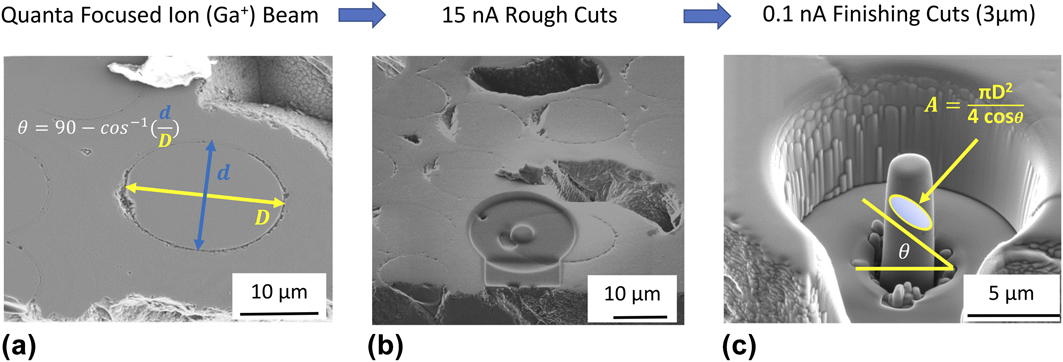
The micropillar structure, shown in Fig. 5(a), contains the fiber, interphase, and matrix. Micropillars are on the order of 3 μm in diameter (D), allowing for selective probing that reduces complexities associated with interface characterization. The pillars are assumed pristine such that the interface is fully bonded prior to compression testing. As a result, the extracted properties at failure are a characteristic of mode II shearing associated with stage ii toughening. Unfortunately, due to the length scale and instrument loading characteristics, it is common for the pillar to be destroyed following instantaneous debond, making the extraction of stage iii interface properties difficult. Because failure is brittle, it is assumed that the applied elastic strain energy is released entirely via the surface area created during fracture of the interface. Thereby, the fracture energy release rate can be obtained via Eq. (3) to provide a unique insight into the stage i toughening criterion, where fiber push-out testing falls short.
(a) Representative schematic of pillar fabrication, adapted and reproduced with permission from Ref. Reference Kabel, Yang, Balooch, Howard, Koyanagi, Terrani, Katoh and Hosemann69. Copyright 2017 Elsevier. (b) Stress state and force balance of a representative microcompression structure. (c) STEM image of the HNLS fiber and interphase with alternating PyC (light) and SiC layers (dark).

To understand the governing debond properties of the PyC interface, the Mohr–Coulomb fracture criterion (MC) is applied. Reference Handin52,Reference Shih, Katoh, Leonard, Bei and Lara-Curzio68,Reference Kabel, Yang, Balooch, Howard, Koyanagi, Terrani, Katoh and Hosemann69 This criterion states that the ultimate shear strength of a brittle ceramic is resisted by two components. The first is the interface debonding shear strength, τdebond, which is a characteristic of the chemical bonding of the material at the plane of fracture. The second is an internal friction resistance described by the coefficient, μi, which is considered to be fundamentally different than the static friction of classical physics. Here, it describes a resistance to debond initiation that is dependent on the tortuosity of the evolving fracture path. The equilibrium relationship between the failure shear strength and the opposing resistances is described by Eq. (4), where the critical shear stress, τfailure, is set to equal the unknown τdebond, and the unknown μi multiplied by the applied normal stress (N R):
 $${\tau _{{\rm{failure}}}} = {\tau _{{\rm{debond}}}} + {N_{\rm{R}}} \times {\mu _{\rm{i}}}\quad .$$
Experimentally, the applied uniaxial stress state can be resolved into the shear and normal stress at the interface plane, as illustrated in Fig. 1 of Kabel’s work. Reference Kabel, Yang, Balooch, Howard, Koyanagi, Terrani, Katoh and Hosemann69
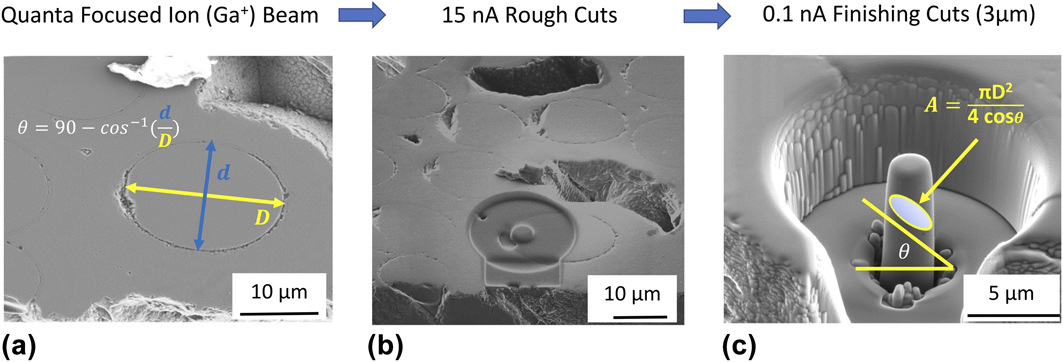
At failure, the resolved stress state is then a function of the applied failure load, P fail, interface incline, θ, and the inclined interface cross-sectional area; A = πD 2/4 × cos(θ). Equation (4) can then be represented in a more useful form for experimental property extraction by Eq. (5):
 $${{{P_{{\rm{fail}}}} \times \sin \theta } \over A} = {\tau _{{\rm{debond}}}} + {{{P_{fail}} \times \cos \theta } \over A} \times {\mu _{\rm{i}}}\quad .$$
By adjusting the interface incline, a unique failure stress state is acquired for each micropillar. When plotted in Mohr’s space (τ versus σ), the linear relationship as described by Eqs. (4) and (5) evolves to allow for the extraction of τdebond and μi as the τ-intercept and slope, respectively. Figure 5(a) shows a schematic and Fig. 5(b) shows a typical ∼3-μm-diameter micropillar with a PyC/SiC multilayer interphase. The corresponding force balance is overlaid to express the stress state of the loaded structure. A more detailed discussion of the mechanics and assumptions behind the MC criterion and micropillar testing including the effect of fiber surface curvature can be found in Ref. Reference Kabel, Yang, Balooch, Howard, Koyanagi, Terrani, Katoh and Hosemann69.
With regard to stage i property evaluation, the mode II fracture energy release rate of the PyC interface can be directly extracted for each micropillar test. This is achieved through application of the work of the fracture criterion that states for a brittle material, and the area under the load versus the displacement curve is equivalent to the work energy that was required to overcome the formation of the new fracture surfaces. Reference Tattersall and Tappin70 Applying Cedric’s relationship between mode II and mode I fracture energy, as described in Eq. (3), allows for the extraction of the stage i governing parameter for interface crack deflection, ΓI, of the interface.
II. EXPERIMENTAL
A. Materials
The composites evaluated in this paper were manufactured by Hypertherm with a CVI β-SiC matrix, 5-layer alternating PyC/SiC interphase, and Hi-Nicalon type S (Nippon Carbon Co., Tokyo, Japan, “HNLS” hereafter) fibers. Reference Anaka, Shibayama, Takeda and Yokoyama71,Reference Ichikawa72 These fibers are nuclear-grade generation III SiC fibers that are characterized by near-stoichiometric chemical composition with low oxygen and free-carbon concentrations as well as high crystallinity. HNLS fibers exhibit grain size (d) ∼10–50 nm and root mean squared surface roughness (r RMS) ∼2.33 nm. Reference Katoh, Ozawa, Shih, Nozawa, Shinavski, Hasegawa and Snead21,Reference Sauder and Lamon73,Reference Sauder, Brusson and Lamon74 PyC was deposited via chemical vapor infiltration at ∼1000 C with varying thicknesses (∼50–1500 nm), and true interface thickness values varied across different fibers. Bulk properties including the modulus and ultimate strength for the HNLS composites evaluated in this study can be found in Katoh’s work. Reference Katoh, Ozawa, Shih, Nozawa, Shinavski, Hasegawa and Snead21,Reference Katoh, Snead, Nozawa, Kondo and Busby75
B. Micropillar compression
Two baseline samples, A and B, were evaluated. Data from sample A were originally presented by Kabel et al. and are reproduced here with permission from Ref. Reference Kabel, Yang, Balooch, Howard, Koyanagi, Terrani, Katoh and Hosemann69. Both exhibited five alternating layers of PyC/SiC before full CVI SiC infiltration; however, the thickness of the first PyC coating (at the fiber surface) was varied. Additionally, a composite sample from the same fabrication batch as sample A was irradiated to 0.97 dPa at 350 °C in the high flux isotope reactor at Oak Ridge National Laboratory (ORNL). Reference Katoh, Snead, Nozawa, Kondo and Busby75 SEM measurements revealed interface thicknesses for samples A and Arad at ∼40 nm, and sample B at ∼1330 nm. It can be noted that these samples were prescribed to be manufactured with 50 and 500 nm PyC first layers, respectively, suggesting room for refinement in CVI processing. Table I outlines the sample test matrix and related details including the measured interface thickness, incline groupings, and total number of pillars tested for each sample.
Test matrix.

The samples were received as 2 × 2 × 1 mm3 blocks. Each sample was polished such that fibers at the edge of each sample would have different angles with respect to the horizontal plane of the polishing puck, allowing for stress state variability at the micropillar interfaces. The irradiated samples were prepared at ORNL. Figure 5(c) shows a typical five-layer alternating PyC/SiC interphase of sample A. A TEM investigation carried out in the author’s previous work Reference Kabel, Yang, Balooch, Howard, Koyanagi, Terrani, Katoh and Hosemann69 revealed that failure occurs at the thick PyC first layer, and it occurs within the PyC. This is significant because it implies that the extracted properties are a characteristic of the PyC as opposed to the PyC/fiber interface. Because propagation occurs within the first layer following deflection, Eq. (3) remains valid for mono and multilayer interfaces.
Micromechanical structures were fabricated using the FEI Quanta 3D dual beam focused ion beam (FIB; ThermoFisher Scientific, Waltham, Massachusetts) via standard FIB milling techniques. Rough and finishing cuts were performed at 30 keV with 15 and 0.1 nA currents, respectively, as illustrated in Fig. 6. Critical measurements including the interface incline and cross-sectional area were acquired at this stage of the experiment. Interface incline calculations assume perfectly cylindrical fibers. However, deformed cylindrical geometries are frequently observed. To address this, deformed fibers were stringently avoided, and multiple pillars were fabricated on pristine fibers of the same incline to allow for improved statistics.
Typical micropillar fabrication process using FIB milling techniques. (a) Candidate fiber selection and fiber incline calculation. (b) Initial FIB rough cut for micropillar mid-fabrication. (c) Final micropillar structure after finishing cuts and resulting interface area equation.
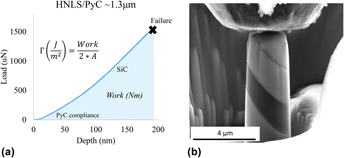
Once fabricated, the pillars were tested in situ the SEM with the Hysitron PI-85 Pico-indenter (Bruker Corp., Billerica, Massachusetts) using a 5-μm-diamond tip flat punch. Tests were performed under displacement controlled loading at 10 nm/s. Carrying out the pillar compression in situ allows acquisition of live testing video to ensure alignment and contact accuracy. This capability is particularly beneficial to the fidelity of this characterization technique and resulting properties. A typical load–displacement curve and corresponding interphase failure for a 45-degree interface incline pillar from sample HNLS_B is displayed in Fig. 7. Failure was defined as the first instantaneous load drop (P fail). In the case of Fig. 7, failure was observed at ∼1.5 mN.
(a) Load versus the diplacement curve of pillar compression showing failure load and shaded area under the curve (work of fracture) for extraction of the fracture release rate energy. (b) HNLS_B micropillar with the thick PyC interphase prior to compression.

III. RESULTS AND DISCUSSION
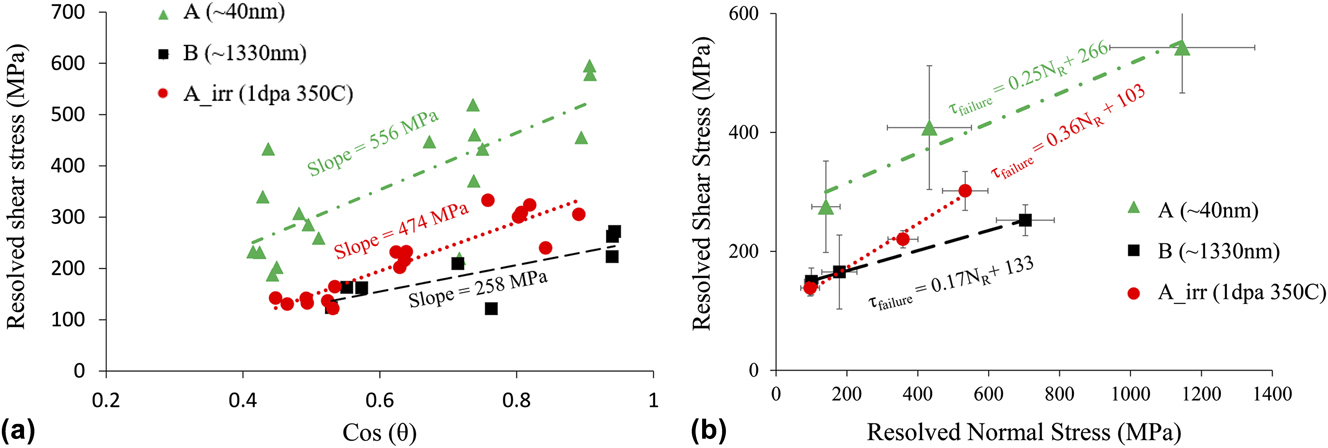
P fail was extracted from the load–displacement curve for each micropillar test, as shown in Fig. 7. The values were subsequently used to calculate the resolved normal and resolved shear stress at the plane of fracture in the interface using Eq. (5). Each sample yielded data for its respective incline plane, which were then group averaged and plotted in Mohr’s space. However, prior to applying the MC criterion, a preliminary evaluation of the ultimate failure shear strength, τfailure, was carried out for sample A, Arad, and B. This raw data were plotted with respect to the cosine of the incline angle, as shown in Fig. 8(a). In doing so, the data are adjusted such that the slope of the applied linear regression represents a single normalized value for the ultimate shear strength averaged over the range of test inclines. Analysis of Fig. 8(a) revealed a fundamental reduction in ultimate shear strength between A and Arad of ∼80 MPa, and of ∼300 between A and B. This suggests that both irradiation and increased interface thickness result in a weaker interface. Based on irradiation kinetics, it is suggested that a reduction in strength may be due to microstructural damage that is commonly observed in irradiated carbon materials. In the case of increased thickness, it may be expected that extrinsic parameters such as fiber surface roughness contribute less to the fracture path tortuosity within the PyC, potentially reducing the stress required to fail.
(a) Comparison of raw data for control samples A, Arad, and B to show fundamental reduction in strength with irradiation and thickness. (b) Application of the MC criterion to extract τdebond and µi via linear regression.

To fully understand the observed change in ultimate strength, the MC criterion investigates and separates the contribution of strength from chemical bonding and internal friction resistance. In Fig. 8(b), the resolved shear stress was plotted versus the resolved normal stress at failure for the incline group averages of samples A, Arad, and B.
A linear regression was applied from which the τ-intercept and slope were extracted to identify the contribution of strength from chemical bonding (τdebond) and internal frictional resistance (μi), respectively. Table II summarizes the extracted properties. These values are additionally compiled in Table III for comparison against push-out and bulk tensile hysteresis loop evaluations of stage ii and iii interface properties.
Interphase property values.

Governing interface properties for toughening stages i, ii, and iii.

a Converted from KIC.
With respect to irradiation effects, it can be observed that while the chemical debonding strength decreases with irradiation, the friction coefficient appears to increase. As a whole, the interface was weakened; however, the relative contribution of chemical and frictional resistance has shifted. This is likely a result of irradiation induced microstructural changes within the turbostatic graphite-like structures. Reference Karthik, Kane, Butt, Windes and Ubic76,Reference Karthik, Kane, Butt, Windes and Ubic77 For thought, consider a perfect graphite lattice for which shear failure occurs at the weakly bound basal planes. As irradiation displaces atoms from the hexagonal framework, it could be conceived that there is an effective reduction in the basal plane surface area, resulting in reduced strength. In addition, the displacements may result in new stacking and basal plane arrangement, some of which may have less strength than the others. As a result, the fracture path may become more tortuous in an effort to fail along the weakest plane, resulting in larger contribution of frictional resistance to ultimate failure. There has been extensive research into defect evolution and crystallite reconstruction for graphite and graphite-like materials under irradiation. Reference Karthik, Kane, Butt, Windes and Ubic77–Reference Snead, Burchell and Katoh79 It has been found that swelling/shrinkage, dissolution, and restructuring of nano-crystallites are strongly dependent on the fabrication parameters as well as the irradiation and irradiation temperature during operation. Most literature data are associated with bulk nuclear grade graphite which exhibits substantially different microstructures compared with the semi-oriented nanocrystallite nature of thin deposited PyC. Therefore, drawing from conclusions and characteristics of historical nuclear graphite may be misleading.
Looking at the MC property extraction for sample B (PyC ∼ 1300 nm), it was found that both the chemical bonding strength and the frictional resistance were reduced compared with sample A (PyC ∼ 40 nm). It has been observed that CVI PyC may exhibit stronger graphite-like ordering as a function of distance from the fiber surface. Reference Bertrand, Droillard, Pailler, Bourrat and Naslain35 If consistent, it is hypothesized that the bond strength is reduced as the lattice structure approaches that of highly oriented pyrolytic graphite (HOPG interlayer shear strength has been found on the order of ∼140 MPa Reference Liu, Zhang, Yang, YangLiu, Yang and Zheng80 ), where weak basal plane interactions govern the strength. In this case, fracture tortuosity would also be reduced. Additionally, fiber roughness, which may significantly impact the fracture path tortuosity in sufficiently thin interfaces, may have much less of an effect on such a thick interface. For example, the RMS roughness for HNLS fibers was found ∼2 nm and resulting peak roughness at ∼8 nm. Reference Katoh, Ozawa, Shih, Nozawa, Shinavski, Hasegawa and Snead21,Reference Sauder and Lamon73,Reference Sauder, Brusson and Lamon74 This roughness is on the order of 5–10% of the total thickness of sample A, compared with <1% for sample B. It is believed that the property values extracted from sample B are more characteristic of the true intrinsic properties of PyC.
In future work, it will be critically important to evaluate the PyC microstructure as a function of thickness as well as neutron dose, dose rate, and temperature. A careful and detailed TEM investigation of the PyC layers as they exist in these composites will be a necessary step forward in fully characterizing the mechanical property relationships observed in this analysis.
A. Fracture energy release rate
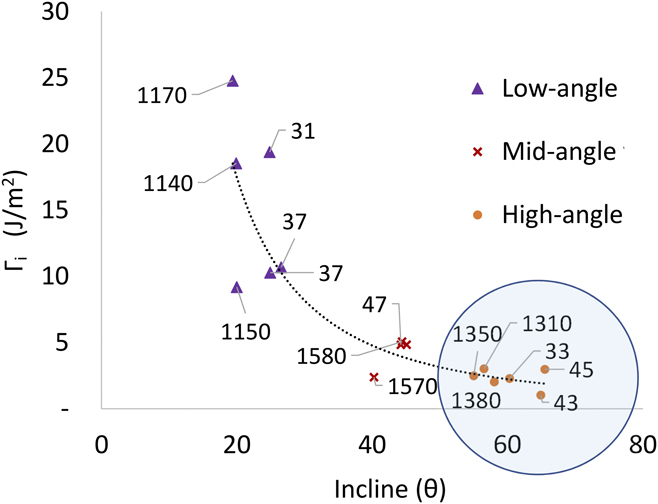
The mode II fracture energy release rate was directly extracted from several load–displacement curves across samples A and B, as shown in Fig. 7. A point of concern that may influence property extraction is the possible mechanical interaction of the fiber and matrix during compression. This is likely to be a function of the interface incline as well as interface thickness. For example, a shallow inclined interface is expected to experience more normal compression before critical shear stress is achieved. If the PyC is compressed, then a thin interface may lead to an increased fiber to matrix interaction prior to failure, increasing the work of fracture. Assuming pure mode II fracture with echelon propagation, we can apply Xia and Cedrix’s criterion [Eq. (3)] to evaluate energy release rate values for the deposited PyC as a function of thickness and incline. This allowed for extraction of the mode I energy release rate associated with the HH criterion that is critical for stage i toughening. Figure 9 is a graphical representation of the mode I energy release rate, ΓPyC, across the range of interface incline (25°–65°) with a wide range of thicknesses from 30 to 1500 nm (represented by the data labels of Fig. 9, in nanometers).
Energy release rate as a function of interface angle grouped in three and interface layer thickness (data labels in nanometers). The mode I energy release rate was calculated using Eq. (3) Cedric’s relationship ΓII = 3.5 × ΓI.
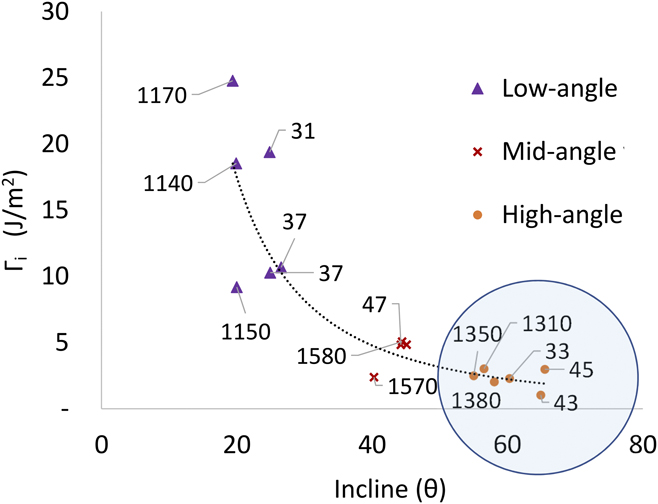
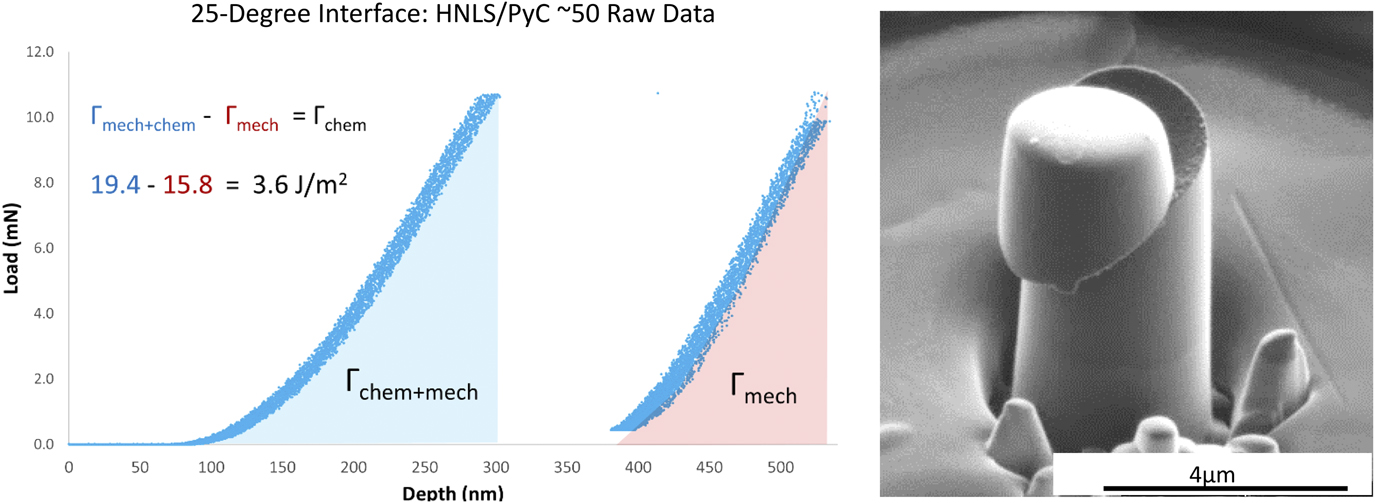
From this analysis, two primary observations can be made. The first is that the interface thickness appears to have very little influence in the general trend of the curve. This is interesting, considering a clear dependence on thickness observed for shear strength and internal friction coefficient of the interface. It is speculated that the fracture energy release rate is less sensitive to an increased surface area from fracture tortuosity compared with its influence on internal friction resistance. The second observation is that as the interface incline decreases, the release rate energy (and data scatter) increases. It is believed that this is a result of increased mechanical influence from the fiber surface roughness due to increased normal stress required to achieve shear failure. Conversely, as the interface incline increases and approaches a stress state of a pure shear (90°), the curve flattens and appears to approach a saturation value at ∼2.5 J/m2, exemplified by the blue circle in Fig. 9. In an effort to justify the claim that the observed scatter and increased release rate energy were mechanical in nature, a low-angle (25°) thin interface (38 nm) pillar test that exhibited both initial debond and debonded frictional sliding was characterized. During this test, it was possible to reset the indenter tip after initial debonding and re-apply the compression to the remaining micropillar cap. The associated load–displacement curve and SEM image of the sheared pillar are shown in Fig. 10. This test allowed evaluation of the difference between fracture energy release rate of the fully-bonded interface [area under the curve of the first load drop (blue)] and the energy release rate of the debonded interface [area under the curve of the second load drop (red), adjusted for the reduced interface contact area]. Subtracting out the work of frictional sliding initiation, denoted Γmech, from the original pristine work of fracture, Γchem+mech allows for consideration of the undiluted chemical bonding value for the fracture release rate energy of PyC. Performing this energy adjustment found ΓPyC = 3.6 J/m2 which is close to that of ΓPyC at steep inclines (>60°) = ∼2.5 J/m2 as observed in Fig. 9.
Isolation of chemical bonding contribution to fracture energy release rate. The area under the curve. Post interface failure of micropillar from HNLS_A with pillar cap still intact, adapted and reproduced with permission from Ref. Reference Kabel, Yang, Balooch, Howard, Koyanagi, Terrani, Katoh and Hosemann69. Copyright 2017 Elsevier.

This evaluation may explain the scatter observed at shallow inclines, where local surface roughness and therefore increased mechanical resistance to debond may play a stronger role. It is believed that steep incline interface property values are more characteristic of the true PyC fracture energy release rate. Therefore, our analysis presents 2.5 J/m2 as an additional data point for the PyC mode I fracture energy release rate. This value is presented in Table III amongst others found in the literature. It can be noted that ΓPyC varies significantly from different experiments; however, the value presented here, 2.5 J/m2, would satisfy the HH criterion (compared with ΓSiC ∼ 20 J/m2 from Table III) with respect to experimental microcrack deflection observed in the bulk SiC composites. It is believed that this micromechanical approach to PyC property extraction shows promise for experimental validation of crack deflection and propagation criterion. With respect to CFMC design and modeling, providing a method for property validation may open doors for improved finite element models that can build at a fundamental level, incorporating the crack deflection logic and phenomena. This may improve computer prediction and allow for iterative interface tailoring and optimization.
Table III is a comprehensive summary of the literature that has identified and extracted governing interface properties specific to SiC/PyC/SiC. Data presented for stage ii and iii are representative of samples with thin (∼50–100 μm) first layer PyC except those explicitly acknowledged (i.e., irradiated and thick PyC of this manuscript). It is observed that fiber push-out testing has significant scatter for stage ii debond strength ranging from 5 to 400 MPa. This scatter is likely due to the aforementioned challenges and assumptions relating to experimental operation (i.e., fiber and indenter alignment) and correct application of property extraction models (i.e., shear lag analysis). Additionally, fiber push-out was unable to extract a friction parameter. Micropillar compression provided debond shear strength values on the same order of magnitude, 100 to ∼300 MPa but with improved uncertainties. The lower bound of τdebond = 100 MPa (and accompanying μi = 0.7) from the pioneering work of Shih et al. Reference Shih, Katoh, Leonard, Bei and Lara-Curzio68 shows significant deviation from pillars of sample A that hosted similar ∼50 μm first layer PyC. The original effort captured data from a total of seven pillars, limiting robustness and property confidence. However, when combined with pillars from sample A as shown in Fig. 8(b) of Kabel et al., Reference Kabel, Yang, Balooch, Howard, Koyanagi, Terrani, Katoh and Hosemann69 there is only a minor shift in the extracted values with τdebond ∼ 244 MPa and μi ∼ 0.28. As micropillar compression characterization continues, it is expected that this fundamental approach will continue to narrow the uncertainties for interfaces of different PyC parameters and conditions. Improved characterization of the as-deposited PyC structure and the as-fabricated residual clamping stress will improve data fidelity and understanding of failure phenomenon. Although capable of stage i and ii property extraction, it is important to note that micropillar compression is not well equipped for the extraction of kinetic properties of stage iii. To date, fiber push-out testing continues to be the most viable option for stage iii property characterization. However, it is believed that the development of novel SSMT structures can provide appropriate avenues for refined property extraction at all stages.
IV. CONCLUSION
This manuscript provides (i) a literature review on the role of interfaces in CFMC failure and associated laboratory methods for extracting the governing properties and (ii) a demonstration of SSMT as a promising technique to improve characterization and quantification of CFMC interface properties. Three primary stages for CFMC toughening were identified: (i) crack deflection, (ii) crack propagation along the fiber, and (iii) fiber pull-out. Each stage exhibits fundamental properties including, respectively, fracture energy release rate, internal friction and debond shear strength, and kinetic friction and debonded shear stress. Traditionally, fiber push-out testing is performed to identify some of these properties. For this method, it was noted that both the physics-based models for data interpretation and the experimental procedures present inherent difficulties that lead to significant data scatter, see Table III. In situ micropillar compression was presented as an alternative method to overcome many experimental hurdles and analysis difficulties. Pillar analysis extracted properties related to stages i and ii with higher fidelity than fiber push-out. For thin ∼50 nm PyC interfaces, μi = 0.25 ± 0.03 and τdebond = 266 ± 23, as shown here and by Kabel et al. Reference Kabel, Yang, Balooch, Howard, Koyanagi, Terrani, Katoh and Hosemann69 Thick ∼1500-nm-PyC interfaces showed a reduction in both debond shear strength and internal friction coefficient with μi = 0.17 ± 0.03 and τdebond = 133 ± 14. Across the varying thickness, a fundamental value for the fracture energy release rate was observed, Γ = ∼2.5 J/m2. Finally, it was shown that irradiation at 350 C to ∼1 dPa on ∼50-nm-PyC resulted in a reduction of debond shear strength with an increase in internal friction coefficient with μi = 0.36 ± 0.03 and τdebond = 103 ± 11. It is recommended that stage i and ii property values of this effort be applied in modeling efforts, attempting to capture fundamental physics of crack propagation.
ACKNOWLEDGMENTS
This work was supported by the U.S. Department of Energy (DOE), Office of Nuclear Energy’s Nuclear Science User Facilities (NSUF) program. A portion of this study was also supported by the U.S. DOE, Office of Nuclear Energy for the Advanced Fuels Campaign of the Fuel Cycle R&D program under contact DE-AC05-00OR22725 with Oak Ridge National Laboratory managed by UT Battelle, LLC. In addition, we would like to thank the Nuclear Regulatory Commission (NRC) fellowship program and the DOE-NEUP program for support. The authors would like to acknowledge the EPSRC for their support through grant number EP/N017110/1. Lastly, we would like to thank those involved with the UC Berkeley BNC facility and the Lawrence Berkeley National Laboratory National Center for Electron Microscopy (LBNL NCEM) for enabling this research through access and expertise to the necessary facilities.