


I. INTRODUCTION
The massive growth of mobile data in the last decades which will continue its trend in the foreseeable future due to the spreading use of smartphones and multimedia services, challenges wireless service providers to make enough bandwidth available. As today's cellular providers attempt to deliver high-quality, low latency video, and multimedia applications for wireless devices, the usable spectrum between 700 MHz and 2.6 GHz poses a severe limit [Reference Rappaport1]. The millimeter wave (mm-wave) band looks promising to overcome the bandwidth shortage. By significantly increasing the bandwidth, the network capacity will be greatly increased while the latency for digital traffic will be decreased, thus supporting much better internet-based access and applications that require minimal latency [Reference Rappaport1]. In the last decade, the mm-wave band gained much interest for future indoor wireless networks and ultra-high capacity short-range links, but was disregarded for outdoor usage due to high path loss. However, electronically steerable antennas with narrow beams could achieve sufficient gain, even for large distances.
For outside mobile access, profound knowledge of the channel properties is an absolute prerequisite for successful system design. This knowledge however is still very limited and further investigations are required. Especially, tree trunks and street furniture such as lamp posts are expected to have a significant impact on the radio channel propagation because of its high reflectivity and cylindrical geometry. Ray tracing is a good candidate to analyze the influence of street furniture. It enables to extract three-dimensional (3D) spatial information (angle of departure and angle of arrival) from the simulation at lower effort than measuring, and thus giving a complete view on the channel with unlimited spatial and temporal resolution. Also, vehicles moving by are expected to cause, so called, flashing rays [Reference Maltsev2] and to obstruct static path components arising from building facades of the street canyon (ray blockage). The flexibility of this method offers a wide range of analysis opportunities and makes it easily adaptable to other locations.
In this paper, the impact of lamp posts and tree trunks in a street canyon scenario (Potsdamer Straße in Berlin, Germany) is investigated at 60 GHz using ray tracing simulations. The simulations have been performed with and without street furniture. Additionally, simulations with moving vehicles on the roads have been performed. In course of this work, the simulation results are compared to measurements which have been performed at the same location. The simulation material parameters have been parametrized to match the major components identified in the measurements.
II. SIMULATION ENGINE AND 3D MODEL
A) Simulation engine
The OptiX Ray Tracer is a polarimetric parallel ray tracing simulator developed by the Fraunhofer Heinrich Hertz Institute based on NVIDIA's OptiX engine [Reference Felbecker, Raschkowski, Keusgen and Peter3]. This tool uses ray forward tracing and backward tracing via the imaging method to efficiently and accurately compute the radio channel for a given scenario [Reference Felbecker, Raschkowski, Keusgen and Peter3]. The common imaging method has been extended to support reflections via curved surfaces.
As the influence of the convexity on the physical wave propagation cannot be neglected, this effect is modeled by the Uniform Theory of Diffraction (UTD), which was presented in [Reference McNamara, Pistorius and Malherbe4, Reference Pathak, Burnside and Marhefka5]. This solution divides the lit zone, which is the total of all points which can be reached directly or by a reflection on the convex surface from the source point, into two sub zones, the deep lit zone in which geometric optics (GO) is valid and the transition lit zone for which the UTD foresees a non-GO approach.
B) 3D model
The 3D CAD model which covers an area of 380 m × 310 m has been obtained from the urban administration of Berlin. By coloring surfaces, material parameters can be assigned to the surfaces (see Fig. 1). In this way, it is possible to create realistic and multi-material scenarios easily.
Bird's eye view of the 3D model of Potsdamer Straße.

The lamp posts on the Potsdamer Straße are made of metal and have a smooth surface. They can be assumed as smooth and perfectly electrically conducting cylinders with a radius of 15 cm. Although the tree trunks will not reflect as strongly as lamp posts, they are potentially important to predict the channel characteristics accurately [Reference de Jong and Herben6]. In the literature tree trunks are mostly modeled by rough, lossy, dielectric cylinders in the mm-wave band [Reference Chiu and Sarabandi7–Reference El-Rouby, Ulaby and Nashashibi9].
The considered roughness in these models results from the rough and lossy bark layer [Reference El-Rouby, Ulaby and Nashashibi9]. However, the trees on the Potsdamer Straße are quite young, so they have a very thin and smooth bark layer. Hence, losses by a rough and lossy bark layer have been neglected. A smooth, dielectric cylinder with a radius of 15 cm has been assumed to model the tree trunks. According to [Reference El-Rouby8] millimeter waves hardly propagate through tree branches, thus the material thickness can be assumed as being infinite and transmission can be neglected.
Table 1 shows the material parameters used for the simulations.
Overview of the used material parameters (ε r = ε′ r − j ε r ″).

C) Modeling of traffic
Traffic has been modeled with help of video recordings from the measurements for one scenario where Tx and Rx had been placed on the median strip. According to the traffic light phases groups mixed of cars, vans and buses have been placed. The average speed of each vehicle group has been estimated with help of the video material. Speeds of 20, 30, and 45 km/h have been assigned to the vehicle groups and buses. Cars and transporters have been assumed as mixed glass and metal objects, whereas double-decker buses have been supposed to be made entirely of glass. An exemplary view of the cars and transporters in the ray tracing scenario is shown in Fig. 2.
3D model of cars and transporters.

III. SIMULATION SETUP
The static simulations with omnidirectional receiver were performed on the median strip of Potsdamer Straße. Omnidirectional vertically polarized isotropic antenna patterns were used for both, receiver and transmitter. The distance between the antennas was 25 m. The ray tracer launched 109 rays from the transmitter equally distributed in all directions to find the paths between the transmitter and the receiver. The transmitter was always placed at a height of 3.5 m, while the receiver had a height of 1.5 m. The simulation setup is illustrated in Fig. 3. Matching to the measurement setup, the center frequency of the signal was 60 GHz and the results were bandwidth-limited to 250 MHz. Only multipath components (MPC) stronger than −130 dB were regarded.
Top view of simulation scenario.

In the simulation scenario with mobile receiver, the receiver was moving away from the transmitter with an approximate speed of 0.5 m/s over a distance of 25 m. A measurement snapshot was taken every 800 µs corresponding to 0.4 mm receiver movement. The resulting power delay profiles (PDPs) were averaged over 250 snapshots which correspond to 10 cm movement. The same setup was used for both, the simulation and the measurement. Further details on the measurement setup can be found in [10].
For traffic evaluations, simulations of static scenario on the median strip of Potsdamer Straße with a Tx–Rx distance of 25 m have been performed. A threshold of 8 dB relative to the mean value of the delay bin of average PDP has been used for flashing rays and blockage detection. The threshold value has been determined by visual inspection of the measurement and simulation results. The Doppler effect has been disregarded.
IV. RESULTS
A) Influence of street furniture and tree trunks for static receiver on the median strip
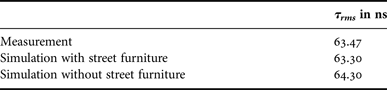
Static simulations on the Potsdamer Straße were performed with and without street furniture. The results in Fig. 4 of a static scenario on the median mean, pointed in Fig. 3, show that with street furniture a stronger multipath propagation is found by the ray tracer. While without street furniture only reflections from large buildings arise, the comparison shows that between these strong paths many more MPCs arise when street furniture is considered. Especially near the line-of-sight (LOS) delay, lamp posts, and tree trunks result in significant MPCs which cannot be neglected. This is also in accordance to the measurement results. Also in the averaged power delay profile (APDP) evolutions of static scenarios of the simulations and measurements shown in Figs 5 and 6, respectively, static MPCs near the LOS delay caused by lamp posts and tree trunks can be observed. Even though, the measured MPCs cannot be reproduced by the ray tracer exactly regarding amplitude and delay, the results are in principal accordance to the measurements. Due to the sensitivity in the mm-wave band with regard to the geometric arrangement, discrepancies have to be accepted. At larger delays the power of MPCs from street furniture drops strongly. However, there is also a non-negligible power contribution at larger delays, which is in accordance to measurements at the same position. The root-mean-square (RMS) delay spread analysis in Table 2 indicates that the simulations with street furniture give slightly more realistic results but make no significant difference regarding delay spread. However, for beam-forming systems these paths can play an important role in non-line-of-sight (NLOS) and obstructed line-of-sight (OLOS) scenarios.
APDP comparison with and without street furniture.

APDP evolution of simulation scenario.

APDP evolution of corresponding measurement scenario.

RMS Delay spread of simulations and measurement.
B) Influence of traffic for static receiver on the median strip
Simulations for one scenario considering traffic, shown in Fig. 3, on the median strip have been performed. Fig. 5 shows the APDP evolution of the simulation over time. As obvious, traffic has a significant influence on the channel. Due to moving cars and buses, flashing rays [Reference Maltsev2] (red markers) arise and MPCs are blocked (pink markers). These effects have been detected with a threshold of 8 dB relative to the mean power of the corresponding delay bin. MPCs 8 dB stronger than the mean power have been designated as flashing rays and MPCs falling more than 8 dB below the mean power of the corresponding delay bin have been designated as blocked rays. Short MPCs tagged by red markers in Fig. 5 are caused by cars passing by which cause path components between transmitter and receiver for a short time. Between 35 and 40 s and between 43 and 50 s at delays 110 and 140 ns, respectively, strong and long-lasting MPCs are visible. These are caused by double-decker buses passing by which can be seen in Fig. 7. A double-reflected path arising from the bus, shown by the orange marker in Fig. 5, is underestimated by the ray tracer. Hence, it is not detected as flashing ray in contrast to the measurements in Fig. 6.
Obviously, there also exist MPCs caused by static objects of the environment (buildings, tree trunks, lamp posts, etc.) which are disturbed by traffic, shown by pink markers. Investigations of the ray tracing results have shown that blockage is caused by buses and large transporters since the level of cars is lower than the level of rays reflected from building facades. Obviously the MPC at 330 ns is blocked for a longer duration in the simulations than in the measurements.
The results of the ray tracing simulations can be supported by measurements shown in Fig. 6. As visible, short flashing rays caused by cars arise and also MPCs caused by buses can be seen clearly. Especially, at the delays 100 and 120 ns many flashing rays appear. From ray tracing simulations these can be identified as the two sides of the road. This is supported by another measurement of a different scenario on the median strip of Potsdamer Straße. As stated for simulations, static MPCs in measurements are also blocked only by large vehicles. However, the measurements show a fading behavior which cannot be reproduced by the ray tracing simulations.
The measurement results in Fig. 8 are lacking of strong static MPCs. Thus, in this scenario significant power is received only by flashing rays. They can be exploited to establish a better link between receiver and transmitter.
Ray tracing results of bus reflection.

APDP evolution of different measurement scenario.

Figure 9 shows the cumulative distribution function of the duration of flashing rays. The simulation results for a single scenario and the measurement results for all static scenarios are matching well, whereas the measurement result for the corresponding single scenario shows slightly different characteristics. This can be explained by the APDP evolutions shown in Figs 5 and 6. Since two long-lasting flashing rays between 5 and 10 s and between 37 and 42 s, respectively, in the measurements cannot be reproduced by the ray tracer, the cumulative distribution function of the duration of flashing rays is not matching. Nevertheless, this kind of flashing rays caused by a bus and a large truck occur rarely. Thus, the ray tracing results match to the overall results of all static measurement scenarios.
Cumulative distribution function of the duration of flashing rays.

The simulation and overall measurement results show that nearly 90% of flashing rays have a duration smaller than 1 s. These are caused by passenger cars and small transporters such as vans. Thus, flashing rays caused by cars dominate the behavior. Since large vehicles such as buses and large trucks pass rarely, most flashing rays are caused by passenger cars and vans.
The blockage duration of the simulations in Fig. 10 is found to be significantly larger than the blockage duration of measurements. This is due to the influence of buses especially in this scenario. Since the movement of traffic has been modeled with constant average speeds, inaccuracies arise. The MPC at 330 ns arises from the DB-building shown in Fig. 3. At this point the bus is driving at full speed, but slows down afterward since it reaches a bus station. Therefore, the average speed used in the simulations is significantly smaller than the actual speed causing a higher blockage duration.
Cumulative distribution function of the blockage duration.

The cumulative distribution function of the amplitude of flashing rays is depicted in Fig. 11. The results of the single measurement show that especially in this scenario there exist several rays with strong amplitude. Nevertheless, the simulation results are in accordance to the overall measurement results. Approximately 80% of the flashing rays have an amplitude lower than −120 dB. However, 20% are stronger and have a significant impact on the channel. Figure 12 shows that for 20% of measurement time there exists a strong MPC caused by flashing rays with an amplitude of at least −120 dB. The largest gap between flashing rays is approx. 3.6 s. Hence, strong flashing rays have to be considered to model the temporal evolution of the mm-wave channel.
Cumulative distribution function of the amplitude of flashing rays.

Probability that a strong flashing ray of at least −120 dB emerges within a certain time.

C) Influence of street furniture and tree trunks on scenarios with mobile receiver on the median strip
Previous investigations showed that cylindrical street furniture contributes significantly to MPCs near to the LOS path. Figures 13–15 show the color-coded APDP evolutions over the receiver–transmitter distance from 2 to 50 m. They prove that lamp posts and tree trunks can have significant influence on the results. In Fig. 15 in the bottom marker a fusion of two MPCs is visible. At approximately 7 s the LOS path component and the path component of a tree reflection are approaching and fusing. This effect arises from the cylindrical geometry of the tree. The path, via a reflection on the tree, starts at the beginning of the measurement at a delay of 20 ns. It approaches the LOS path, until at 6 s it reaches the delay of the LOS path. Also at ~17 s measurement time, a fusion of two path components caused by a lamp post, is visible in the APDP. The path in the APDP starts at approximately 5 s at a delay of 60 ns and approaches the LOS path, until it reaches the LOS path at 17 s. These effects cannot be reproduced by the simulation without street furniture in Fig. 14. In the photographs of the measurement at the corresponding moments (Figs 16 and 17), the lamp post and the tree are clearly visible. At approximately 7 s measurement time the moving receiver reaches the tree, and at 17 s it reaches the lamp post; thus their path components merge with the LOS component. In Fig. 17, in Marker 2 also a metallic object is visible which could also cause the effect in the APDP and not the tree trunk. However, the video recordings of the measurement show that the tree and not the metallic gave rise to the examined effect. Also the object has a rectangular shape which would not give rise to previously described effects.
Color-coded APDP evolution (simulation).

Color-coded APDP evolution (simulation without street furniture).

Color-coded APDP evolution (measurement).

Photograph from measurement at 17 s.

Photograph from measurement at 7 s.

In the simulation (Fig. 13), the same effects are visible. At 6 and 16 s the path approaches the LOS path as in the measurement. The ray tracer reproduces the phenomenon in good accordance to the measurements. However, the MPCs in the measurement underlie a stronger fading effect than in the simulation. This arises from additional multipath contributions in the measurement. The results show that street furniture can give rise to strong path components which can be of great interest for beam-forming systems.
Nevertheless, the total received power is dominated by the LOS path and the ground reflection. Thus, street furniture makes no significant difference in LOS scenarios regarding path loss analysis. As obvious in Fig. 18, also the sensitive delay spread measure shows no significant differences regarding street furniture. However, in NLOS and OLOS cases beam-forming systems can benefit from these paths. A typical OLOS scenario could be body blockage which blocks the LOS path and also the ground reflection. Paths arising from street furniture on the sides of the pavement could pass anyway. Fig. 19 shows the cumulative distribution function of the additional path loss of the third strongest paths regarding the respective LOS paths. In 90% of the scenarios, a body blockage would cause a maximal additional path loss of 20 dB, whereas an approach neglecting street furniture would have to deal with a maximal additional path loss of 40 dB. Hence, beam-forming systems making use of street furniture could achieve better performance.
RMS delay spread comparison.

Cumulative distribution function of the additional pathloss relative to LOS path during LOS blockage evaluation of third strongest path.

V. CONCLUSION
It has been shown that lamp posts and tree trunks have a non-negligible influence on the mm-wave propagation channel in a street canyon environment. At delays close to the LOS delay, they lead to strong paths which can be used by beam forming systems, especially in NLOS scenarios. Because of their cylindrical geometry, they spread the propagating wave over a wide area and establish paths for most of the transmitter–receiver arrangements. At larger delays, the investigations have shown that they can be an explanation for the weaker MPCs in the measurement results between the strong ones that result from the building facades of the street canyon.
Also traffic has a significant influence on the mm-wave propagation channel. For the evaluated scenario, blockage up to 4 s has to be considered. On the other hand, flashing rays can contribute to the received power if the LOS component is obstructed and other strong contributions from buildings are missing.
The effects of street furniture, tree trunks and traffic can be predicted by ray tracing if these objects are properly included in the 3D model.
ACKNOWLEDGEMENTS
The research leading to these results has received funding from the European Union's Seventh Framework Program (FP7-ICT-2013-EU-Japan) under grant agreement number 608637.
 Barış Göktepe was born in Berlin, Germany, in 1991. He received B.Sc. degree in Electrical Engineering in 2015 from Berlin University of Technology (TU Berlin), Berlin, Germany, where he is currently a graduate student. From 2013 to 2015, he has been working as a graduate research assistant in the Wireless Networks at Fraunhofer Heinrich Hertz Institute on millimeter wave band channels and ray tracing simulations. Since 2015 he has been part of the Video Coding and Analytics Department of Fraunhofer Heinrich Hertz Institute. His main areas of research interest are system level simulations for LTE and Ultra Low Delay for cellular systems.
 Michael Peter received the Diploma degree in Electrical Engineering and Information Technology from the University of Karlsruhe, Germany, in 2004. In 2005, he joined the Fraunhofer Heinrich Hertz Institute in Berlin, where he has been involved in various national and European projects on 60 GHz and millimeter-wave communications. His research activities focus on millimeter-wave channel measurements and modeling and physical layer design of wireless broadband communication systems. Michael Peter is the author and co-author of more than 30 scientific papers.
 Richard J. Weiler received his diploma (Dipl.-Ing.) in Electrical Engineering and a diploma in business administration (Dipl.-Wirt. Ing.) from RWTH Aachen University in Germany. In 2010, he joined the Fraunhofer Heinrich-Hertz-Institute in Berlin, Germany, where he is currently working as a research engineer and project manager for the EU–Japan project MiWEBA. His main research interest is millimeter-wave communication with a focus on propagation and the lower network layers.
 Wilhelm Keusgen received the Dipl.-Ing. (M.S.E.E.) and Dr.-Ing. (Ph.D.E.E.) degrees in Electrical Engineering from RWTH Aachen University, Aachen, Germany, in 1999 and 2005, respectively. From 1999 to 2004, he was with the Institute of High Frequency Technology, RWTH Aachen University. Since 2004 he has been heading a research group for mm-waves and advanced transceiver technologies at the Fraunhofer Heinrich Hertz Institute, located in Berlin, Germany. His main research areas are millimeter wave communications, measurement and modeling of wireless propagation channels, multiple antenna systems, and compensation of transceiver impairments.



