




No CrossRef data available.
Article contents
Regional right and left ventricular function after the Senning operation: an ultrasonic study of strain rate and strain
Published online by Cambridge University Press: 21 January 2005
Abstract
Background: Systemic right ventricular dysfunction is a major concern in the follow-up of patients who underwent an atrial redirection procedure for transposition (concordant atrio-ventricular and discordant ventriculo-arterial connections). No good non-invasive method is currently available for quantifying right ventricular function. Aims: We have used ultrasonically based imaging of strain rate and strain to quantify regional deformation in the right ventricle after the Senning operation, comparing properties of regional deformation of the right ventricle with right ventricular ejection fraction as measured using magnetic resonance imaging. Methods: In 20 asymptomatic patients who had undergone the Senning procedure, we measured peak systolic strain rate and systolic strain values in the right ventricular free wall, the septum and the left ventricular lateral wall using colour Doppler myocardial imaging, comparing the data with findings obtained in 30 healthy subjects. Global right ventricular ejection fraction was assessed using magnetic resonance imaging. Results: Properties of deformation of the right ventricular free wall were reduced and homogeneous after the Senning procedure compared to normals, with significantly lower values for peak systolic strain rate and systolic strain (−1.1 ± 0.4 vs. −2.5 ± 0.9 s−1; p < 0.05 and −16 ± 7% vs. −38 ± 13%; p < 0.05, respectively). There was a significant correlation between regional longitudinal right ventricular systolic strain values and right ventricular ejection fraction (r = −0.87, p < 0.001). In the septum, peak systolic strain rate was again reduced and homogeneous (−1.2 ± 0.4 vs. −1.8 ± 0.5 s−1; p < 0.05 vs. normals). Also in the left ventricle, the lateral wall peak systolic strain rate and systolic strain values were reduced (−1.5 ± 0.5 vs. −2.1 ± 0.9 s−1; p < 0.05 and −20 ± 6% vs.−25 ± 9%; p < 0.05, vs. normals, respectively). Conclusions: Properties of regional longitudinal deformation of the systemic right ventricle are reduced after the Senning procedure compared to normal controls, and correlate well with global right ventricular performance. These findings suggest that ultrasonic strain rate and strain imaging could be used in the non-invasive follow-up of ventricular function in these patients.
Keywords
Information
- Type
- Original Article
- Information
- Copyright
- © 2004 Cambridge University Press
Patients who have undergone atrial redirection procedures for surgical treatment of transposition, or concordant atrio-ventricular with discordant ventriculo-arterial connections, have a reasonable long-term outcome.1–6 Although in the current era the arterial switch operation is the procedure of choice, many patients are now being followed up after either the Senning or the Mustard operation. Problems associated with this type of surgery are obstructions or leaks related to the baffle, dysrhythmia, especially junctional rhythm and intra-atrial re-entry tachycardia, and right ventricular dysfunction. Controversy exists whether the morphologically right ventricle is capable of providing support to the systemic circulation over a lifetime. The reported incidence of right ventricular dysfunction following an atrial redirection procedure varies between 7% and 50%, with a 5% incidence of clinical heart failure.2–4, 6–9 Traditionally, the non-invasive follow-up of right ventricular function has been based on a combination of conventional echocardiography, radionucleide angiography, or magnetic resonance imaging.2, 6–12 Using these techniques, however, it is difficult to predict which right ventricles are doomed to fail, and would benefit from early medical or surgical treatment.6 This might be explained by the absence of “normal” values for the morphologically right ventricle supporting the systemic circulation. Ultrasound-based imaging of strain rate and strain has recently been introduced as a non-invasive method for quantifying regional myocardial deformation.13–15 These indexes quantify local myocardial deformation in the radial or longitudinal direction.16–20 In previous studies, we demonstrated that strain rate and strain imaging can be used to quantify regional myocardial function in healthy children, in patients with Friedreich's ataxia, and after surgical repair of tetralogy of Fallot.21–24 The first objective of the present study was to measure regional strain rate and strain in patients after a Senning operation. The data on regional deformation were compared with corresponding data sets obtained in age-matched normal controls. The second objective was to compare properties of regional right ventricular deformation with right ventricular ejection fraction measured with magnetic resonance imaging. From experimental data relating to normal myocardium, it is known that regional systolic strain and global ejection fraction correlate linearly over a wide range of inotropic states and heart rates.25 Little is known, however, how regional strain is related to indexes of global performance in patients under conditions of abnormal loading.
Materials and methods
Patients
We studied 20 patients, 13 boys and 7 girls, who had undergone a Senning procedure for the combination of concordant atrio-ventricular and discordant ventriculo-arterial connections in early infancy, and who were undergoing routine clinical follow-up. The patients were evaluated at a mean age of 14.3 ± 3.3 years, with a range from 8.8 to 19.1 years, at a mean time interval of 13.8 ± 3.2 years after surgery. All were asymptomatic and in Grade I of the classification of the New York Heart Association. The mean heart rate at the time of the study was 71 ± 13 beats/min. Of the patients, 18 were in sinus rhythm, and 2 were in junctional rhythm, with 2 patients taking lisinopril because of reported decreased right ventricular function as assessed visually using conventional cross-sectional echocardiography. The echocardiographic evaluation using colour Doppler myocardial imaging, and the magnetic resonance imaging study was performed on the same day. As part of the routine clinical follow-up, standard grey-scale echocardiography and blood-pool Doppler studies were performed; this showed mild tricuspid regurgitation in 6 patients and mild left ventricular outflow tract obstruction in 3 patients, all with a peak systolic gradient of less than 40 mmHg.26 No patient had clinical or echocardiographic evidence of baffle obstruction. No abnormalities of regional wall motion were observed on visual inspection. The ultrasound data sets were compared with corresponding data sets obtained from 30 age-matched healthy children. Informed consent was obtained from both the parents of the patients and normal controls. The study was approved by the local Medical Ethical Committee.
Colour Doppler myocardial imaging
For assessment of longitudinal function, real-time data from colour Doppler myocardial imaging was recorded from the right ventricular free wall, the ventricular septum, and the left ventricular lateral wall using apical four-chamber views. Radial function of the left ventricular posterior wall was recorded using a parasternal long-axis view. All data were acquired at a high frame rate, greater than 150 frames/s, on a GE Vingmed System V (GE, Horten, Norway) using 3.5 MHz probe. An appropriate velocity scale was chosen to avoid aliasing. Special attention was paid to align the ultrasound beam as accurately as possible with the direction of the wall motion to be interrogated.
Off-line analysis
All data were analysed using dedicated software (TVI®, GE Vingmed, Horten, Norway and Speqle® – software package for Echocardiographic Quantification Leuven, K.U.Leuven, Belgium), as previously described.21 In brief, strain rate is derived from myocardial velocities by calculating the spatial velocity gradient over a computation area of 8–10 mm in the longitudinal direction, and of 4–5 mm in the radial direction. To derive profiles of velocities and strain rate from a segment, the region of interest was maintained in a constant position within the segment being interrogated by using a semi-automatic tracking algorithm. Curves for velocities and strain rate were averaged over three cardiac cycles using the Speqle software. Natural strain profiles were obtained by integrating the mean values for strain rate over time using end diastole as the reference point. From the data for averaged velocity, strain rate, and strain, we calculated peak systolic velocity, peak systolic strain rate, and systolic strain. The intra- and interobserver variability, expressed as a percentage of the mean, averaged 10% and 12% for strain rate, and 11% and 14% for strain.21
Magnetic resonance imaging
Right ventricular volumes were quantified by means of breath-hold segmented gradient-recalled echo sequences in 20 patients, and also in 10 healthy children, using a Philips machine with a 1.5 T magnet. In 4 patients, the data sets proved unsuitable for analysis because of artefacts. The right ventricles were encompassed by means of contiguous short-axis views from base to apex. Right ventricular volumes were calculated after delineation of the endocardial surfaces of the end-diastolic and end-systolic images. Multiplication of the delineated cavity area with the slice thickness yielded the slice volume, and summation of all slice volumes yielded ventricular volume at end diastole and end systole. Stroke volume was determined by the subtraction of end-systolic volume from end-diastolic volume. Ejection fraction was calculated as stroke volume divided by end-diastolic volume and multiplied by 100.
Statistics
Values are presented as mean ± standard deviation. We made comparisons between the base, mid, and apical segments, respectively, for each wall. For multiple comparisons, we used analysis of variance with post hoc tests. The relation between right ventricular longitudinal systolic strain and the right ventricular ejection fraction was assessed with the Pearson's correlation analysis. Values of less than 0.05 were considered statistically significant.
Results
Data sets for velocities derived from colour Doppler myocardial imaging could be obtained in all 20 patients, and all 30 normal controls. In the patients who had undergone a Senning procedure, 12% of all measured segments, mainly apical and basal segments, had to be excluded from the final analysis. In these segments, the calculation of strain rate and strain was unreliable due to signal artefacts, reverberations, or a low ratio of signal to noise. In the normal group, only 5% of the acquired segmental data was excluded from analysis. Representative examples of curves for longitudinal and radial velocities, strain rates, and strain are shown in Figures 1 and 2, respectively. Reliable cine magnetic resonance imaging could be obtained in 16 patients and in 10 healthy children. In four cases, studies were considered inadequate because of artefacts, mainly due to the presence of operation clips.

Figure 1. Longitudinal motion and deformation of the systemic right ventricle in a patient after a Senning repair. The velocity (a), strain rate (b) and strain curves (c) over one heart cycle are extracted from the basal, midwall and apical segments of the systemic right ventricular free wall. Note that there is a base–apex gradient for the velocity with the highest velocities at the cardiac base and lowest velocities at the apex. In contrast the strain rate and strain profiles were homogeneous in the three different segments. AVC: aortic valve closure; RV: right ventricle; LV: left ventricle; RA: right atrium; LA: left atrium.

Figure 2. (a) Cross-sectional colour Doppler myocardial imaging obtained from a parasternal short axis at midpapillary level. The arrow indicates the area of computation from where the strain rate curve was extracted. (b) Strain rate profile for left ventricular radial deformation, derived from the left ventricular posterior wall. (c) Radial strain profile from the left ventricular posterior wall. IVR: isovolumic relaxation time; SR: strain rate; ε: strain.
Systolic longitudinal function of the right ventricle
Regional systolic myocardial velocities were significantly lower in the basal and mid-segments of the right ventricular free wall, when compared to the normal right ventricular free wall. Peak systolic strain rate and systolic strain in the right ventricular free wall were significantly lower compared to normal (Fig. 3a). In the patients, strain rate and strain values were homogeneously distributed throughout the right ventricular free wall (Table 1), while in normal subjects the highest peak systolic strain rate and systolic strain values were measured in the mid-segments (Table 1). Deformation properties of the free wall of the systemic right ventricle in the patients who had undergone a Senning procedure were also compared with data obtained from the lateral wall of the normal systemic left ventricles. In the patients, peak systolic strain rate and systolic strain in the segments of the right ventricular free wall were lower compared to the values measured in the lateral mural segments of the normal left ventricle (Fig. 3b).

Figure 3. Comparison (a) of longitudinal motion (peak systolic velocity) and deformation (peak systolic strain rate and systolic strain) between the systemic right ventricle of patients who have undergone the Senning procedure and the subpulmonary right ventricle of normals. Results are displayed for the basal, midwall and apical segment of the right ventricular free wall. For a better visualization, the Y-axis of the strain rate and strain figure is inverted. Another comparison (b) is made of longitudinal motion (peak systolic velocity) and deformation (peak systolic strain rate and systolic strain) between the systemic right ventricle of patients who have undergone the Senning procedure, and the systemic left ventricle of normals. Results are displayed for the basal, midwall and apical segment of each wall. For a better visualization the Y-axis of the strain rate and strain figure is inverted. *p < 0.05 vs. normals. LV: left ventricle; RV: right ventricle.
Table 1. Peak systolic velocities (cm/s), peak systolic strain rate (s−1) and systolic strain (%) for left and right ventricular longitudinal function (4CH view).

Systolic longitudinal function of the ventricular septum
Regional peak systolic velocities were significantly lower in the basal and mid-segments in those who had undergone a Senning procedure. Peak systolic strain rate was significantly reduced in the different septal segments, and was homogeneously distributed along the wall. Systolic strain values in the basal and mid-segments were not significantly different from normal values (Table 1).
Systolic longitudinal function of the left ventricle
Peak systolic velocities in the left lateral wall segments were not significantly reduced in those who had undergone a Senning procedure. Regional systolic deformation was found to be abnormal in these segments, with significantly lower peak systolic strain rate values for the basal and mid-segments. Systolic strain values were decreased in the basal and apical segments (Table 1).
Systolic radial function of the left ventricle
Radial peak systolic velocities in the left ventricular posterior wall were significantly increased in the patients who had undergone a Senning procedure. Despite this, decreased properties of radial deformation of the left ventricle were measured in the posterior wall. This was reflected by a significantly reduced peak systolic strain rate and systolic strain (Fig. 4).

Figure 4. Results of the radial motion (peak systolic velocity) and deformation (peak systolic strain rate and systolic strain) of the left ventricular posterior wall in patients after a Senning repair and normals. Note that peak systolic velocity is increased after the Senning procedure, probably due to tethering effects of the right ventricle. In contrast peak systolic strain rate and systolic strain are significantly reduced in these patients indicating impaired left ventricular radial function. *p < 0.05 vs. normal. Vel: velocity; SR: strain rate; ε: strain.
Correlation between right ventricular ejection fraction and longitudinal systolic strain
Right ventricular ejection fraction, as measured by cardiac magnetic resonance imaging, was significantly lower in those who had undergone a Senning procedure (50 ± 10% vs. 65 ± 4% in normals, p < 0.01). In the healthy children, right ventricular ejection fraction values were comparable with the values reported in the literature.12 A strong and significant correlation was found between the right ventricular ejection fraction as derived using magnetic resonance imaging and the systolic longitudinal strain values measured from the basal segment of the right ventricular free wall (Fig. 5; r = −0.87, p < 0.001).

Figure 5. Pearson's correlation between right ventricular ejection fraction (assessed by magnetic resonance imaging) and longitudinal systolic strain of the basal right ventricular free wall segment. The grey bullets indicate the 2 patients with right ventricular dysfunction, visually assessed on cross-sectional echocardiography. These patients also have the lowest strain values. RV: right ventricle.
Discussion
Quantitative functional assessment of right ventricular function and the early detection of deterioration over time are the important aspect in the follow-up of patients who have undergone a Senning or Mustard procedure. The non-invasive quantification of right ventricular function in this setting is important for clinical management, but is technically very challenging. Early detection of functional deterioration might result in changing medical management, such as prescribing inhibitors of angiotensin-converting enzyme, beta-blockers, or diuretics, or might push the clinician to perform banding of the pulmonary trunk to train the left ventricle for a subsequent double switch procedure. In previous studies, right ventricular function was evaluated by qualitative visual inspection of real-time grey-scale echocardiography, or by measuring ejection fraction using angiography, radionucleide ventriculography, or magnetic resonance imaging.2, 6–12 In our study, we used colour Doppler myocardial imaging to quantify right and left ventricular function, looking at regional velocities and properties of myocardial deformation. In those with good function, properties of regional longitudinal deformation of the right ventricle were shown to be reduced compared to normal values for the right ventricle, and also compared to normal values for the lateral wall of the left ventricle. Properties of deformation of the left ventricle were also shown to be significantly reduced in patients who had undergone a Senning procedure. Regional strain in the right ventricular free wall correlates strongly with right ventricular ejection fraction as measured by magnetic resonance imaging. This suggests that strain rate and strain imaging could be used in the clinical follow-up.
Strain rate and strain imaging
Imaging of strain rate and strain using ultrasound with proper tracking and data averaging has been shown to be a feasible technique to quantify regional myocardial deformation in healthy children, as well as in patients after surgical repair of tetralogy of Fallot and those with Friedreich's ataxia.21, 23, 24 In our studies, regional myocardial function is quantified using two different parameters of deformation, namely strain rate and strain. Regional systolic strain describes the percentage of myocardial deformation from end diastole to end systole. Prior experimental work in normal myocardium has shown that ultrasonic measurements of systolic strain correlate well with sonomicrometric measurements.27 Moreover, regional values for strain were shown to correlate linearly with ventricular ejection fraction over a wide range of inotropic states and heart rates.25 Strain does not take into account the temporal dimension, that is the time necessary for the myocardium to reach maximal deformation. Measurements of strain rate quantify the velocity of myocardial deformation, and thus reflect the velocity of myocardial fibre shortening. From experimental work, it is known that changes in peak systolic strain rate parallel the changes in contractility as expressed by global dp/dt.25, 28 Thus, strain rate and strain quantify two different properties of deformation, and provide complementary information on myocardial function.
Systolic right ventricular function in patients after a Senning procedure
Properties of regional deformation, both strain rate and strain, were homogeneously distributed throughout the different segments of the right ventricular free wall, and were significantly lower compared to the corresponding values obtained in the normal subpulmonary right ventricle (Fig. 3a) and the normal systemic left ventricle (Fig. 3b). This suggests that right ventricular longitudinal function is decreased after a Senning procedure. This might be due either to right ventricular dysfunction, or to physiological adaptation to increased afterload.
The reduced regional values for strain in the absence of regional abnormalities of wall motion, detectable by visual inspection using cross-sectional echocardiography, suggest that these forms of imaging are more sensitive in detecting early regional dysfunction. Regional abnormalities may precede global impairment, and are an early sign of ventricular dysfunction, a finding that may have important therapeutic implications. Indeed, early detection and treatment of ventricular dysfunction may prevent the development of clinical heart failure in these patients for many years.
Different contributing factors have been blamed for right ventricular dysfunction after the atrial redirection procedure, for example, the unsuitable anatomy of the morphologically right ventricle to cope with systemic pressures, myocardial damage due to preoperative hypoxia in association with excessive volume and pressure load, and preoperative myocardial ischeamia.6, 7, 10, 29 Associated volume load by progressive tricuspid valvar regurgitation often causes additional myocardial dysfunction.10, 29 Postoperative defects of myocardial perfusion have also been noted, albeit that their functional significance is presently uncertain.30 Our population is quite homogenous concerning medical and surgical management, and patients with additional lesions other than mild tricuspid regurgitation were excluded from the study. This reduces the influence of additional volume load on the measurements. There is currently no good non-invasive technique to measure right ventricular contractility, but the reduced strain rate in the right ventricular free wall suggest a reduced longitudinal right ventricular systolic function in this group of patients. An alternative explanation is that the reduced longitudinal systolic function reflects a physiological adaptation of the systemic morphologically right ventricle to chronically increased afterload. In this respect, it is interesting to note that the normally observed inhomogeneity in peak systolic strain rate and systolic strain in the right ventricular free wall is not found in the right ventricles of patients after a Senning procedure. This could be explained by rearrangement of the right ventricular fibres.30–32 Studies of the orientation of the myofibres in the ventricular mass have shown that, in the right ventricle of patients after an atrial redirection procedure, there is an additional thick circumferential muscular layer in between the normal oblique epicardial and longitudinal endocardial right ventricular muscular layers (Siew Yen Ho, personal communication, 2004). It might be that an increased radial function compensates for the decreased longitudinal function in these patients. Unfortunately, it is technically very difficult to assess right ventricular radial function using the current technology, as the right ventricular anterior wall is in the near-field of the echobeam, with poor spatial resolution and a lot of artefacts. This might also explain the contradiction between our findings and those from Redington33 and colleagues, who demonstrated that right ventricular contractility in patients assessed using pressure/volume loops after the Mustard procedure was essentially comparable to normal left ventricular contractility. Thus, assessments of regional function in one dimension must be interpreted with care. Further study is required to look at long-term effects of decreased longitudinal function. Ideally, myocardial deformation should be assessed in all three dimensions.
It is interesting to note that similar differences in regional strain and in regional wall motion have also been demonstrated in systemic right ventricles after an atrial redirection procedure by magnetic resonance imaging tagging techniques.34 The authors suggest that geometric changes and fibre angle reorientation induced by the altered loading conditions of the ventricle may play a role in these findings.
Correlation between right ventricular ejection fraction and longitudinal systolic strain
Since it is very difficult to assess right ventricular contractility non-invasively, right ventricular ejection fraction is widely used as a parameter for quantification of global right ventricular function in patients with systemic right ventricles.8, 29 This is done despite the known limitation that ejection fraction is dependent on preload and afterload. In the context of the atrial redirection operation, this is a significant limitation, as loading conditions of the systemic right ventricle are significantly altered. Firstly, afterload is increased. Secondly, preload is chronically reduced because atrial baffles limit ventricular filling.35, 36 During the follow-up, preload can change due to progressive tricuspid regurgitation. Despite these known variables in loading conditions, ejection fraction probably remains the best parameter currently available for clinical use. As known from animal studies, global ejection fraction and regional systolic strain correlate linearly over a wide range of inotropic states and heart rates in normal myocardium.25 We also found a strong correlation between regional strain and ejection fraction, although there were no regional abnormalities of wall motion as revealed by cross-sectional echocardiography. Similar observations were made in a recent study of patients after myocardial infarction.37 The lowest systolic strain values, and the lowest ejection fraction, in the 2 patients who were on lisinopril because of right ventricular dysfunction as assessed visually by cross-sectional echocardiography also confirm this correlation. These patients, however, belong to the worst end of the spectrum, and the very low values for ejection fraction are a late sign of ventricular dysfunction.
Systolic left ventricular function after the Senning procedure
Left ventricular longitudinal deformation properties are significantly lower in most of the segments of the subpulmonary left ventricle when compared to values for the normal left ventricle. In a normal subpulmonary right ventricle, properties of deformation are higher compared to the systemic left ventricle. This suggests a reduced longitudinal left ventricular function. Radial deformation of the left ventricle is also reduced compared to normal values after the Senning procedure. In normal individuals, radial peak systolic strain rate, and systolic strain, is higher compared to longitudinal values. The same relationship between longitudinal and radial deformation is present in the left ventricle after the Senning procedure. This suggests that the normal predominance of circumferential fibre function is preserved in the subpulmonary moon-shaped left ventricle.21 Left ventricular function has been described as reduced in previous studies.9, 29 This has been ascribed to perioperative myocardial damage, or to the decreased filling that is the consequence of atrial redirection. The decreased properties of left ventricular deformation might be of importance when considering training the left ventricle for a double switch procedure.
Limitations
Ideally, strain rate and strain should be correlated with invasive parameters of contractile function, like dp/dt or the end-systolic pressure–volume relationship. Since the patients included in the present study are clinically asymptomatic, it would be unethical to catheterize them simply for the purpose of research. As there is no other good technique for assessing right ventricular function, cardiac magnetic resonance imaging was the next best option.
Currently ultrasonically derived strain rate and strain imaging offers a one-dimensional assessment of regional strain rate and strain in the radial direction for the left ventricle, and/or the longitudinal direction, the latter available for both ventricles. In theory, deformation of the heart should be measured in three dimensions, including radial and circumferential strain. In normal children, radial deformation can only be quantified from the posterior wall of the left ventricle, since the right ventricular anterior wall is too close to the transducer, and because the normal right ventricle is too thin to determine accurately the spatial velocity gradient. Additionally, calculation of regional radial strain rate from the septum and the right ventricular free wall is very difficult, as these segments have low velocities for the radial direction, with a low ratio of signal to noise, which is further amplified when making the calculation. Using the current technology, it is not possible to measure circumferential strain or torsion.
Another limitation inherent to the Doppler-based technique is the angle dependency of the velocity signal. Care was taken to align the ultrasound beam as best possible with the direction of myocardial deformation interrogated. Hopefully imaging of strain rate in two dimensions will overcome this limitation.
Acknowledgements
We thank Jan D'hooge and Piet Claus for their contribution to the development of the Speqle-software package for strain rate and strain analysis, and their generous help with the present study. This research was supported by a grant from the Belgian Foundation for Research in Pediatric Cardiology and by a grant from the Foundation for Scientific Research (FWO Levenslijn grant 7.0024.98). L.M. is a clinical researcher for the Fund for Scientific Research (FWO).
References
Birnie D, Tometzki A, Curzio J, et al. Outcomes of transposition of the great arteries in the era of atrial inflow correction. Heart 1998; 80: 170–173.Google Scholar
Oechslin E, Jenni R. 40 Years after the first atrial switch procedure in patients with transposition of the great arteries: long-term results in Toronto and Zurich. Thorac Cardiovasc Surg 2000; 48: 233–237.Google Scholar
Sarkar D, Bull C, Yates R, et al. Comparison of long-term outcomes of atrial repair of simple transposition with implications for late arterial switch strategy. Circulation 1999; 100 (Suppl 19): I76–I81.Google Scholar
Turina MI, Siebenmann R, von Segesser L, Schonbeck M, Senning A. Late functional deterioration after atrial correction for transposition of the great arteries. Circulation 1989; 80: I162–I167.Google Scholar
Von Segesser L, Fry M, Senning A, Turina MI. Atrial repair for transposition of the great arteries: current approach in Zurich based on 24 years of follow-up. Thorac Cardiovasc Surg 1991; 39 (Suppl 2): 185–189.Google Scholar
Kirjavainen M, Happonen JM, Louhimo I. Late results of Senning operation. Thorac Cardiovasc Surg 1999; 117: 488–495.Google Scholar
Labbe L, Douard H, Barat JL, et al. Alteration of myocardial viability and systemic ventricular dysfunction after Senning procedure. Arch Mal Coeur Vaiss 1997; 90: 631–637.Google Scholar
Martin RP, Qureshi SA, Ettedgui JA, et al. An evaluation of right and left ventricular function after anatomical correction and intra-atrial repair operations for complete transposition of the great arteries. Circulation 1990; 82: 808–816.Google Scholar
Reich O, Voriskova M, Ruth C, et al. Long-term ventricular performance after intra-atrial correction of transposition: left ventricular filling is the major limitation. Heart 1997; 78: 376–381.Google Scholar
Helbing WA, Hansen B, Ottenkamp J, et al. Long-term results of atrial correction for transposition of the great arteries. Comparison of Mustard and Senning operations. J Thorac Cardiovasc Surg 1994; 108: 363–372.Google Scholar
Lidegran M, Odhner L, Jacobsson LA, Geitz D, Lundell B. Magnetic resonance imaging and echocardiography in assessment of ventricular function in atrially corrected transposition of the great arteries. Scand Cardiovasc J 2000; 34: 384–389.Google Scholar
Helbing WA, Rebergen SA, Maliepaard C, et al. Quantification of right ventricular function with magnetic resonance imaging in children with normal hearts and with congenital heart disease. Am Heart J 1995; 130: 828–837.Google Scholar
Heimdal A, D'hooge J, Bijnens B, Sutherland GR, Torp H. In vitro validation of in-plane strain rate imaging. A new ultrasound technique for evaluating regional myocardial deformation based on tissue-Doppler imaging. Echocardiography 1998; 15: s40 (Abstr).Google Scholar
Miyatake K, Yamagishi M, Tanaka N, et al. New method for evaluating left ventricular wall motion by colour-coded tissue-Doppler imaging: in vitro and in vivo studies. J Am Coll Cardiol 1995; 25: 717–724.Google Scholar
Urheim S, Edvardsen T, Torp T, Angelsen B, Smiseth O. Myocardial strain by Doppler echocardiography. Validation of a new method to quantify regional myocardial function. Circulation 2000; 102: 1158–1164.Google Scholar
Gorcsan J III, Strum DP, Mandarino WA, Gulati UK, Pinsky MR. Quantitative assessment of alterations in regional left ventricular contractility with colour-coded tissue-Doppler echocardiography. Comparison with sonomicrometry and pressure–volume relations. Circulation 1997; 95: 2423–2433.Google Scholar
D'hooge J, Heimdal A, Jamal F, et al. Regional strain and strain rate measurements by cardiac ultrasound: principles, implementation and limitations. Eur J Echocardiogr 2000; 1: 154–170.Google Scholar
Heimdal A, Stoylen A, Torp H, Skjaerpe T. Real-time strain rate imaging of the left ventricle by ultrasound. J Am Soc Echocardiogr 1998; 11: 1013–1019.Google Scholar
Isaaz K. What are we actually measuring by Doppler tissue imaging? J Am Coll Cardiol 2000; 36: 897–899.Google Scholar
Abraham TP, Nishimura RA. Myocardial strain: can we finally measure contractility? J Am Coll Cardiol 2001; 37: 731–734.Google Scholar
Weidemann F, Eyskens B, Jamal F, et al. Quantification of regional left and right ventricular radial and longitudinal function in healthy children using ultrasound-based strain rate and strain imaging. J Am Soc Echocardiogr 2002; 15: 20–28.Google Scholar
Kapusta L, Thijssen JM, Cuypers MHM, Peer PGM, Daniels O. Assessment of myocardial velocities in healthy children using tissue Doppler imaging. Ultrasound Med Biol 1999; 26: 229–237.Google Scholar
Weidemann F, Eyskens B, Mertens L, et al. Quantification of regional right and left ventricular function by ultrasonic strain rate and strain indices in Friedreich's ataxia. Am J Cardiol 2003; 91: 622–626.Google Scholar
Weidemann F, Eyskens B, Mertens L, et al. Quantification of regional right and left ventricular function by ultrasonic strain rate and strain indexes after surgical repair of tetralogy of Fallot. Am J Cardiol 2002; 90: 133–138.Google Scholar
Weidemann F, Jamal F, Sutherland GR, et al. Myocardial function defined by strain rate and strain during alterations in inotropic states and heart rate. Am J Physiol Heart Circ Physiol 2002; 283: 792–799.Google Scholar
Snider AR, Serwer GA, Ritter SB. Methods for obtaining quantitative information from the echocardiographic examination. In: Echocardiography in Pediatric Heart Disease, 2nd edn. Mosby-Year Book, London, 1997, pp 187–190.
Skulstad H, Edvardsen T, Urheim S, et al. Postsystolic shortening in ischemic myocardium: active contraction or passive recoil? Circulation 2002; 106: 718–724.Google Scholar
Greenberg NL, Firstenberg MS, Castro PL, et al. Doppler-derived myocardial systolic strain rate is a strong index of left ventricular contractility. Circulation 2002; 105: 99–105.Google Scholar
Penkoske PA, Westerman GR, Marx GR, et al. Transposition of the great arteries and ventricular septal defect: results with the Senning operation and closure of the ventricular septal defects in infants. Ann Thorac Surg 1983; 36: 281–288.Google Scholar
Lubiszewska B, Gosiewska E, Hoffman P, et al. Myocardial perfusion and function of the systemic right ventricle in patients after atrial switch procedure for complete transposition: long-term follow-up. J Am Coll Cardiol 2000; 36: 1365–1370.Google Scholar
Geva T, Powell AJ, Crawford EC, Chung T, Colan SD. Evaluation of regional differences in right ventricular systolic function by acoustic quantification echocardiography and cine magnetic resonance imaging. Circulation 1998; 98: 339–345.Google Scholar
Naito H, Arisawa J, Harada K, Yamagami H, Kozuka T, Tamura S. Assessment of right ventricular regional contraction and comparison with the left ventricle in normal humans: a cine magnetic resonance study with presaturation myocardial tagging. Br Heart J 1995; 74: 186–191.Google Scholar
Redington AN. The Mustard and Senning procedures: assessment of right ventricular performance. In: The Right Heart in Congenital Heart Disease. Greenwich Medical Media Ltd, London, 1998, pp 203–208.
Fogel MA, Weinberg PM, Fellows KE, Hoffman EA. A study in ventricular–ventricular interaction. Single right ventricles compared with systemic right ventricles in a dual-chamber circulation. Circulation 1995; 92: 219–230.Google Scholar
Wyse RK, Macartney FJ, Rohmer J, Ottenkamp J, Brom AG. Differential atrial filling after Mustard and Senning repairs. Detection by transcutaneous Doppler ultrasound. Br Heart J 1980; 44: 692–698.Google Scholar
Nascimento R, Cunha DL, Bastos P, Vanzeller P, Rodrigues-Gomes M. Echo-study of right ventricular filling in asymptomatic patients with Senning operation for transposition of the great arteries. Am J Cardiol 1991; 68: 693–695.Google Scholar
Götte MJW, van Rossum AC, Twisk JWR, Kuijer JPA, Marcus JT, Visser CA. Quantification of regional contractile function after infarction: strain analysis superior to wall thickening analysis in discriminating infarct from remote myocardium. J Am Coll Cardiol 2001; 37: 808–817.Google Scholar

Longitudinal motion and deformation of the systemic right ventricle in a patient after a Senning repair. The velocity (a), strain rate (b) and strain curves (c) over one heart cycle are extracted from the basal, midwall and apical segments of the systemic right ventricular free wall. Note that there is a base–apex gradient for the velocity with the highest velocities at the cardiac base and lowest velocities at the apex. In contrast the strain rate and strain profiles were homogeneous in the three different segments. AVC: aortic valve closure; RV: right ventricle; LV: left ventricle; RA: right atrium; LA: left atrium.

(a) Cross-sectional colour Doppler myocardial imaging obtained from a parasternal short axis at midpapillary level. The arrow indicates the area of computation from where the strain rate curve was extracted. (b) Strain rate profile for left ventricular radial deformation, derived from the left ventricular posterior wall. (c) Radial strain profile from the left ventricular posterior wall. IVR: isovolumic relaxation time; SR: strain rate; ε: strain.

Comparison (a) of longitudinal motion (peak systolic velocity) and deformation (peak systolic strain rate and systolic strain) between the systemic right ventricle of patients who have undergone the Senning procedure and the subpulmonary right ventricle of normals. Results are displayed for the basal, midwall and apical segment of the right ventricular free wall. For a better visualization, the Y-axis of the strain rate and strain figure is inverted. Another comparison (b) is made of longitudinal motion (peak systolic velocity) and deformation (peak systolic strain rate and systolic strain) between the systemic right ventricle of patients who have undergone the Senning procedure, and the systemic left ventricle of normals. Results are displayed for the basal, midwall and apical segment of each wall. For a better visualization the Y-axis of the strain rate and strain figure is inverted. *p < 0.05 vs. normals. LV: left ventricle; RV: right ventricle.
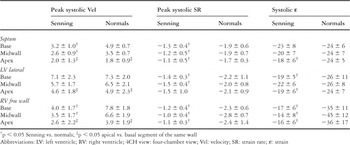
Table 1.

Results of the radial motion (peak systolic velocity) and deformation (peak systolic strain rate and systolic strain) of the left ventricular posterior wall in patients after a Senning repair and normals. Note that peak systolic velocity is increased after the Senning procedure, probably due to tethering effects of the right ventricle. In contrast peak systolic strain rate and systolic strain are significantly reduced in these patients indicating impaired left ventricular radial function. *p < 0.05 vs. normal. Vel: velocity; SR: strain rate; ε: strain.

Pearson's correlation between right ventricular ejection fraction (assessed by magnetic resonance imaging) and longitudinal systolic strain of the basal right ventricular free wall segment. The grey bullets indicate the 2 patients with right ventricular dysfunction, visually assessed on cross-sectional echocardiography. These patients also have the lowest strain values. RV: right ventricle.
 You have
Access
- 58
- Cited by