I. INTRODUCTION
Thermoelectric (TE) phenomena involve the conversion between waste heat and electrical energy and have therefore attracted much interest in the research society owing to its vast applications. The efficiency of a TE material is judged by its figure of merit, ZT = α2σT/κ, where α is the Seebeck coefficient, σ is the electrical conductivity, κ is the thermal conductivity, and T is the absolute temperature. Electrical power generation from waste heat, e.g., in cars, aircrafts, and power plants, requires high stability TE materials with high figures of merit ZT at temperatures above 600 K, and therefore, oxide materials are promising in this regard due to their nontoxicity, high oxidation resistance, and thermal stability at high temperatures. Ca3Co4O9 is among the most promising p-type oxide materials for high temperature TE applications, with the figure-of-merit (ZT) obtained for a single crystal reaching as high as 0.83 at 1000 K. Reference Shikano and Funahashi1 Although many advanced applications require large-size Ca3Co4O9 single crystals, they are difficult to fabricate owing to the strong anisotropy in the crystal growth and electrical properties. Owing to this fact, a large amount of research has been carried out on improving the TE properties of randomly oriented polycrystalline Ca3Co4O9 ceramics, but with very limited improvement. Reference Yang, Yu, Jinguang, Xianjie and Wenhui2–Reference Liu, Lin, Jiang, Nan and Shen5 Therefore, several efforts have been made to improve the texture of Ca3Co4O9 ceramic by various methods, such as spark plasma sintering, Reference Zhang, Zhang and Lu6 magnetic alignment, Reference Zhou, Matsubara, Horii, Takeuchi, Funahashi, Shikano, Shimoyama, Kishio, Shin, Izu and Murayama7 and hot-forging processes, Reference Prevel, Lemonnier, Klein, Hebert, Chateigner, Ouladdiaf and Noudem8 owing to a general belief that the grain boundaries negatively affect the electrical conductivity and hence the TE properties of this system. The epitaxial growth and c-axis-oriented films fabricated using the pulsed laser deposition (PLD), Reference Qiao, Gulec, Paulauskas, Kolesnik, Dabrowski, Ozdemir, Boyraz, Mazumdar, Gupta and Klie9,Reference Sun, Hng, Yan and Ma10 radio-frequency magnetron sputtering, Reference Sakai, Kanno, Yotsushashi, Odagawa and Adachi11 and the topotactic ion exchange method Reference Sugiura, Ohta, Nomura, Hirano, Hosono and Koumoto12 have proven to be successful in improving the TE properties of this system. The thin film approach not only holds the potential of reducing the thermal conductivity of the system through lattice mismatch and the introduction of various scattering centers in the film but can also result in the enhancement of thermopower through structures such as superlattices and quantum wells. Reference Hicks and Dresselhaus13
A large power factor, α2σ enhancement was reported for PbTe and PbSe thin films comprising of 3-dimensional island formations. A large electrical conductivity, σ, and carrier mobility, μ, in these thin film systems were explained by the self-ordering of islands in the growing thin film. These studies inspired us to study the island mode of thin film growth and the factors influencing the density, size, and distribution of these islands in Ca3Co4O9 thin film system. The goal of the present work is to study the TE properties of Ca3Co4O9 ultrathin film in their island growth mode. In this study, we used the PLD technique to deposit Ca3Co4O9 and Ca2.8Bi0.2Co4O9 thin films on a LaAlO3 (LAO) substrate. Bismuth was chosen as a dopant because Bi substitution has been proven to be effective in increasing thermopower (α) while maintaining electrical conductivity (σ) in the bulk counterpart of this system, Reference Xu, Funahashi, Shikano, Matsubara and Zhou3–Reference Liu, Lin, Jiang, Nan and Shen5 as well as in single crystals Reference Mikami, Chong, Miyazaki, Kajitani, Inoue, Sodeoka and Funahashi14 and thin films. Reference Sun, Hng, Yan and Ma15,Reference Zhou, Matsubara, Shin, Izu and Murayama16
II. EXPERIMENTAL
Ca3Co4O9 and Ca2.8Bi0.2Co4O9 (denoted as CCO and CB02 respectively) thin films were prepared on a (001)-oriented perovskite-based substrate, LaAlO3 (LAO), at substrate temperatures between 550 and 750 °C and 10 Pa oxygen pressure with a Nd: YAG laser (Lab-170, λ = 355 nm). The laser energy density and repetition rate were fixed at 0.15 J/cm2/pulse and 10 Hz, respectively. The ceramic targets were synthesized through the solid state reaction method as follows: The oxide powders, namely, CaCO3 (≥99%, Sigma Aldrich, Castle Hill, NSW, Australia), Co3O4 (99.995%, Sigma Aldrich), and Bi2O3 (≥99.5%, Sigma Aldrich), in their required ratios were mixed together in a planetary ball mill for 12 h and then calcined at 700 °C/12 h. After cooling down, this powder mixture was again ball milled for 5 h and calcined again at 700 °C/20 h. The powder was then compacted into pellets in the form of 1-inch diameter disks under a pressure of 40 MPa and then sintered at a temperature of 750 °C for 20 h, with the sintering procedure repeated twice.
The phase purity of the final target samples as well as that of the thin films was detected by x-ray diffraction (XRD) analysis by means of a GBC MMA diffractometer with a Cu Kα radiation source (λ = 0.154 nm). The surface roughness of the thin films was characterized by an atomic force microscope (AFM; Asylum Research MFP-3D SA, Santa Barbara, CA). The surface topographies of the thin films were examined by using a scanning electron microscope (SEM; JEOL7500 FA, New South Wales, Australia) and the SEM images were analyzed using ImageJ software. The TE properties of Ca3Co4O9/LAO and Ca2.8Bi0.2Co4O9/LAO were determined using a physical properties measurement system (PPMS, Quantum Design, San Diego, CA) configured with the thermal transport option (TTO) in zero magnetic field from 50 to 350 K. The sample preparation for PPMS involved attaching four leads to the sample with a conducting epoxy.
III. RESULTS AND DISCUSSION
A. Fabrication and characterization
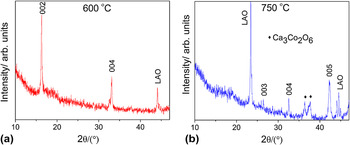
Substrate temperature is known to be a critical parameter in the thin film fabrication, and therefore, its optimization is necessary. Reference Ohtake, Nukaga, Kirino and Futamoto17,Reference Sathyamoorthy, Narayandaas and Mangalaraj18 Initially, Ca3Co4O9 thin film was fabricated on the LAO substrate at three different substrate temperatures, i.e., 550, 600, and 750 °C. All the parameters except the substrate temperature were kept constant. For the thin film deposited at 550 °C, the crystallinity was found to be quite poor. This can be attributed to the PLD kinetics, where high substrate temperature can provide sufficient surface diffusion to allow surface atoms to migrate toward thermodynamically stable sites and crystallize. Reference Sun, Hng, Yan and Ma10 Therefore, increasing the substrate temperature to 600 °C improved the crystallinity of the film, as seen in the XRD pattern [Fig. 1(a)], which shows diffraction peaks corresponding to only (001) Ca3Co4O9 film reflections or reflections from the substrate. The XRD pattern therefore shows a dominant c-axis alignment with no evidence of the secondary phase in this film. Increasing the substrate temperature further to 750 °C partly decomposed the Ca3Co4O9 phase into Ca3Co2O6 phase, Reference Zhang, Zhang, Lu and Zhang19 with reflections marked in the XRD pattern [Fig. 1(b)].
XRD patterns of pure Ca3Co4O9 (CCO) thin films deposited on LAO substrate at a substrate temperature of (a) 600 °C and (b) 750 °C.

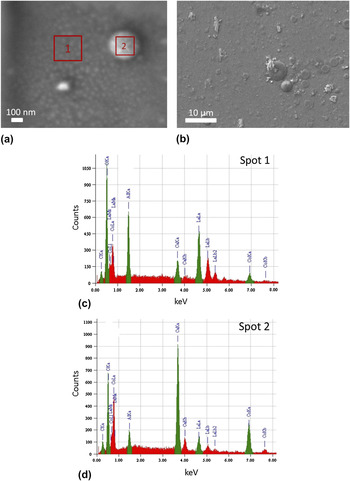
Several kinds of growth modes and characteristic structures can be observed during the deposition of atoms on a flat substrate. Reference Gilmer, Huang and Roland20 A layer-by-layer or an epitaxial growth mode is called the Frank–van der Merwe mode (FM). However, sometimes the FM structure is found to exhibit undulations in the thickness, which is an indication of the uniform film being unstable. This leads to an eventual breakup of the FM film structure into a Stranski–Krastanov mode (SK) or Volmer–Weber mode (VW). The SK growth method is observed in our Ca3Co4O9 thin film. It is described as an initial 2D growth of a few monolayers with grains oriented in a (001) orientation [Fig. 2(a)], followed by 3D cluster/island growth on these monolayers [Fig. 2(b)]. In the literature, different kinds of growth modes such as VW Reference Sun, Hng, Yan and Ma10 and columnar Reference Cieniek and Kac21 have been achieved for the PLD deposited Ca3Co4O9 system apart from the epitaxial growth. Reference Hu, Si, Sutter and Li22
SEM micrographs of the surface of the thin Ca3Co4O9 film showing (a) the initial 2D growth of monolayers with grains aligned in a (001) orientation, and (b) lower magnification image of the film showing the 3D cluster growth. (c) and (d) are the EDS spectra collected from Spot 1 and Spot 2 of (a), respectively.

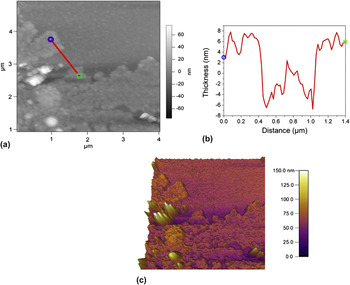
AFM images of the as-grown Ca3Co4O9 thin film also confirm the SK growth structure. A height profile of the 2D thin film was taken over the location indicated in the AFM image in Fig. 3(a). A 1.4-μm long line profile in Fig 3(b) shows that the thickness of the 2D thin film is ∼14 nm, and the clusters are an average of ∼90 nm high. Energy dispersive spectroscopy (EDS) spectra were collected from different spots on the thin film, and it was observed that the clusters were comprised of Ca x CoO2 phase along with excess Ca. For example, the EDS spectra in Figs. 2(c) and 2(d) were taken from the thin film and the cluster, respectively, and clearly exhibit the difference in the Ca content between the two spots. A similar result was reported by Cieniek et al. Reference Cieniek and Kac21 in their study of (Co, Ca)O PLD thin films, as they also observed Ca rich droplets on their thin films, the origin of which is not very clear. From the quantitative EDS data, the cation ratio of the 2D part of the thin film (Spot 1) was determined to be Ca:Co = 3:4.1, which shows that the stoichiometry in the thin film is maintained. It is stated in the literature Reference Sun, Hng, Yan and Ma10 that during the PLD synthesis, the Ca x CoO2 structure forms first, particularly at the boundaries of nuclei with high defect density. The Ca to Co cationic ratio from Spot 2 (clusters) is determined to be 1.16:1. Although, the elemental composition of Ca x CoO2 lies between 0.26 ≤ x ≤ 0.5, Reference Sun, Hng, Yan and Ma10 it is also known that excess Ca exists when Ca x CoO2 phase is formed on the substrate. This could explain the excess Ca in the clusters. However, if given enough ripening time during the coalescence process of the nuclei, a well-aligned CCO thin film can be formed. In a different process, Ca x CoO2 can also combine with ambient Ca and oxygen and transform into the CCO structure, again giving us a well-textured CCO thin film. Following the above argument, the clusters can be thought of as the initial formation of the CCO structure, and therefore, they consist of Ca x CoO2 phase along with excess Ca as indicated by EDS analysis.
(a) AFM images of the Ca3Co4O9 thin film on LAO substrate deposited at a substrate temperature of 600 °C. (b) Height profile of the 2D thin film taken over the location indicated by the red line in the AFM image in (a). (c) Three dimensional AFM image of the thin film.

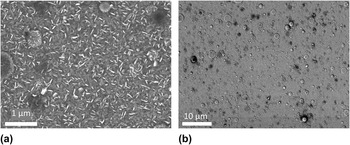
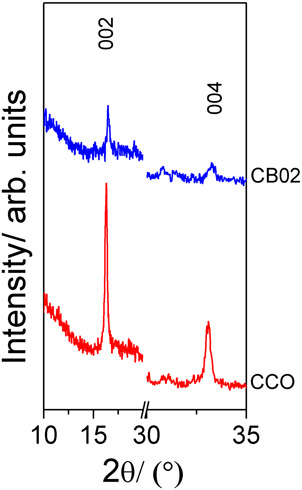
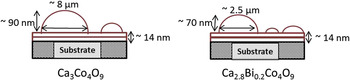
Ca3Co4O9 thin film with 2 at.% Bi doping was also deposited on the LAO substrate. The SEM micrographs in Fig. 4 show the surface morphology of the Ca2.8Bi0.2Co4O9 thin film. Compared to the pure Ca3Co4O9 thin film [Figs. 2(a) and 2(b)], Bi doping not only results in increased grain size [see Fig. 4(a)] but also increases the cluster density in the film [see Fig. 4(b)]. The XRD pattern (Fig. 5) shows the decrease in the peak intensity as well as the broadening of the peaks due to the Bi doping. This deterioration of film crystallinity can be a result of the high cluster density in the Ca2.8Bi0.2Co4O9 thin film. The cluster size, on the other hand, is observed to be much smaller than for the Ca3Co4O9 thin film. Fig. 6 illustrates the average dimensions of the largest clusters observed in both films, along with the variation in film thickness as observed from the AFM and SEM analyses. The average diameter and the average height of the largest cluster for Ca2.8Bi0.2Co4O9 are found to be ∼70% and 22% lower than the ones observed for the Ca3Co4O9 thin film, respectively. No apparent change was detected in the thickness of the 2D monolayers in both kinds of films, which was observed to be ∼14 nm. As both thin films were deposited under the exact same conditions, as well as for the same time, therefore, the difference in the morphology can be considered to be due to the presence of Bi in the system. It appears that Bi doping reduces the amplitude of the undulations and, hence, restricts the ripening of the clusters. Therefore, the merging of the smaller clusters into the larger ones is impeded, and thus, the process does not allow the average cluster size to increase. Reference Gilmer, Huang and Roland20 This argument explains the large number of relatively small clusters observed in Ca2.8Bi0.2Co4O9 thin films. This kind of incomplete cluster coalescence also leads to pinhole formation Reference Chang, Wu, Ramesh, Xi, Ravi, Venkatesan, Hwang, Muenchausen, Foltyn and Nogar23,Reference Hafez, Elamrawi and Elsayed-Ali24 which can be seen as the dark spots in Fig. 4. These pinholes (∼50 nm to 2 μm in size) are expected to further reduce the thermal conductivity due to increased phonon scattering.
(a) High and (b) low magnification SEM micrographs of the surface of Ca2.8Bi0.2Co4O9 thin film deposited on LAO substrate, illustrating the grain size and the cluster density in the film.

XRD patterns showing two most prominent peaks, (002) and (004), of Ca3Co4O9 (CCO) and Ca2.8Bi0.2Co4O9 (CB02) thin films.

A Schematic illustration of the differences in surface morphology between the two studied thin film families.

B. TE properties of CCO and CB02 thin films
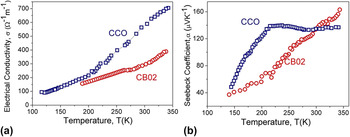
Figure 7(a) shows the electrical transport and Seebeck coefficient for the undoped and Bi-doped samples. The trend in the electrical conductivity in our films indicates semiconductor-type transport in the temperature range studied. This behavior is very different from the one observed in the literature, Reference Sugiura, Ohta, Nomura, Hirano, Hosono and Koumoto12 which is metallic for the temperatures between ∼100 and 400 K. Also, our values for σ350K are 705 and 388/Ω/m for Ca3Co4O9 and Ca2.8Bi0.2Co4O9 thin films, respectively, which are lower than earlier reported values, Reference Ohta, Sugiura and Koumoto25 the basic reason for which can be suggested as the island formation of the film. Now, as the effective 2D film thickness is very low in our case, therefore, a contribution of electrical conduction from the clusters is also expected and cannot be neglected. These clusters, as discussed in Sec. III. A, are considered to consist of the Ca x CoO2 phase, which has higher electrical resistivity than Ca3Co4O9 phase, although both have layered structures. Reference Sun, Ma, Yan, Huang, Wang and Hng26,Reference Kanno, Yotsuhashi and Adachi27 The clusters present in our thin films also represent areas of dislocation and incomplete nucleation and, hence, might act as carrier-scattering centers decreasing carrier mobility. We propose that the conduction in our thin films takes place through a temperature-activated hopping mechanism in the temperature range measured. During the conduction process, the holes are eventually trapped at structural defects, which are the clusters in our case, and the transport continues as a tunneling from one defect to another, causing the unusual transport phenomena. Reference Hughes28
Temperature dependence of (a) electrical conductivity (σ) and (b) Seebeck coefficient (α) for Ca3Co4O9 and Ca2.8Bi0.2Co4O9 thin films.

Another point to note is that unlike the earlier reported work, Bi doped film is more resistive than the pure Ca3Co4O9 thin film [Fig 7(a)]. It is known that with Bi doping, the effective carrier concentration decreases due to the Bi+3 substitution for divalent Ca+2 in the (Ca2CoO3) layers, which inject electrons into the conductive (CoO2) layer. Reference Sun, Hng, Yan and Ma15 Therefore, the increase in conductivity due to Bi doping has been reported to take place due to the improvement in the charge carrier mobility and not through increased carrier concentration. Reference Xu, Funahashi, Shikano, Matsubara and Zhou3 However, this does not seem to be happening in our case. This can be related to the increase in the cluster density as a result of Bi doping. It was shown that the trapping rate of the holes is directly proportional to the concentration of trapping sites (in our case, clusters) and the radius of trapping sites. Reference Hughes28 As the increase in cluster density with Bi doping is much higher than the reduction in the cluster radius, therefore, we can assume that the increase in resistivity is mainly caused by the larger number of clusters, which consequently increases the number of defect sites and dislocations in the structure of the film.
The room temperature Seebeck coefficient [Fig. 7(b)] for our Ca3Co4O9 and Ca2.8Bi0.2Co4O9 thin films is found to be 136 and 163 μ V/K, respectively, which is among the largest α300K reported for Ca3Co4O9 thin films. Reference Zhou, Matsubara, Shin, Izu and Murayama16 Such a high Seebeck coefficient compensates for the lower electrical conductivity and results in a reasonable power factor of α2σ300K ≈ 0.13 × 10⁻⁴ W/m/K2 for CCO and α2σ300K ≈ 0.1 × 10⁻⁴ W/m/K2 for CB02 thin film. These values fit well among those reported previously for this system. Reference Sugiura, Ohta, Nomura, Hirano, Hosono and Koumoto12,Reference Sun, Hng, Yan and Ma15 Furthermore, the Seebeck coefficient of CB02 thin film increases almost linearly with increasing temperature. Now, similar to the Drude picture, the Seebeck coefficient of the Ca3Co4O9 system can be expressed as α ≈ c e/n, Reference Sun, Hng, Yan and Ma15 where c e is the electronic specific heat and n is the carrier concentration. As n is known to decrease with Bi doping, the increase in α due to the Bi doping is expected. Also, a large thermopower in our thin films can be explained on the basis of the fact that the Seebeck coefficient for a given carrier density n increases as the scattering parameter increases. Reference Heremans, Thrush and Morelli29 The presence of resistive clusters surrounded by defects and dislocations, which are considered as trap sites for holes, can be considered a source of efficient sites for filtering the charge carriers having lowest energies, resulting in a large Seebeck coefficient. Further power factor enhancements could be achieved by tuning the thickness of the thin film. Inhomogeneous thin film consisting of conducting and nonconducting constituents has been observed to exhibit an abrupt increase in electrical conductivity within a narrow thickness range, which is explained by percolation theory by some authors. Reference Rogacheva, Nashchekina, Vekhov, Dresselhaus and Cronin30 A sharp growth in carrier mobility and electrical conductivity is expected during the transition from island mode to continuous thin film. A detailed work constituting the dependence of TE properties on varying thickness of the Ca3Co4O9 ultrathin film is ongoing.
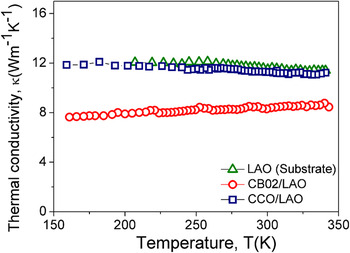
The obtained values of thermal conductivity (κ) are measured as a whole parameter (Fig. 8), i.e., the thin film plus the substrate. We see that the major κ contribution in the CCO and CB02 thin films comes from the LAO substrate with κ350K ≈ 11.4 W/m/K. The carrier contribution κcarr toward total κ was calculated using the relation Reference Yang, Yu, Jinguang, Xianjie and Wenhui2 :
 $${\rm{\kappa }}_{{\rm{carr}}} = {{L_0 T} \over {\rm{\rho }}}{\rm{\kappa }}_{{\rm{carr}}} = {{L_0 T} \over {\rm{\rho }}}\quad ,$$
where, L 0 is the Lorenz number, whose value is 2.44 × 10⁻⁸ W Ω/K2, T is the temperature in Kelvin, and ρ is the electrical resistivity in Ω-m. The values of carrier thermal conductivity κcarr are calculated to be very low, i.e., less than ∼0.005 W/m/K and ∼0.003 W/m/K for CCO and CB02, respectively. Even though the κcarr for CB02 is ∼30% lower than for CCO, we still observe a lower κtotal of ∼8.5 W/m/K for CB02/LAO compared with the κtotal of ∼11.2 W/m/K for CCO/LAO. These figures indicate that the CB02/LAO sample has a significantly larger number of phonon scattering centers as compared with the CCO/LAO thin film. This again can be easily related to the presence of a higher cluster density as well as the presence of pinholes in the CB02 thin film. These figures are quite figurative and to determine the real thermal conductivity of the individual films, a special measurement technique is required which can separate the thermal conductivity contribution of the substrate from that of the actual thin film. This additional information would provide important information on the intrinsic thermoelectrical properties of Ca-349 thin films having a SK formation.
Temperature dependence of thermal conductivity of the CCO and CBO2 thin films on LAO substrate along with the thermal conductivity of the substrate for comparison.

IV. CONCLUSION
In this study, Ca3Co4O9 and Ca2.8Bi0.2Co4O9 thin films were fabricated on LAO substrate using the PLD technique with varying substrate temperatures between 500 and 750 °C, with samples deposited at 600 °C being selected as representatives. The growth mode in our thin films was observed to be SK mode, in which the structure consists of initial 2D thin layers followed by the growth of 3D clusters/islands. The effective film thickness was determined to be ∼14 nm for both groups of thin films. Bi-doped samples showed a considerably higher density of clusters as compared with undoped samples. Owing to this cluster growth, a peculiar electrical conductivity trend was observed in our thin films where conductivity increased with temperature in the temperature range studied. We report a very high room temperature Seebeck coefficient for both thin films with values of 136 and 163 μ V/K for CCO and CB02, giving us a considerable high power factor of ∼0.13 × 10⁻⁴ W/m/K2 for CCO and α2σ300K ≈ 0.1 × 10⁻⁴ W/m/K2 for CB02 thin films. We found that the formation of clusters helped in the reduction of thermal conductivity. It is evident that further improvements to the properties of the films are necessary. These can be achieved through a thorough study of the dependence of TE properties on the thickness of the thin film. Structural and TE effects and phenomena observed during the course of this work suggest that detailed microstructure studies and the development of new physical approaches and models are necessary to fully understand the TE conversion potential of this oxide-based material.
ACKNOWLEDGMENTS
G.P. thanks the Australian Research Council for support under Discovery Grant No. DP0 879 714. P.J. thanks the University of Wollongong for providing matching scholarship for her Ph.D. studies. X.W. thanks the Australian Research Council for support under Discovery Grant No. DP1 094 073.