Implications
This study provides information regarding the ability of different chicken genotypes (slow-, medium- and fast-growing) to synthesize and accumulate in muscle tissue n-3 long chain polyunsaturated fatty acids, which have an important role in human health. It emerged that slow-growing birds have a higher desaturating activities which allow them to convert with a better efficiency the dietary fatty acid precursors of the n-3 families (linolenic acid) into long-chain derivatives EPA and DHA. This study highlights the possibility of a genotype-based selection of chicken strains to produce meat with increased nutritional value.
Introduction
The production of meat with lower overall fat content and a healthier fatty acid (FA) profile is of great interest for the meat industry. Consumers’ awareness of the relationship between health and food choices is increasing, as well as the demand of food having a good nutritional profile. A US survey indicates that 63% of consumers are trying to consume less animal fat and 41% of consumers decreased their consumption of beef, since they consider meat a source of high amount of lipids having unhealthy characteristics (I.F.I.C. Foundation, 2009).
Meat from different animal species is characterized by different FA composition, and within the same species the FA profile reflects endogenous biosynthesis as well as the composition of the diet. This relationship is stronger in monogastrics (pigs, poultry and rabbits) than in ruminants, where dietary FA are hydrogenated in the rumen (Kouba and Mourot, Reference Kouba and Mourot2011).
Animals are unable to synthesize essential fatty acids (EFA), linoleic acid (LNA;18:2n-6) and α-linolenic acid (ALA 18:3n-3) from acetyl-CoA, but they can convert EFA supplied by the diet to more unsaturated FA with a longer carbon chain. This process is catalyzed by the elongating and desaturating enzymes. The delta-6 (Δ6, EC 1.14.99.25) and delta-5 (Δ5, EC 1.14.19.-) desaturases, which introduce double bonds in EFA to obtain long chain polyunsaturated fatty acids (LC-PUFA), are encoded by fatty acid desaturase 1 and 2 (FADS2 and FADS1) genes, respectively (Nakamura and Nara, Reference Nakamura and Nara2004). The rate-limiting enzymes in the synthesis of arachidonic acid (ARA; 20:4 (n-6)), EPA(20:5 (n-3)) and DHA (22:6 (n-3)) from their respective dietary precursors LNA and ALA are Δ6 and Δ5 desaturases (Cho et al., Reference Cho, Nakamura and Clarke1999 Reference Cho, Nakamura and Clarkea and Reference Cho, Nakamura and Clarke1999b). Furthermore, another desaturating enzyme exists, that is, the delta-9 (Δ9, EC 1.14.19.1) or stearoyl-CoA desaturase (SCD1), which converts endogenous and dietary palmitic (16:0) and stearic acid (18:0) to palmitoleic (16:1) and oleic acid (18:1), thus increasing the concentration of monounsatured FA and the saturation degree, considered an important parameter for the evaluation of food (Legrand and Hermier, 1992). Δ9-desaturase is encoded by the SCD1 gene (Ntambi and Miyazaki, Reference Ntambi and Miyazaki2003).
Several studies have demonstrated that it is possible to enrich poultry products (meat and eggs) with n-3 LC-PUFA through dietary strategies (Meluzzi et al., Reference Meluzzi, Sirri, Tallarico and Franchini2001; Woods and Fearon, Reference Woods and Fearon2009; Fraeye et al., Reference Fraeye, Bruneel, Lemahieu, Buyse, Muylaert and Foubert2012; Rossi et al., Reference Rossi, Nys, Anton, Bain, De Ketelaere, De Reu, Dunn, Gautron, Hammershøj, Hidalgo, Meluzzi, Mertens, Nau and Sirri2013). High dietary concentration of ALA increases its concentration in the poultry meat, with a small increase of EPA and above all DHA concentration (Rymer and Givens, Reference Rymer and Givens2005); this seems to indicate that poultry have a relatively low efficient EFA conversion to LC-PUFA, allowing for further consideration on the selection of genotypes with enhanced desaturating activity.
In two recent papers Sirri et al. (Reference Sirri, Castellini, Roncarati, Franchini and Meluzzi2010 and Reference Sirri, Castellini, Bianchi, Petracci, Meluzzi and Franchini2011), comparing organically reared slow-growing (SG), medium-growing (MG) and fast-growing (FG) chickens, found higher n-6 and n-3 polyunsaturated fatty acids (PUFA) content in the breast muscle of SG, suggesting a different expression of genes encoding for the desaturating enzymes. On the other hand, since SG and MG lines are reported to eat much grass than FG one (Castellini et al., Reference Castellini, Dal Bosco, Mugnai and Bernardini2003), the higher ALA intake could have contributed to the higher degree of unsaturation in meat.
In the present study the possible genotype-related different expression of the genes encoding for desaturating enzymes (Δ5 to Δ6-desaturases) and their impact on the FA composition of the meat was evaluated. Since it is reported that desaturase activities are low in non-hepatic tissues (Bourre et al., Reference Bourre, Piciotti and Dumont1990), and the liver is considered to be the primary site of ARA, EPA and DHA production for peripheral tissue utilization (Scott et al., Reference Scott and Bazan1989) the expression of FADS1 and FADS2 and SCD1 was measured in the liver of SG, MG and FG chickens fed the same diet. Furthermore, FA composition was evaluated and desaturation indices, based on the ratio of product to precursor of individual FAs, were calculated in breast meat as surrogate measures of desaturase activity (Vessby et al., Reference Vessby, Gustafsson, Tengblad, Boberg and Andersson2002; Gray et al., Reference Gray, Kousta, McCarthy, Godsland, Venkatesan, Anyaoku and Johnston2013).
Material and methods
Animals and diet
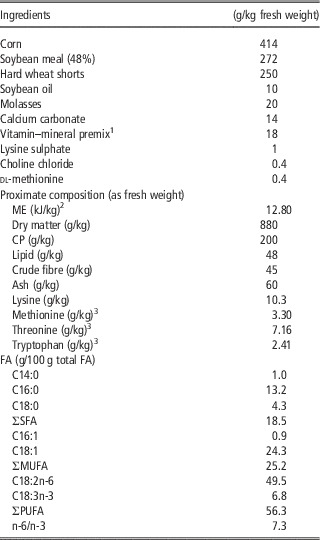
A total of 36 male chicks belonging to three experimental groups were studied: (i) Hy-line W36 (n=12), a SG strain selected for egg production; (ii) Kabir Red (n=12); and (iii) Cobb 500 (n=12), MG and FG strains, respectively, selected for meat production. Chicken strains were defined as SG, MG and FG according to their growth rate. Chickens were housed in three pens of the same climate controlled poultry house at the Research Centre of the University of Perugia (IT). All birds were supplied with water and feed on ad libitum consumption. The diet was formulated according to the nutrient requirements of NRC (1994) (Table 1). A representative sample of feed was collected per each batch of production, pooled and submitted to chemical analysis. Birds were raised until 81 days old following the organic procedures stated by the European Commission regulation 1804/99 (EC, 1999) without access to outdoor pasture. Before slaughtering, birds were subjected to a total feed withdrawal of 12 h, including the lairage time of 2 h at the processing plant. Birds were individually weighed, labelled and subsequently processed under commercial conditions after electrical stunning (120 V, 200 Hz). Whole liver was quickly excised with sterile scissors and imbibed in five volumes RNAlater® (Sigma, Milan, Italy) as indicated by the manufacturer. After 1 day at 4°C, samples were placed at −80°C until analysis.
Feed ingredients and chemical composition of the chicken diet

FA=fatty acids; SFA=saturated fatty acids; MUFA=monounsaturated fatty acid; PUFA=polyunsaturated fatty acids.
1 The following vitamins and minerals were provided per kilogram of diet: vitamin A (retinyl acetate), 10 000 IU; vitamin D3 (cholecalciferol), 3000 IU; vitamin E (dl-α_tocopheryl acetate), 20 IU; vitamin K (menadione sodium bisulfite), 2.5 mg; riboflavin, 5.0 mg; pantothenic acid, 8.0 mg; niacin, 20 mg; pyridoxine, 3 mg; folic acid, 0.5 mg; biotin, 0.10 mg; thiamine, 2 mg; vitamin B12, 24 μg; Mn, 0.10 mg; Zn, 60 mg; Fe, 30 mg; Cu, 10 mg; I, 1.5 mg; Se, 0.2 mg.
2 ME=metabolizable energy: calculated.
3 Calculated composition.
After chilling, carcasses were stored at 4°C for 24 h and pectoralis major muscle was collected, homogenized and stored at −20°C for subsequent analysis of moisture, protein, total lipid, ash and FA composition of total lipids as well as of triglycerides (TAG) and phospholipids (PL) fractions.
Chemical analysis of feed and muscle
Moisture content and ashes were determined in duplicate according to the AOAC procedures (AOAC, 1990). Proteins were determined using a standard Kjeldahl copper catalyst method (AOAC, 1990). The FA composition of the diet was determined by gas chromatography as described below, after lipid extraction (Folch et al., Reference Folch, Lees and Sloane Stanley1957) and methyl esterification (Christopherson and Glass, Reference Christopherson and Glass1969). A representative sample of 8 g of breast was taken and lipids were extracted according to Folch et al. (Reference Folch, Lees and Sloane Stanley1957); the ether extract was divided into two aliquots, one used for FA analysis and the other to separate individual lipid fractions (PL and TAG) using solid phase extraction (SPE) columns (Warensjo et al., Reference Warensjo, Riserus and Vessby2005). Then the FA composition was analyzed in the total lipids as well as in PL and TAG fractions as described below.
FA analysis
FAs were converted to their methyl esters following the method described by Christopherson and Glass (Reference Christopherson and Glass1969). In brief, 250 µg of lipid and 500 µl of the methylating solution (KOH/methanol 2 N) were put in a vial containing 5 ml of hexane and 1 g of anhydrous sodium sulphate. The vial was mixed for 30 s and placed in a water bath at 40°C for 15 min. The sample was then stirred and cooled on ice. The upper phase, containing FA methyl esters (FAMEs), was collected and used for the separation of FAs by using a Shimadzu GC17A gas chromatograph (Shimadzu Corporation, Tokyo, Japan) with a WP-4 Shimadzu integration system, equipped with a Varian CPSIL88 capillary column (100 m length, 0.25 mm i.d., 0.20 mm film thickness) (Varian, Walnut Creek, CA, USA) and a flame ionization detector (Shimadzu Corporation, Tokyo, Japan). The operating conditions of the gas chromatograph were as follows: the oven temperature was kept at 170°C for 15 min, increased to 190°C at a rate of 1°C/min, then increased to 220°C at a rate of 5°C/min, and kept at this temperature for 17 min. The temperature of the injector and detector 270°C and 300°C, respectively. Helium was used as the carrier gas at a constant flow rate of 1.7 ml/min. The identification of individual FA was carried out by using PUFA-2 FA methyl ester standards (Matreya, Pleasant Gap, PA, USA), and FA quantification by using methyl non-adecanoate 98% (C19:0) (Sigma, Saint Louis, MO, USA) as internal standard added prior lipid extraction.
Desaturase activities calculation
Desaturase activities were estimated as products to precursors ratio for the FA metabolized and produced by each enzyme. The activities of Δ9-C16 and Δ9-C18 were calculated as [16:1 (n-7)/16:0] and [18:1 (n-9)/18:0], respectively (Warensjo et al., Reference Warensjo, Riserus and Vessby2005). Δ5 and Δ6 desaturases are both involved in the n-3 and n-6 PUFA pathways. Due to the negligible content of γ-linolenic acid, desaturase activities on n-6 PUFA pathway were calculated as Δ6=[20:3 (n-6)/18:2 (n-6)], Δ5=[ARA [20:4 (n-6)]/20:3 (n-6)] and Δ6+Δ5=[20:4 (n-6)/18:2 (n-6)]. Similarly, since stearidonic acid (18:4n-3) was not detectable, desaturase activities on n-3 PUFA pathway were calculated using the following indexes: Δ6+Δ5 activities [20:5 (n-3)/18:3 (n-3)], [22:6 (n-3)/18:3 (n-3)], and Δ6 activity [22:6 (n-3)/20:5 (n-3)] (Sirri et al., Reference Sirri, Castellini, Bianchi, Petracci, Meluzzi and Franchini2011; Gray et al., Reference Gray, Kousta, McCarthy, Godsland, Venkatesan, Anyaoku and Johnston2013).
RNA extraction, quantification, retro transcription and qPCR
The RNeasy mini kit (Qiagen, Hilden, Germany) was used to perform the total RNA extraction following manufacturer instruction. Briefly, 30 mg of hepatic tissue were mechanically disrupted by sterile scissors and homogenized in 600 µl RLT buffer (Qiagen) using QIAshredder columns (Qiagen). Elution was in 50 µl RNAse free water. Sample purity and quantity were assessed by Nanodrop nd-2000 (Thermo Scientific, Milan, Italy) assessing each sample twice. All samples having absorbance (A260/280) in the range of purity were stored −80°C and used for further analysis.
Retro transcription was performed on 200 ng of total RNA extract in a 20 µl total reaction volume of Quantitect reverse transcription kit (Qiagen) using a Mastercycler® personal (Eppendorf, Milan, Italy) as follow. Samples were incubated for 2 min at 42°C with gDNA Wipeout Buffer (Qiagen) to eliminate possible genomic DNA contamination, and then samples were quickly put on ice and reverse transcription mix added as indicated by the manufacturer. Optimized blend of oligo-dT and random primers were used in presence of RNAse inhibitors. Reaction conditions were as follows: 15 min 45°C, 3 min 95°C and 5 min 4°C. The obtained cDNA was quickly stored at −20°C. Each sample was retro transcribed twice.
Relative gene expression analysis was performed on a 6000 Rotor gene (Corbett, Sydney, Australia) by two step real-time q-PCR assays using SYBR Green detection (QuantiTect SYBR Green PCR Kit; Qiagen). Amplification was done in a final volume of 25 μl including 1 μl of cDNA as template. The PCR Master Mix was prepared according to Qiagen protocol and amplification conditions were as follows: 15 min at 95°C (94°C for 15 s, 56°C for 30 s and 72°C for 30 s)×40 cycles. Melt curve were obtained every time 15 s at 95°C. Template controls and retro-transcription control showed no contamination each time. Primers specificity was evaluated using melt curve that showed unique specific peak in all cases. q-PCR validation was carried out by standard curve. Reaction efficiency and R value were in the range of 80% to 100% and 0.99, respectively, for all examined genes. The primer pairs used are summarized in Table 2. Three expression technical replicates were performed on RT duplicate, and seven biological repeats were analyzed in each experimental group. Relative quantification of the mRNA levels of all genes in exam was determined using the Rotor-gene 6000 software 1.7 comparative quantification analysis, in which reaction efficiency is calculated on each reaction tube; all samples had >85% efficiency. Gene expression was normalized by the REST 2009 software in Rotor Gene (RG) mode. Glyceraldehyde-3-phosphate-dehydrogenase and aminolevulinate synthase 1 were used as reference genes. Medium- and fast-growing groups were referred to slow growing considered as calibrator group at unit value.
Primer pairs used to perform q-PCR analysis of gene expression

Gene name abbreviation, forward primer, reverse primer, sequence on gene bank and efficiency are indicated for both target and reference genes.
Statistical analysis
Statistical analysis of gene expression data was performed by the REST 2009 software in RG mode that uses Taylor’s series to find statistical differences (Pfaffl et al., Reference Pfaffl, Horgan and Dempfle2002). Data on chemical and FA composition were analyzed by one-way ANOVA using as fixed effect the chicken genotype (SG, MG, FG). Means were separated by student Newman–Keuls test using SAS Package (SAS Institute, 1988).
Results
Chicken from the three experimental groups and throughout the experiment duration received the same diet (CP 200 g/kg; total lipid 48 g/kg; metabolizable energy 12.80 kJ/kg). The n-6 PUFA were the main FA group in the diet, and the n-6/n-3 ratio was 7.3 (Table 1).
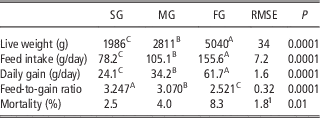
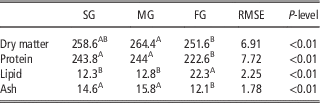
At the slaughtering age, chickens from the three strains were different in BW (P<0.0001). As expected FG birds reported a better daily weight gain, feed intake and feed conversion rate than both MG and SG, which differed each other (P<0.0001) (Table 3). In Table 4 the chemical composition of the breast meat is given. FG meat had a lower content of ash and protein (P<0.01) and a higher content of lipid than MG and SG meat (P<0.01).
Productive performance of three chicken genotypes at 81 days of age

SG=slow growing; MG=medium growing; FG=fast growing.
1 χ 2 value.
A,B,CValues within a row with different superscripts differ significantly at P<0.01.
Chemical composition of breast meat (pectoralis major) of three different chicken genotypes (g kg/g fresh weight)

SG=slow growing; MG=medium growing; FG=fast growing.
A,BValues within a row with different superscripts differ significantly at P<0.01.
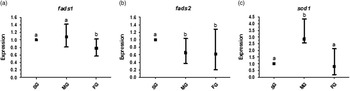
Desaturating enzyme-relative gene expression in the three strains is reported in Figure 1. The FG strain showed a lower expression of both FADS1 (P<0.01) and FADS2 (P<0.01) genes than the SG strain, while no differences were detected in the expression of the SCD1 gene between these two strains. Compared to SG strain, the MG strain showed a similar FADS1 and a lower FADS2 gene expression (P<0.05) while SCD1 gene was ~3 time more expressed in MG than in both SG and FG strains (P<0.01).
Expression of the genes encoding for the desaturating enzymes in the liver of the three chicken genotypes. (a) FADS1, (b) FADS2 and (c) SCD1 gene expression is reported in the corresponding panel. Data are expressed as median±range (minimum to maximum). Significant differences were evaluated with Taylor’s series statistical analysis. In each graph different superscript letters indicate statistical significance (at least P<0.05). SG=slow growing; MG=medium growing; FG=fast growing.

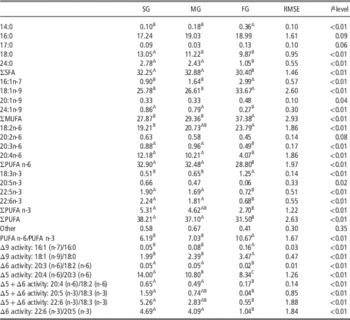
The total lipid FA composition of the breast meat from the three strains is reported in Table 5. A similar saturated fatty acid (SFA) and monounsaturated fatty acid (MUFA) content was observed in the MG and SG, while FG birds showed the lowest (P<0.05) SFA and the highest (P<0.05) MUFA content.
Fatty acid (FA) composition of total lipids from breast meat (pectoralis major) of three chicken genotypes (g/100 g total FA)

SG=slow growing; MG=medium growing; FG=fast growing; SFA=saturated fatty acids; MUFA=monounsaturated fatty acid; PUFA=polyunsaturated fatty acids.
A,B,CValues within a row with different superscripts differ significantly at P<0.01.
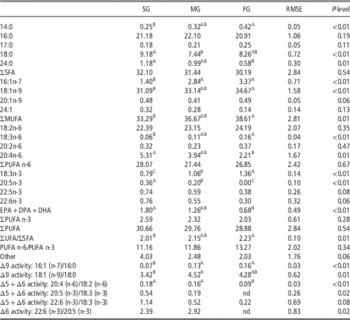
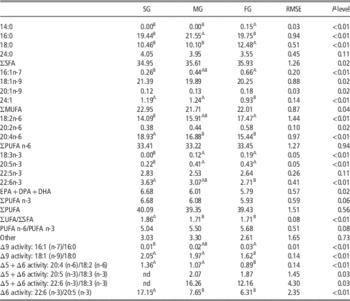
In the total lipid fraction (Table 6) Δ9 activity appeared similar in MG and SG chickens, and lower than in FG birds (P<0.05); a similar relationship was observed in the TAG fraction where SG exhibited a lower (P<0.01) Δ9 activity than the other two strains (Table 6) while in PL fraction the FG birds exhibited a lower activity of the enzyme than MG and SG chicken (Table 7).
Fatty acid (FA) composition of the triacylglycerol fraction of breast meat of three chicken genotypes (pectoralis major) (g/100 g total FA)

SG=slow growing; MG=medium growing; FG=fast growing; SFA=saturated fatty acids; UFA=unsaturated fatty acids; MUFA=monounsaturated fatty acid; PUFA=polyunsaturated fatty acids.
A,B,CValues within a row with different superscripts differ significantly at P<0.01.
Fatty acid (FA) composition of the phospholipid fraction of breast meat (pectoralis major) of three chicken genotypes (g/100 g total FA)

SG=slow growing; MG=medium growing; FG=fast growing; SFA=saturated fatty acids; UFA=unsaturated fatty acids; MUFA=monounsaturated fatty acid; PUFA=polyunsaturated fatty acids.
A,BValues within a row with different superscripts differ significantly at P<0.01.
All indices used to evaluate Δ6 and Δ5 activity were reduced in the breast muscle of FG chickens, which corresponded with their lower expression of both FADS1 and FADS2 genes. Accordingly, the PUFA proportion in FG breast meat was significantly lower than in MG and SG (P<0.05), with a significant reduction of both n-3 and n-6 PUFA (P<0.05), along with the dramatic reduction of ARA and DHA content (Table 5).
TAG (Table 6) and PL (Table 7) FA composition showed a similar trend to that of total lipids. As for TAG fraction, SG in comparison to FG, showed higher proportions of EPA (P<0.08) and DHA (P<0.06). Similarly in PL fraction, SG exhibited higher proportions of DHA (P<0.01), EPA+DPA+DHA (P<0.02) and LC-PUFA (P<0.06).
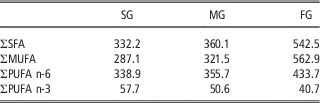
Taking into account the FA profile and the lipid breast content, in Table 8 the FA composition of breast meat of the three chicken genotypes is given. SG meat exhibited the highest content of LC-PUFA being >40% greater than FG meat (57.7 v. 40.7 mg/100 g) (Table 8).
Fatty acid composition of breast meat (pectoralis major) of three chicken genotypes (mg/100 g meat)

SG=slow growing; MG=medium growing; FG=fast growing; SFA=saturated fatty acids; MUFA=monounsaturated fatty acid; PUFA=polyunsaturated fatty acids.
Discussion
The therapeutic and preventive benefits of dietary n-3 LC-PUFA, which occur in fish and fish oil, are well documented (Harris et al., Reference Harris, Dayspring and Moran2013; Salter, Reference Salter2013). However, consumers that usually do not eat fish are reluctant to modify their dietary habits to follow health claims (I.F.I.C., 2009). Therefore, the key strategy to increase a wide range of foods in n-3 FA is still crucial. By consuming foods such as milk, margarine and sausage (all enriched with fish oil), instead of canned and fresh fish, Metcalf et al. (Reference Metcalf, James, Mantzioris and Cleland2003) demonstrated that consumers can reach a dietary EPA+DHA intake of 1.5 to 1.8 g/day without altering their dietary habits. This intake is equivalent to that supplied by ⩾1 fish meal/day.
The enrichment of food with EPA and DHA requires the use of marine sources and consequently seriously affects the pressure on global fish stocks and aquaculture, representing an unsustainable solution in the long term (Naylor et al., Reference Naylor, Goldburg, Primavera, Kautsky, Beveridge, Clay, Folke, Lubchenco, Mooney and Troell2000). These issues could be solved providing n-3 FAs via terrestrial food chain. Taking also into account the high consumption rate of avian meat (cheaper than fish), the identification of the methods to enrich poultry meat with n-3 PUFA represents an important goal not only for the food industry, but also for the improvement of human nutrition.
In this respect, it is worth noting that ALA is the main n-3 FA in feed, but in chicken it is poorly converted to the LC-PUFA, similarly to other animal species (Nakamura and Nara, Reference Nakamura and Nara2004), this making the increase of ALA concentration in the poultry diet a poor strategy for EPA and DHA enrichment of the meat. Rymer and Givens (Reference Rymer and Givens2005) reported that the increase of ALA concentration in the birds’ diet can readily increase the concentration of ALA in the edible tissues while it does not result in a noticeable increase in EPA and DHA content. The concentration of EPA and DHA in both white and dark meat is increased when the birds’ diet is supplemented with EPA and DHA, but this implies the use of marine sources in the poultry diet, coming back to problems reported above.
Desaturase activity is influenced by the diet, but also genetic variation could deeply influence the desaturase capacity (Rymer and Givens, 2006); in this light the identification of specific chicken genotypes having a higher efficiency in EFA conversion could be strategic. Notwithstanding, to the Authors’ knowledge the expression of genes encoding for the Δ5 and Δ6, and Δ9 desaturases and/or the activity of the desaturase enzymes have never been compared in chicken from different strains.
In this work, the expression of hepatic FADS1, FADS2 and SCD1 in chicken with different growing rate is reported for the first time. Desaturase activity was also calculated in breast muscle to verify whether modification in gene expression in the liver, considered the major source of LC-PUFA for extra-hepatic tissue, are consistent with modification of enzymes activity in other tissues.
Since desaturase activity is also dependent on the availability of different substrates, and it is regulated by dietary factors (Sprecher, Reference Sprecher2000) animals in the present study were fed the same diet.
In the present study, FG chicken showed the lower expression of hepatic FADS1 and FADS2. Furthermore, all indices used to evaluate Δ5 and Δ6 activity in the breast muscle were decreased in FG chickens, indicating that the genotype-related lower efficiency in LC-PUFA synthesis is probably not limited to the liver. The lower content of both n-6 and n-3 PUFA in the breast meat of FG chicken reflected the reduced expression/activity of the Δ5 and Δ6 desaturase.
The higher MUFA content in breast muscle of FG animals was consistent with the higher Δ9 desaturase activity calculated for this tissue, while SCD1 expression was similar in the FG and SG strain.
Results from this study indicate that the relative expression of the hepatic genes encoding for the FA desaturase enzymes, as well as the activity of the enzymes in the breast muscle, is different among the three chicken strains suggesting that the ability to synthesize LC-PUFA from dietary precursors is potentially related to genotype.
Desaturase gene and protein expression and enzymatic activity is mainly influenced by the diet, although other factors like age, and sex (Poureslami et al., Reference Poureslami, Turchini, Raes, Huyghebaert and De Smet2010) can have an effect. Since all these variables were similar in the tested animals, it could be concluded that genotype may be the key factor to obtain n-3 LC-PUFA enriched meat.
Regarding FA composition of breast meat, Sirri et al. (Reference Sirri, Castellini, Bianchi, Petracci, Meluzzi and Franchini2011) reported important differences in the FA profile from different chicken genotypes (FG, MG and SG strains) and attributed these difference to the intramuscular fat content. This was in accordance with Barton et al. (Reference Barton, Marounek, Kudrna, Bures and Zahradkova2008) who demonstrated that lean animals have higher proportions of muscle LC-PUFA due to the higher incidence of membrane PL (high in LC-PUFA). However, in the present study the LC-PUFA concentration resulted lower in both lipid fractions (TAG and PL) in FG birds. Thus, the lower LC-PUFA detected in total lipid is not only attributable to their higher fatness, in contrast to the Barton et al. (Reference Barton, Marounek, Kudrna, Bures and Zahradkova2008) hypothesis, but also to the lower proportion of LC-PUFA observed in both lipid fractions that may be related to the lower Δ5 and Δ6 desaturase activity observed in FG birds.
Sirri et al. (Reference Sirri, Castellini, Bianchi, Petracci, Meluzzi and Franchini2011) also speculated that the differences in the PUFA profile of SG birds may be due to a higher ∆6 desaturase activity. In this study, the different FA composition of the three chicken strains has been related to the different FADS2 and FADS1 gene expression which in turn affect Δ5 and Δ6 activities.
As for meat composition, the higher content of protein and ash and the lower amount of lipid observed in MG and particularly in SG chickens was attributed to their more active behaviour that affected energy expenditure, lipid storage and protein synthesis in accordance with Castellini et al. (Reference Castellini, Dal Bosco, Mugnai and Bernardini2003) and Dal Bosco et al. (Reference Dal Bosco, Mugnai, Sirri, Zamparini and Castellini2010). Indeed, based on GPS tracking, Dal Bosco et al. (Reference Dal Bosco, Mugnai, Sirri, Zamparini and Castellini2010) reported that SG birds, reared according to the organic method, were more active and spent more time outdoor than FG birds which were less active and tended to stay indoors. Similar results were reported also by Sirri et al. (Reference Sirri, Castellini, Roncarati, Franchini and Meluzzi2010 and Reference Sirri, Castellini, Bianchi, Petracci, Meluzzi and Franchini2011) in SG, MG and FG strains reared under organic conditions. The higher content of fat observed in FG birds is likely related to their fast growth profile which allows them to complete their muscle development and starts the fat deposition at an early age in respect to MG and SG birds (Sirri et al., Reference Sirri, Castellini, Bianchi, Petracci, Meluzzi and Franchini2011).
Although additional studies are required to validate the herein reported results enlarging experimental conditions, the present study highlights the possibility of a genotype-based selection of strains to produce meat with increased nutritional value.
Acknowledgements
This work was partially supported by a grant of the Italian Ministry of the Economic Development (MIAOVER50 project). The authors also express their appreciation to Mr Stefano Pignata and Mr Roberto Donatini of the Department of Agricultural and Food Sciences of the University of Bologna for their technical assistance.