


1. Introduction
In avalanche science, constitutive equations describing the deformation of snow over time are required for two primary reasons:
-
1. To study the mechanics of avalanche formation. The present theory of avalanche formation assumes that “super-weak” layers or interfaces exist within the snowpack (Reference Bader, Gubler, Salm and SwobadaBader and others, 1989). The shear forces acting on these thin layers are a function of the viscoelastic material behaviour of the thicker layers above and below the weak zone. Without an accurate description of how the homogeneous layers behave under multi-dimensional stress states, a predictive theory of avalanche formation—important for avalanche warning—cannot be developed.
-
2. To determine the creep forces on avalanche defence structures. Defence structures in the starting zone of avalanches must withstand the pressures exerted on them by snow. These forces are a function of both the creep and glide movements of the snowpack. Without an accurate constitutive model for snow, the structures will be either over-designed, and thus too costly, or under-designed, and thus subject to failure. Defence structures were invaluable during the catastrophic avalanche winter of 1999 in the Alps (SLF, 2000).
Two types of constitutive equations have been developed. The first treats snow as a viscoelastic continuum and does not take into account the microstructural properties of the granular ice matrix. The most important work in this field has been performed by Salm (1974), Reference Desrues, Darve, Flavigny, Navarre and TailleferDesrues and others (1980) and Reference Lang and HarrisonLang and Harrison (1995). These laws have been formulated for low, naturally occurring strain rates (say  ). They are valid for creeping snow. The second type of constitutive equation considers the kinematics of the ice skeleton and relates microstructural deformation mechanisms to the macro-continuum behaviour. These laws are more general and have been applied to higher strain rates and are therefore valid for snow under loadings, such as skiers and snow vehicles. The basic idea behind microstructural models is that the mechanical properties of snow are determined by the type of bonds between the ice grains and the snow structure (Reference Lawrence and BradleySt. Lawrence and Bradley, 1975; Reference VoytkovskiyVoytkovskiy, 1977). The load is carried by “force chains” (Reference GublerGubler, 1978) (Fig.1) consisting of a series of ice grains. The most important work in this category was carried out by Reference BrownBrown (1980), Reference Hansen and BrownHansen and Brown (1988) and Reference Mahajan and BrownMahajan and Brown (1993). A simplified microstructural model based on these works was presented by Reference Bartelt and von MoosBartelt and von Moos (2000).
Microstructural definitions according to Reference Hansen and BrownHansen and Brown (1988) and Reference Mahajan and BrownMahajan and Brown (1993).The load-bearing “chain” concept of Reference GublerGubler (1978).

1.1. Viscoelastic continuum models and experimental validation
Salm (1974) established a constitutive equation for creeping snow in a quasi-stationary state on the basis of the principle of least irreversible force (Reference ZieglerZiegler,1963). As a consequence of this principle, the constitutive equation depends only on the dissipation function of the system. This function was developed as a power series of the invariants of the stress tensor. Because of the distinctly non-Newtonian behaviour of snow, terms up to the sixth degree of the invariants had to be taken into account. For validation, uniaxial tensile and compressive tests were carried out on snow samples with an initial density of 432 kg m−3. The applied stresses ranged from −70 kPa (tension) to 70 kPa (compression). The temperature was approximately −5°C. Although a five-degree equation fits the test results well, the dissipation function was not checked for a wide range of densities and temperatures.
Reference Desrues, Darve, Flavigny, Navarre and TailleferDesrues and others (1980) formulated the stress–strain relationship for snow in incremental form, with the intention of developing a constitutive equation suitable for the finite-element (FE) method. Triaxial tests were performed on dry, naturally occurring snow. The initial density of the samples ranged from 150 to 200 kg m−3; the temperature ranged from −2° to −10°C. Each test was divided into two parts: the samples were first placed under an isotropic compressive stress, then an axial deformation at a specified strain rate was applied. The results show that deposited snow can be considered as a non-linear viscoelastic material. Therefore, the incremental strain was decomposed into two parts, a non-linear elastic part and a viscous part. The calculated behaviour is consistent with the experimental results.
Reference Lang and HarrisonLang and Harrison (1995) attempted to describe the behaviour of snow within the context of critical-state soil mechanics. The viscous properties of snow were subsequently not considered. Triaxial tests were performed on dry, naturally occurring snow. The initial density of the samples ranged from 170 to 376 kg m−3. The applied strain rate was 1.01 × 10⁻⁵ s−1; the confining pressure varied from 0 to 41 kPa and the temperature ranged from −2 to −9°C. The samples were strained up to 15% after a hydrostatic stress was applied to the samples. Results exhibited the typical soil-like response of a linear relationship between the natural logarithm of increasing hydrostatic pressure and decreasing void ratio or volume. However, as noted by Lang, because only one strain rate was used to test the samples, the tests do not provide a statistical basis for the mechanical properties of snow.
1.2. Microstructural models
Reference Hansen and BrownHansen and Brown (1988) developed a complete microphysical constitutive theory with internal state variables based on non-equilibrium thermodynamics. The significant feature of this theory is that the state variables are identified at the granular level (mean bond radius, mean bond length, mean intergranular slip distance, mean intercept length, mean number of bonds per grain). The theory is used to describe the mechanical properties of snow under high-rate multiaxial deformation.The model considers the fracture of grain bonds, reorganization of the grains, building of new bonds and neck growth.
Reference Mahajan and BrownMahajan and Brown (1993) presented a second microstructural constitutive theory of snow that describes the mechanical properties of snow in terms of the properties of the ice grains and the necks that interconnect them. That is, the kinematics of the ice skeleton are assumed to control the macroscopic behaviour. Four different deformation mechanisms ((1) axial strains within the necks, (2) shear strains within the necks, (3) interparticle slip after bond fracture and (4) slip along grain boundaries) were investigated, and, depending upon the dominant deformation mechanism for given load conditions, two different equations were used to calculate the microstructural strains.
The first equation models the two inelastic creep processes (axial and shear straining), and the second equation models the two remaining large-scale interparticle slip mechanisms. The first equation was based on the viscoelastic model for polycrystalline ice developed by Reference Szyszkowski and GlocknerSzyszkowskiy and Glockner (1986). Mahajan and Brown used a microstructural factor to determine the microstructural stress and then used the ice parameters found by Szyszkowskiy and Glockner to model both the axial and shearing creep deformations. The model of Mahajan and Brown was verified using only a few experiments for only one snow density, ρ = 340 kg m−3.
Bartelt and Reference Von MoosVon Moos (2000) developed a simplified version of the Mahajan and Brown model and applied it to a wider range of densities (190 kg m−3 < ρ < 435 kg m−3). They determined the stress in the necks under the assumption that the state of microstructural strain is equal to the state of continuum strain. Like Mahajan and Brown, they used a microstructure factor to scale the microstructural stress state to the continuum stress. In order to determine the microstructural stress state, the constitutive law for polycrystalline ice developed by Reference Szyszkowski and GlocknerSzyszkowskiy and Glockner (1986) was applied.The microstructural stress factor increased with increasing density but varied outside the theoretically predicted range, especially for lower-density snow.
In summary, viscoelastic continuum models have a better experimental basis than microstructural models but have been formulated without taking into consideration that polycrystalline ice is the constituent material. Subsequently, the influence of the microstructure on the material behaviour has not been determined. This makes developing flow and fracture theories with these models difficult, if not impossible. On the other hand, microstructure models, which employ ice material laws at the granular level, have not been rigorously verified. Since a rational constitutive theory is lacking, FE modellers have attempted to simulate snow using plasticity models developed for soils (Reference Meshke, Liu and MangMeschke and others, 1996). However, snow is not a plastic material since a rate-independent yield stress has never been experimentally identified (and was not identified in our tests). That is, snow differs considerably from soil.
1.3. Objective
The primary purpose of this work is to present the results of over 180 triaxial tests in order that microstructure-based constitutive models can be formulated and verified. First, the triaxial test procedure is reviewed and then the viscoelastic response of snow is quantified. Afterwards, the results will be discussed in light of the constituent material, polycrystalline ice. We will attempt to separate material behaviour from the deformation kinematics of the ice skeleton, especially with respect to the work-hardening behaviour of snow. We show that there is a strong similarity between polycrystalline ice and snow; however, there are also important differences, especially for low-density snow. We stress that our analysis is valid only for low compressive strain rates where massive bond breakage and slip between ice grains does not occur. The development of a constitutive model and the investigation of the temperature dependence of snow are the subject of future works.
2. Test Procedure
Since there has been very little testing of snow that has produced multiaxial states of stress, a testing programme (Bartelt and Reference Von MoosVon Moos, 2000) was undertaken using a triaxial testing machine described in Part I (Reference Von Moos, Bartelt, Zweidler and BleikerVon Moos and others, 2003). The test parameters and their ranges are listed inTable 1.
Triaxial test parameters

In total, 180 tests were completed, including some that were used to fail the specimens. For all but a few test samples, natural snow was used. This was collected from the field near the Weissfluhjoch, Switzerland, at an elevation of approximately 2540 m. At each collection time, a pit was dug in the snow, and a homogeneous layer with the desired density was identified. Portions of this layer were then extracted without damaging the snow, placed in sealed containers and stored at −12°C. Testing was normally started within a few days of collection. The test samples were cut from the stored snow so that the long axis of the sample was parallel to the layering. Thus, the samples were generally homogeneous. Inspection of sample surface sections verified this.
All of the snow selected was granular snow that showed very little temperature-gradient faceting. The grains were normally well bonded, with a diameter of 0.2 mm. Again, surface sections verified that the microstructure of the test samples was consistent from sample to sample. However, it must be recognized that when dealing with a geological material such as natural snow, a degree of variability is inevitable.
All of the tests involved control of the axial strain rate and the confining pressure. Both tensile and compressive tests were performed; however, in this study only the results of the compressive tests are used in the analysis. In the majority of the tests the maximum achieved strain was approximately 5%, but in a few experiments strains as large as 20% were achieved. In addition, in many of the tests a relaxation period was included after the maximum strain was reached. This will be evident in the figures that follow.
A special jig was used to cut cylindrical specimens from the stored snow. The final dimensions were 126 mm in length and 58 mm in diameter. The ends of the specimens were trimmed to make them square to the long axis. Each specimen was then placed in the testing machine, and a 12 μm thick Mylar foil was used to enclose the sample so that a confining pressure, p c, could be applied to the sample during testing.
The axial deformations, the volume changes and the axial forces were measured during the strain-rate controlled tests. In order to record the volume change, the air expelled from the probe during compression was measured.
For most of the tests the axial strain rate and the confining pressure were applied and maintained until the maximum desired strain was achieved. Then the axial deformation was stopped, but the confining pressure was maintained. In a number of experiments, however, data collection continued to record the stress relaxation in the snow sample.
Please refer to Part I (Reference Von Moos, Bartelt, Zweidler and BleikerVon Moos and others, 2003) for more details of the entire testing procedure.
3. Test Results
3.1. Viscous behaviour
Figure 2 depicts the relationship between the axial strain rate  and the axial yield stress σ
ay. Since both axes are log scales, and since the best fits to the data are linear in this plot, the relationship between σ
ay and
 follows a power law:

where Q is the activation energy in kJ mol−1, R is the molar gas constant in kJ mol−1 K−1, T is the temperature in K, and A
0 and n are temperature-independent constants. Because the experiments are deformation-controlled,  is the applied or specified axial strain rate and σ
ay is the measured stress. Figure 2 shows that, for each of the initial densities, a straight-line approximation accurately represents the variation of strain rate with stress. The slope of the lines determines the exponent n in the above equation. The exponent was found to increase with density from a value of n = 1.8 at ρ = 190 kg m−3 to as high as n = 3.6 at a density of 340 kg m−3. This variation of exponent is shown in Figure 3.
Applied axial strain rate vs axial yield stress; n is the exponent of the power law (Equation (1)) and r is the correlation coefficient. Temperature T = −12°C and confining pressure p c = 0 kPa.

Calculated power-law exponent n for snow as a function of density. A: values for polycrystalline ice reported by Reference Weertman, Whalley, Jones and GoldWeertman (1973), valid for temperatures near −10°C and  . B1: values for line defect mechanisms reported by Reference Langdon, Whalley, Jones and GoldLangdon (1973). B2: values for grain-boundary shearing mechanisms reported by Reference Langdon, Whalley, Jones and GoldLangdon (1973). B3: value for point defect mechanisms reported by Reference Langdon, Whalley, Jones and GoldLangdon (1973). C: value for the flow of a temperate glacier reported by Reference Colbeck and EvansColbeck and Evans (1973) (flow rate < 10−9 s−1). D: value for fine-grained ice reported by Reference Goldsby and KohlstedtGoldsby and Kohlstedt (1997) (
 ; temperature T = −37°C).

Several authors have developed empirical viscosity laws in order to calculate the settlement of the snowpack (Reference KojimaKojima, 1975; Reference MellorMellor,1975; Reference GublerGubler,1994). These laws are based primarily on field observations and relate bulk density to settlement rate via the compactive viscosity η a. They have been used in FE calculations (Reference Bartelt, Christen, Hutter, Wang and BeerBartelt and Christen, 1999). In order to compare our experimental results obtained in the laboratory with these values reported in the literature, we defined

with

As shown in Figure 4, the experimental viscosity (Equation (3)) is strain-rate dependent. For higher-density snow, the viscosity at a strain rate of  is three times larger than for
 . The plot shows that the empirical viscosity laws are in good agreement with the measured results for snow densities ρ < 250 kg m−3. The correspondence for higher densities is not as good: the empirical laws predict larger viscosities. The empirical laws are based on field experiments where the stress acting on the sample is given by the self-weight of the snowpack. For higher-density snow, these stress levels are much smaller than those arising from the applied strain rates in our tests. This is an effect of the highly non-linear relationship between stress and strain rate (n = 3.6).
Axial viscosity determined from Equation (3) at constant temperature T = −12°C and confining pressure p c = 0 kPa. Superimposed are values from the literature: (A) Reference KojimaKojima (1975, (B) Reference GublerGubler (1994). The grey-shaded area represents the yield-stress range for the applied strain rates as a function of density.

3.2. Stress–strain behaviour
Figure 5 (right vertical axis) shows the variation of axial stress σ a with the axial strain ∊ a (in compression). A more detailed picture of the material behaviour can also be seen in Figure 5 (left vertical axis) where the measured tangent modulus, E t = dσ a/d∊ a, is displayed as a function of strain. Note that in this figure the tangent modulus decreases from an initial value E 0 at ∊ a ≈ 0 to a minimum value, after which it slowly increases with increasing strain due to work-hardening processes to be discussed later. The measured E 0 values are strain-rate independent and are in good agreement with the values of Young’s modulus reported by Reference MellorMellor (1975). The strain at which the tangent modulus first begins to increase from its minimum value is referred to as the “contact strain”, ∊ c.
Stress–strain curve (. Stress–strain curve (dashed line) (continuous lines) obtained in compression tests at various strain rates. Density ρ = 320 kg m−3; temperature T = −12°C; confining pressure p c = 0 kPa.

Figure 6 is presented to emphasize some additional aspects of the material response with respect to density. In the figure the ratio σ a/σ ay is plotted against the axial strain for three different densities (190, 245 and 430 kg m−3). Two features are evident in this figure. First, there exists a non-linearity in the initial stress–strain behaviour before the yield stress is reached. The highest-density snow has a substantial region where the stress–strain response is largely linear. The region of quasi-linearity is smaller at 240 kg m−3 and it is essentially non-existent for the lowest-density snow. In order to highlight the difference between densities, the secant modulus, normalized with E 0, is plotted as a function of the strain in Figure 6 for the three densities.
Normalized stress σ a /σ ay and elastic strain component γe = Es/E0 vs applied axial strain. The curves show the influence of the density on the non-linearity in the initial behaviour before the yield stress is reached. Temperature T = −12°C; strain rate = 1.1 × 10⁻⁵ s−1.

In addition to this dependence on density, the contact strain defined in Figure 5 was found to be density-dependent. The strain ∊ c was found to decrease with increasing density, as shown in Figure 7.
Influence of the density on the axial contact strain ∊ c at various confining pressures.Temperature T = −12°C; strain rate varies from 7.4 × 10⁻⁷ s−1 to 2.2 × 10⁻⁵ s−1

3.3. Radial deformation
The radial strain, ∊ r, was not recorded directly but was calculated from the measured volume changes in the test sample,
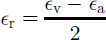
where ∊ v is the measured volumetric strain. Since the measurement of the volumetric strain begins after the hydrostatic stress has been applied, the initial radial strains are not measured. Figure 8 shows the variation of the radial strain with axial strain for different test conditions (density, strain rate, confining pressure). Consider curve a in this figure.The radial strain first increases (the diameter of the specimen decreases) under the influence of the confining pressure, p c. At a critical value of the axial strain, the rate of change of ∊ r with respect to ∊ a undergoes a well-defined change in its slope.We denote this critical axial strain as ∊ c2. Figure 9 plots ∊ c2 against the previously defined axial ∊ c and shows that these two critical strains are essentially identical.
Radial-strain–axial-strain curve obtained in compression tests at various strain rates, confining pressures and densities. Definition of the contact strain ∊
c2. Temperature T = −12°C. (a) ρ = 306 kg m−3, p
c
= 2.5 kPa,  ; (b) ρ = 428 kg m−3, p
c
= 15 kPa,
 ; (c) ρ = 385 kg m−3, p
c
= 5 kPa,
 . Note that the “sawtooth” nature of the curves is due to the non-continuous measurement of volume change, which is performed in steps.

 varies from 7.4 × 10⁻⁷ s−1 to 2.2 × 10⁻⁵ s−1, confining pressure p
c
from 2.5 to 15 kPa and density from ρ = 190 kg m−3 to ρ = 435 kg m−3.

In Figure 8, the remaining two curves, b and c, also show a change in slope at the critical contact strain ∊ c2. In these tests with higher-density snow, the strains ∊ c2 and ∊ c were again almost identical. However, in these two cases, unlike curve a, there was no significant change in the radial strain before ∊ c2 was reached. These specimens had higher densities, so the applied confining pressure did not produce a large increase in ∊ r, that is, a large radial compression of the sample. Only after the axial strain reached the critical strain ∊ c2, did the sample expand in the radial direction.
It is interesting to note that the definition of ∊ c is based upon stress (at the point where work hardening begins), while the definition of ∊ c2 is based upon kinematics (at the point where two strain components change their relationship to each other).
3.4. Work hardening
As can be seen in Figure 5, the stress jump, Δσ = σf inal – σ(∊ c), was observed to be independent of strain rate, i.e. the increase of stress between the point where the contact strain is reached and the end of the test was not found to depend on the strain rate. Consequently, the work-hardening properties of snow appear to be strain-rate independent.
In addition to the strain-rate independence, another important aspect of the work hardening of snow can be shown by investigating the influence of confining pressure on the stress increment Δσ. Consider Figure 10 which shows the influence of volumetric strain ∊ v (left side of figure) and axial strain ∊ a (right side) on Δσ. Three different confining pressures were applied to the sample, so the final volumetric strain ∊ v final differs for each applied pressure due to the differing radial deformation of the sample. The most important observation is that dΔσ/d∊ v is the same for all three confining pressures. Note that dΔσ/d∊ a differs for each confining pressure. Moreover, the hardening stress increases with increasing volume change.
Influence of the confining pressure on the work hardening of snow. Density ρ = 270 kg m−3; temperature T = −12°C; strain rate  .

Finally, the contact strain ∊ c was also found to be independent of strain rate. This means that work hardening begins at about the same strain regardless of the rate of deformation. It appears that the stress difference Δσ and contact strain ∊ c are determined by kinematic factors that are related to the geometry of the material microstructure and the nature of the material deformation and not an inherent property of the constituent material, ice, which is strain-rate dependent.
3.5. Confining pressure
In Figure 11 the stress–strain behaviour for a single density at four different confining pressures p c is reported.
Stress–strain curve obtained in compression tests at various confining pressures. Density ρ = 360 kg m−3; temperature T = −12°C; strain rate  .

The stress difference Δσ, that is, the work hardening, is strongly affected by the confining pressure p c. It is seen (Fig. 11) to increase with increasing p c.
Figure 12 shows the variation of the axial yield stress σ ay with confining pressure. The material response for three different initial densities (200, 270 and 360 kg m−3) is illustrated. As can be seen, the axial yield stress of the two higher densities is practically independent of the confining pressure, i.e. the deviatoric yield stress, defined as

decreases with increasing confining pressure. The lower-density snow demonstrates a different behaviour: above a confining pressure of 4 kPa, the axial yield stress increases significantly.
Influence of the confining pressure on the axial yield stress for different densities.Temperature T = −12°C; strain rate 

4. Discussion of Results
In this section we provide some interpretations of the mechanical behaviour observed in the experiments. The interpretation is based on two fundamental ideas. First, the bulk behaviour of snow under loading is primarily due to the deformation mechanics of the granular ice skeleton. The ice skeleton carries the applied load in “force chains” (Reference VoytkovskiyVoytkovskiy, 1977; Reference GublerGubler, 1978; Reference BrownBrown, 1980). The chains consists of snow grains connected at bonds (see Figs 1 and 13). Second, the constitutive behaviour of the granular skeleton is described by the creep deformation mechanics of polycrystalline ice. The grains and bonds consist of ice crystals of some size and orientation connected to each other at a grain boundary (see Fig. 13).We stress the fact that the experiments were performed at low strain rates and small deformations in which massive bond breakage and sliding of the grains did not occur in the ice skeleton.
A detail of snow showing the grain bonding and crystal boundaries.

4.1. Viscous behaviour
Consider the strain-rate dependency of snow as seen in Figure 2. In these tests one can make use of the power-law relationship (Equation (1)) that has been used repeatedly by previous investigators to describe the viscous behaviour of ice. An attempt to compare ice and snow behaviour using a powerlaw relation can be found in Bartelt and Reference Von MoosVon Moos (2000).
Figure 2 shows the variation of yield stress σ
ay with strain rate  for a number of initial densities ranging from 190 kg m−3 to as large as 435 kg m−3. Note, however, that the value of n increases with density, ranging from a low value of 1.8 at 190 kgm−3 to as high as 3.6 at 340 kg m−3 for a temperature T = −12°C.
For polycrystalline ice specimens tested under the same conditions, a value of n = 3.0–3.5 is reported, with an activation energy of Q = 78 kJ mol−1 (Reference Weertman, Whalley, Jones and GoldWeertman, 1973). This value of n is generally related to dislocation creep processes occurring within the ice crystals (Reference Langdon, Whalley, Jones and GoldLangdon, 1973). Other creep processes that could be involved are diffusional creep and grain-boundary sliding (Reference Langdon, Whalley, Jones and GoldLangdon,1973). A transition to linear flow (n = 1) generally takes place below a stress of 0.1 MPa (Reference ColeCole, 2001), which corresponds to a strain rate of 10−9 s−1. This strain rate is much lower than those investigated. An additional creep process that occurs in polycrystalline ice is grain-boundary sliding. Reference Langdon, Whalley, Jones and GoldLangdon (1973) differentiates between two mechanisms: (1) viscous shearing at the crystal boundaries (n = 1, activation energy Q = Qq
b, where Qq
b is the activation energy for diffusion via the grain boundaries) and (2) grain-boundary sliding by a dislocation process (n = 2, activation energy Q = Q
dl, where Q
dl is the activation energy for diffusion via the lattice). Reference Goldsby and KohlstedtGoldsby and Kohlstedt (1997) investigated the influence of grain-boundary sliding on the behaviour of fine-grained ice (3 μm < d < 90 μm, where d is the grain-size). They found an exponent of n = 1.8 for the investigated strain rates. They concluded that on the basis of the mechanical results and the microstructural investigations, grain-boundary sliding accommodated by a dislocation motion is the rate-limiting deformation mechanism in this n = 1.8 regime. These results were obtained for strain rates between  and temperatures T = −37°C.
Now consider the results of our triaxial experiments on snow with rounded grains of approximately 0.2 mm. For densities of ρ > 320 kg m−3, we determined an exponent n = 3.6, which agrees well with the value for normal-grained polycrystalline ice, reported by Reference Weertman, Whalley, Jones and GoldWeertman (1973). Therefore, we suppose that for snow densities of ρ > 320 kg m−3, dislocation creep in the ice skeleton is the rate-controlling process for the strain rates investigated at temperatures T = −12°C. Snow grain-size and shape could also influence the rate-controlling creep mechanism.
For snow densities of ρ < 280 kg m−3, the exponent n decreases with decreasing density. We determined a value of n = 1.8 for the lowest density we tested. An explanation for this behaviour can be forwarded by considering the different deformation modes of the ice skeleton. In the case of low-density snow, the coordination number N 3 is low (normally less than 2.5 bonds per grain), so the grains are not highly constrained and are surrounded by large pores that allow grains to move relative to each other in a shearing motion. As a consequence, bonds in low-density snow can be subjected to larger shearing stresses. Note that the coordination number N 3 describes the number of bonds per grain (Reference GublerGubler,1978).
Due to the higher shear stresses at the grain boundaries, deformation processes occurring at or near the grain boundaries increase in relevance. A possible explanation for the decrease in n is that these processes contribute more to the overall creep deformation. Unlike the previous case of higher-density snow, it is impossible to relate n to a specific creep process (Reference Langdon, Whalley, Jones and GoldLangdon, 1973). For lower-density snow, it appears that different creep mechanisms are being activated due to the higher shear stresses in the ice skeleton. The determination of the exponent n from the bulk deformation is not sufficient alone to identify a specific creep process or determine which creep process dominates. A change in the exponent n, however, indicates that different creep processes are being activated.
Our primary conclusion is that microstructure-based constitutive models must take into account the possibility that different creep mechanisms are active. Which process is rate-controlling is a function of density, texture and temperature. Presently, microstructural constitutive models (Reference Hansen and BrownHansen and Brown, 1988; Reference Mahajan and BrownMahajan and Brown,1993; Bartelt and Reference Von MoosVon Moos, 2000) assume that dislocation creep is the rate-controlling mechanism for all densities and temperatures. Our experimental results show that this is a questionable assumption. Temperature-dependent experiments are presently underway to determine the apparent activation energy Q as a function of density and temperature in order to investigate this phenomenon in more detail.
4.2 Non-linear behaviour of the stress–strain response
We observed that there was a considerable difference between the stress–strain response before a sample reached the yield stress and after it. As shown in Figure 6, higherdensity snow showed an almost linear response, whereas lower-density snow showed an increasingly non-linear relationship between stress and strain.
In order to quantify this behaviour, we divided the total strain into elastic, anelastic (or delayed elastic (subscript d)) and viscous parts:

The normalized secant modulus E s/E 0 is equal to the ratio of elastic to total strain

since

and

Figure 6 shows that for low-density snow, the normalized modulus E s/E 0 decreases rapidly during the first 0.1% of applied strain. For high-density snow, the decrease occurs only after a strain of 0.3%. Defining the amounts of each strain component relative to the total strain, we have

where

and

The sum of the anelastic and viscous strain increases more rapidly for lower-density snow. However, it is not clear from our experiments whether the anelastic or viscous component is responsible for this behaviour since the recoverable and viscous strain during unloading were not measured. The samples were always loaded with a constant strain rate and then allowed to relax, i.e. the deformation rate was set to zero and the sample was not free to deform. The anelastic response could not be determined.
In order to experimentally determine the amount of elastic, anelastic and viscous strain, tests were performed in which the relative amounts of the three strain components were directly measured during unloading. In these tests, the snow samples were strained in steps of Δ∊ to total strains of ∊ = 0.0025, 0.0050, 0.0075, 0.010, 0125, 0.015, 0.02 and 0.05. At each step, the specimen was unloaded and the rebound was measured. Examples of the test results are shown in Figures 14 and 15.
Viscoelastic response of snow. Density of sample ρ = 220 kg m−3;  ; T = −11.2°C. The figure indicates that snow exhibits a time-dependent and recoverable deformation.

Relative strain components γe, γd and γv as a function of total strain. Density of sample ρ = 220 kg m−3; ; T = −11.2°C.

Future research will be needed to investigate the influence of density and/or coordination number on the amount of elastic, anelastic and viscous strain for different strain rates and temperatures.
4.3. Work hardening
We identified a strain, ∊ c, at which the stress began to increase after the sample had already reached the yield stress σ ay. We termed this strain the “contact strain” and defined the stress increase, Δσ, to be a measure of the work hardening of the material.
As shown in Figure 11, Δσcanbe significantforlargeaxial deformations. Since Δσ represents an increase in material strength over time, it is an important phenomenon to investigate with respect to avalanche formation (Reference Bozhinskiy and LosevBozhinskiy and Losev, 1998).
The test results revealed that Δσ appears to be independent of the applied strain rate. Since polycrystalline ice does not exhibit strong work hardening for small finite strains (Reference ColeCole,1987), it appears that the work hardening of snow is due to kinematical aspects of the material deformation. Three potential kinematical processes that could influence the work hardening of snow are (1) large-scale interparticle slip after bond breakage, (2) bond growth and (3) bond formation.
The triaxial tests of Reference Navarre, Taillefer, Flavigny, Desrues and GauthierNavarre and others (1987) demonstrated that large-scale interparticle slip can cause an increase in the resisting force. However, interparticle slip is usually accompanied by a sudden strain softening. The measured stress does not increase gradually, but in a series of abrupt movements (Reference Von MoosVon Moos, 2000). Furthermore, interparticle slip occurs at high strain rates where the material behaviour is increasingly brittle. Interparticle slip was therefore discarded as a possible kinematical process causing work hardening in snow at the strain rates investigated.
Both bond growth and bond formation could produce work hardening. The latter mechanism is a purely kinematic one, which does not depend directly upon the mechanical properties of the matrix material. Bond growth, on the other hand, depends directly upon the mechanical properties of the matrix material, since it involves compressive deformations of the ice. Therefore, bond growth probably demonstrates some strain-rate dependence, whereas building of new bonds does not. In view of this, work hardening, since it has a very small dependence on strain rate, could be primarily due to the formation of new bonds. Admittedly, bond growth is probably not completely insignificant, but it does appear that bond formation must be predominant.
4.4. Confining pressure
The last factor investigated was the influence of confining pressure. As shown in Figure 12, high-density snow shows a constant axial yield stress with increasing confining pressure. This implies that the deviatoric yield stress decreases under an increasing confining pressure. This last observation does not agree with the behaviour of ice (Reference JonesJones,1982). In the investigated range of strain rates, confining pressures and temperature, the deviatoric yield stress of ice is independent of the applied confining pressure.
A possible explanation for this phenomenon can be found by investigating the influence of the confining pressure on the microstructural stress state. In our tests, pore air can move freely in and out of the sample (Reference Von Moos, Bartelt, Zweidler and BleikerVon Moos and others, 2003). Therefore, when a confining pressure is applied, the pore pressure remains constant. The state of stress in the necks (see Fig. 1), which is primarily responsible for the bulk material behaviour, does not change significantly since the surrounding pore air does not transfer the confining pressure to the ice skeleton. This means that the continuum state of stress does not correspond to the state of stress in the necks.
One question remains: why is it that confining pressure has no effect on the yield stress at higher densities but has an effect at lower densities? The pronounced increase in axial yield stress observed in the low-density specimens (ρ = 200 kg m−3) subjected to a confining pressure p c exceeding 4 kPa (Fig. 12) can be explained as follows. As shown by Reference Lang and HarrisonLang and Harrison (1995), the amount of initially applied confining pressure p c can produce a relevant change in density or even the microstructural state (e.g. the formation of new bonds). They concluded that the mechanical properties of the pre-strained bulk specimens do not correspond to the properties of the original, unloaded specimens. Our triaxial test results appear to corroborate the observations made by Lang and Harrison; however, they cannot be generalized for the whole range of densities and confining pressures. As shown in Figure 12, the confining pressure had to exceed a critical value, defined with respect to specimen density, in order to produce a change in the microstructure. This is the case when a confining pressure exceeding 4 kPa is applied to a snow specimen with low density, ρ = 200 kg m−3. The large initially applied confining pressure affects not only the axial yield stress, but also the kinematical behaviour of the specimen. This is shown in Figure 16a where the radial strain is plotted as a function of the axial strain. Note that all specimens initially compress, but the two specimens with higher confining pressures radially enlarge with increasing axial strain. For comparison, we also show the radial strain of the higher-density snow (ρ = 270 kg m−3) at much higher confining pressures (Fig. 16b). In this case, the applied confining pressure was below the critical value and did not influence the axial yield stress.
Radial-strain–axial-strain curve obtained in compression tests at various confining pressures for two densities: (a) ρ = 200 kg m−3 and (b) ρ = 270 kg m−3. Temperature T = −12°C; strain rate  . Note that the “sawtooth” nature of the curves is due to the non-continuous measurement of volume change, which is performed in steps.

5. Conclusions
Previous attempts to model the mechanical behaviour of snow have not included several effects which we have identified in our experiments. These include: the density dependence of the power-law exponent n; a critical strain which defines the onset of a strain-rate independent hardening; the independence of the axial yield stress in relation to confining pressure; and finally the density-dependent behaviour of the stress–strain response. All must be included in a constitutive model for snow.
In order to improve our understanding of snow avalanche formation, further investigations are needed. Both the temperature-dependent viscoelastic behaviour of snow and the transition from ductile to brittle behaviour of snow need to be clarified. Therefore, test series at higher strain rates above temperatures of −10°C are needed.
Acknowledgements
The authors would like to thank R. L. Brown of the University of Montana for his helpful discussions of the test results. In addition, the authors thank the editors and reviewers who improved the quality of this work greatly, especially D. M. Cole of the U.S. Army Cold Regions Research and Engineering Laboratory as well as S. J. Jones of the National Research Council of Canada. Finally, we thank the Swiss National Science Foundation for financially supporting this work.



