Introduction
Polypropylene (PP) is one of the most widely used engineering thermoplastics because of its merits such as low cost, low density, ideal thermal stability, high heat distortion temperature, excellent chemical, and mechanical properties [Reference Rizvi, Singh and Bhadu1, Reference Gulrez, Mohsin, Shaikh, Anis, Pulose, Yadav, Qua and Al-Zahrani2]. However, PP is limited to many applications because of its low fracture toughness at low temperature [Reference De Rosa, Auriemma, Vinti, Grassi and Galimberti3, Reference Greco, Mancarella, Martuscelli, Ragosta and Yin4, Reference Karger-Kocsis, Varga and Ehrenstein5, Reference Saffari and Sheikh6]. To overcome this drawback, several methods such as copolymerization of propene with ethylene or other olefins [Reference De Rosa, Auriemma, Vinti, Grassi and Galimberti3], adding a variety of toughening agents [Reference Greco, Mancarella, Martuscelli, Ragosta and Yin4], adding the nucleating agent to reduce the dimension of spherulites [Reference Karger-Kocsis, Varga and Ehrenstein5], and peroxide dynamic crosslinking [Reference Saffari and Sheikh6] have been widely reported.
Among these methods, blending PP with an elastomer has been proved effective to toughen PP [Reference Greco, Mancarella, Martuscelli, Ragosta and Yin4, Reference Dias, Lin, Poon, Chen, Hiltner and Baer7, Reference Wiwattananukul, Fan and Yamaguchi8, Reference Jiang, Tjong and Li9]. One typical example is styrene-butadiene-styrene block copolymer (SBS)/PP blends, where the addition of the SBS improves the low-temperature toughness of PP [Reference Das, Gautam and Pandey10, Reference Abreu, Forte and Liberman11, Reference Saroop and Mathur12, Reference Wu, Shentu and Weng13]. SBS presents a distinct two-phase structure, which consists of glassy polystyrene (PS) endblocks regularly arranged within a rubbery polybutadiene (PB) matrix [Reference Masson, Bundalo-Perc and Delgado14]. This unique structure of SBS offers PP with the desired properties, especially the good balance between impact toughness and rigidity [Reference Das, Gautam and Pandey10, Reference Abreu, Forte and Liberman11]. For example, the tensile and tear strength have been shown to decrease with the increasing SBS content, whereas the impact strength improves with the addition of SBS [Reference Abreu, Forte and Liberman11, Reference Das and Pandey15, Reference Tsai, Wu, Li, Wu and Leu16]. The loss in rigidity could be attributed to the reduction in crystallinity of the PP caused by SBS [Reference Mazidi, Hosseini, Berahman, Shekoohi and Basseri17].
For most elastomer-toughened plastic systems, the toughening effect strongly depends upon the phase morphology [Reference Xiu, Huang, Bai, Jiang, Chen, Deng, Wang, Zhang and Fu18]. In this case, a co-continuous phase structure consists of elastomer network structure intertwined with plastic matrix has been proved to improve the toughness [Reference Xiu, Huang, Bai, Jiang, Chen, Deng, Wang, Zhang and Fu18]. In addition to this merit, co-continuous morphology is useful in polymer composites area, where it could reduce the percolation threshold of the function fillers and result in a sudden increase of a certain property (i.e., the electrical conductivity) at the low loading of fillers [Reference Sun, Gong, Pu, Bao, Xie, Yang and Yang19, Reference Altobelli, Salzano de Luna and Filippone20]. In order to obtain the co-continuous phase morphology in polymer blends, several parameters, including the blending ratio and melt viscosity ratio between different components, can be designed [Reference Sun, Gong, Pu, Bao, Xie, Yang and Yang19, Reference Al-Saleh and Sundararaj21].
In our previous work [Reference Wang and Zhang22], it was found that SBS/PP blends formed a unique sandwich structure consisted of a layer of co-continuous SBS/PP between two layers of PP. Such a sandwich structure was attributed to the difference in complex viscosity and surface tension between SBS and PP. As an ongoing study, the main objective was to investigate the role of molecular weight of PP in the sandwich structure of SBS/PP blends. Specifically, the SBS phase domain size in SBS/PP co-continuous layer was measured and compared. Other characterizations including the solvent extraction, mechanical, rheological, and wide-angle and X-ray scattering tests were performed to establish the relationships between structure and properties.
Results and discussion
Molecular weight measurement
The relative molecular weight and molecular weight distribution of different polymers can be found in Supplementary material (see Fig. S1 and Table SI). The  ${\bar{M}_{\rm{n}}}$ of PP 001, PP 013, PP 085, PP 150, and SBS were 104,500, 63,000, 53,700, 55,500, and 261,000 g/mol, respectively, while the corresponded
 ${\bar{M}_{\rm{w}}}$ were 1,029,000, 562,400, 410,900, 350,100, and 277,300 g/mol, respectively. In addition, the polydispersity index (PDI) value of different PPs ranged from 6 to 10, which was considerably higher than that of SBS (1.06). This result suggested that SBS has the narrowest molecular weight distribution.
Solvent extraction test
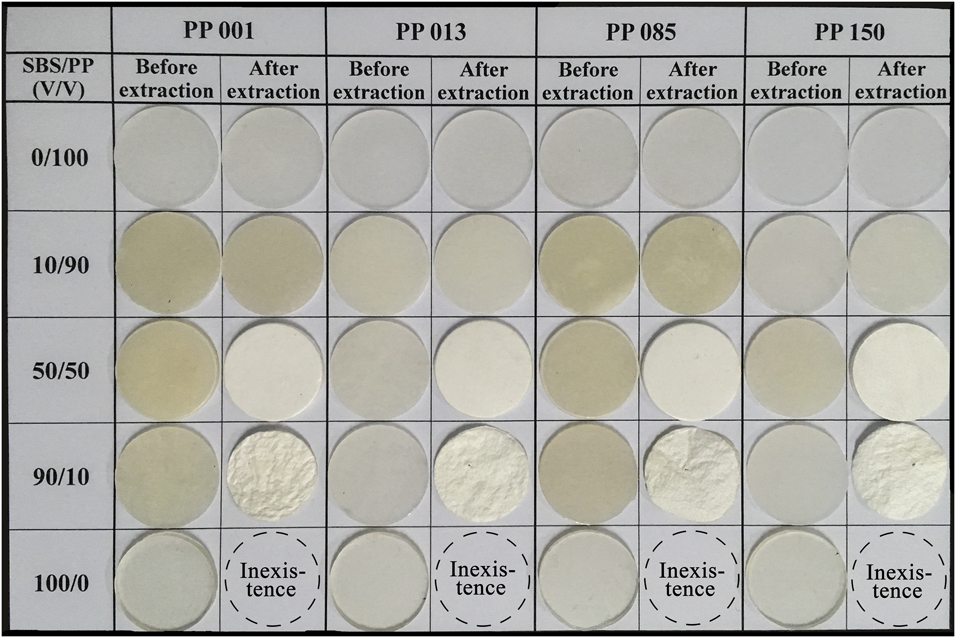
The digital images of different samples before and after extraction were shown in Fig. 1. SBS can be completely dissolved by toluene (see “100/0” in Fig. 1). But the appearance of PP did not change too much after the toluene extraction (see “0/100” in Fig. 1). With respect to SBS/PP blends, all the samples did not break into pieces after extraction, indicating the existence of PP continuous phase. Although the framework of the samples was well maintained after extraction, different blending ratios did result in different morphologies. As the SBS content increased to 50 vol%, the extracted sample became whiter. Wrinkles were observed as the SBS content increased to 90 vol%. All these features were attributed to the extraction of SBS phase.
The digital image of samples before and after solvent extraction tests.

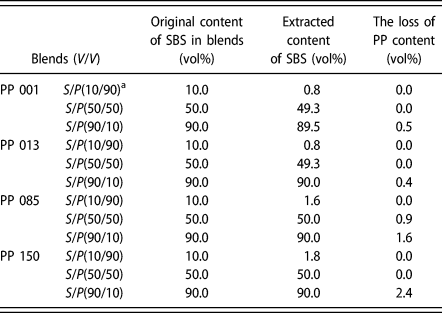
In order to make quantitative analysis, the extracted content of SBS and the loss content of PP derived from the sample weight before and after extraction were summarized in Table I. As shown in Table I, the volume ratio between SBS and PP influenced the extracted content of SBS. For S/P(50/50) and S/P(90/10), the extracted SBS content was very close to the original content of SBS, indicating that most of the SBS component was removed by toluene. However, for S/P(10/90), the extracted content of SBS was 0.8, 0.8, 1.6, and 1.8 vol% for PP 001, PP 013, PP 085, and PP 150, respectively, which were far less than the original SBS content (10.0 vol%). We herein attributed such dependence of extraction on the composition to the different phase structures. For S/P(10/90), a sea-island phase structure was expected due to the low content of SBS, where the SBS served as a dispersed phase in the form of spherical droplets [Reference Abreu, Forte and Liberman11, Reference Das and Pandey15]. For S/P(50/50) and S/P(90/10), a co-continuous phase structure appeared [Reference Zanjanijam, Hakim and Azizi23, Reference Zhang, Liu, Wang and Wu24]. The isolated SBS “droplet” in the “sea-island” phase morphology was protected by PP from the solvent extraction. In addition, the loss content of PP in S/P(90/10) increased as PP molecular weight decreased. This was likely because the higher molecular weight of PP was more entangled and harder to extract.
The parameters derived from solvent extraction tests.

a ‘S’ represents SBS, ‘P’ represents PP.
Morphology analysis
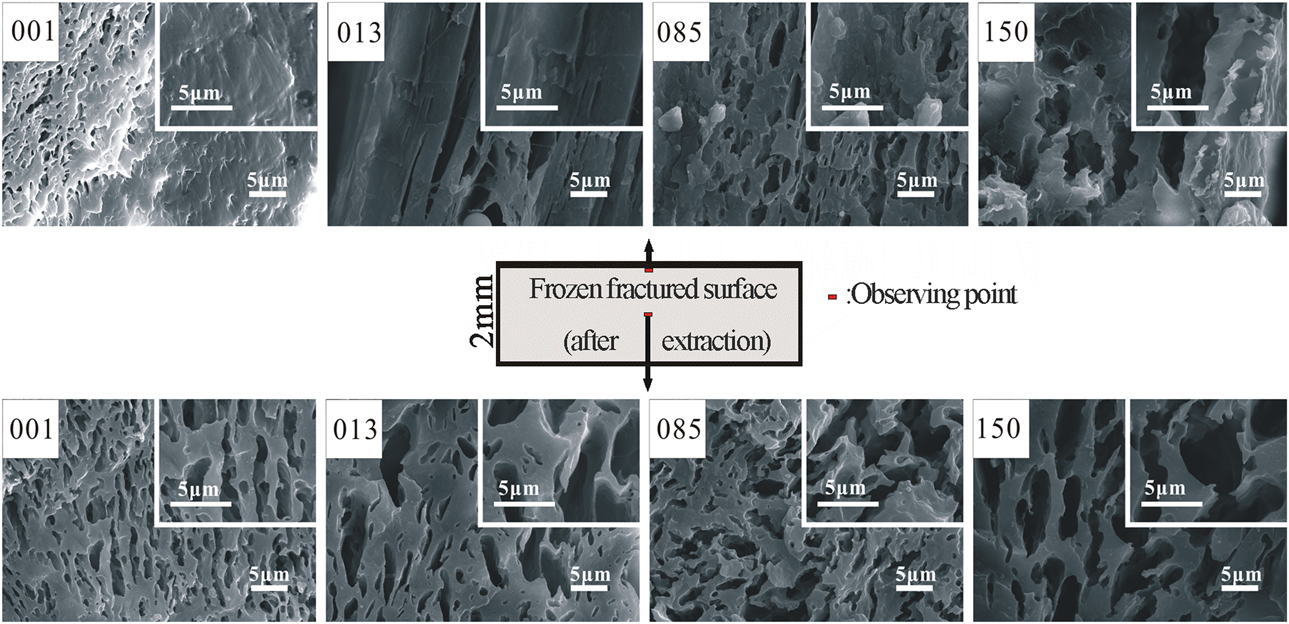
Figure 2 showed the morphology of the cryo-fractured surfaces of different S/P(50/50) binary blends after extraction in toluene. One can see in Fig. 2 that the top/bottom part of the sample was seldomly etched, while many rod-like holes were observed in the middle section of the sample. Since only SBS was removed after toluene extraction, a sandwich structure that consisted of a layer of co-continuous SBS/PP between two layers (the top and the bottom layer) of PP was suggested. The observed phase structure was consistent with the previous report and was mainly attributed to the phase separation [Reference Abreu, Forte and Liberman11, Reference Mazidi, Hosseini, Berahman, Shekoohi and Basseri17, Reference Wang and Zhang22].
SEM micrographs of S/P(50/50) blends with different types of PP after extraction.

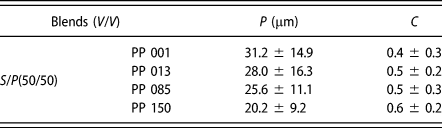
Although all the blends exhibited a sandwich structure, the effect of molecular weight of PP on the specific morphological results was impressive. First, the thickness of PP layer was thinner for blends with the low molecular weight PP. This result was expected, since low molecular weight PP exhibited lower chain entanglement and was less resistant to the invasion of SBS. In addition, the SBS phase size (refer P value in Table II) in co-continuous SBS/PP layer increased as the PP molecular weight decreased, whereas the corresponded C value was seldomly changed. These can be explained by the different viscosity of different PP matrices, which will be discussed in section “Rheological measurement” [Reference Zhang, Zhang, Su, Jiang, Jiang and Wu25].
The parameters for S/P(50/50) blends obtained from SEM micrographs.

Mechanical properties
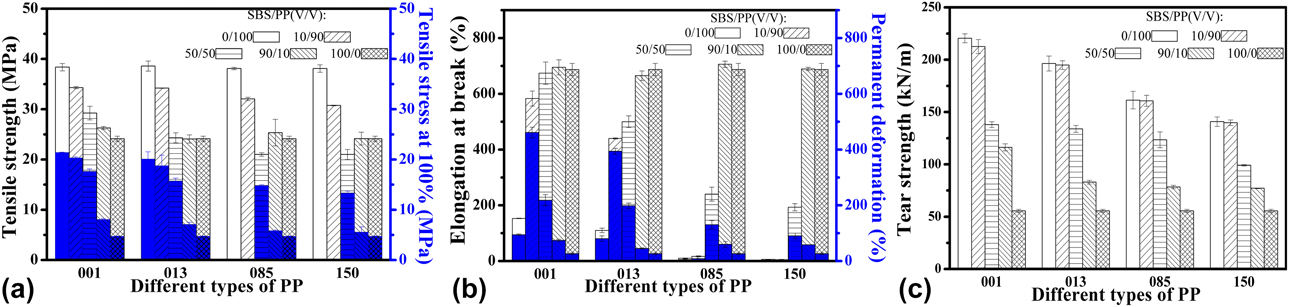
Figure 3 showed the tensile and tear properties of pure polymers and SBS/PP blends. For the pure PP with different molecular weight, the tensile strength values of different PPs were close with each other, indicating that the molecular weight did not play a key role in the tensile strength of the pure PP. However, the elongation at break of PP slightly decreased with the decreasing molecular weight [Reference Zhang, Li, Shen, Lin and Shan26]. SBS exhibited higher elongation at break but lower tensile strength than PP. With respect to SBS/PP blends, the addition of SBS inevitably decreased the tensile strength but increased the elongation at break. The increase of elongation at break suggested the improved fracture toughness. Similar trends were reported in previous works [Reference Das, Gautam and Pandey10, Reference Abreu, Forte and Liberman11, Reference Wang and Zhang22, Reference Hernández, Santana, Ichazo, Gonzáleza and Albanoc27], which was mainly attributed to the soft nature of SBS. It was interesting to note that, in PP 085 and PP 150 systems, the tensile strength of S/P(50/50) was unexpectedly lower than that of S/P(90/10), whereas PP 001 and PP 013 systems did not show the same trend. This difference could be explained by the larger SBS phase size in PP 085 and PP 150 systems than those in PP 001 and PP 013 systems. The larger SBS phase size indicated lower interfacial tension between SBS/PP interfaces [Reference Das and Pandey15, Reference Xiu, Huang, Bai, Jiang, Chen, Deng, Wang, Zhang and Fu18, Reference Sun, Gong, Pu, Bao, Xie, Yang and Yang19]. The lower interfacial tension was more easily destroyed under the condition of stress stimuli, resulting lower tensile strength.
Mechanical properties of different materials: (a) tensile strength and tensile stress at 100%; (b) elongation at break and permanent deformation; (c) tear strength.

The tensile stress at 100% of PP 001, PP 013, and SBS were 21.3 MPa, 20.0 MPa, and 5.3 MPa, respectively. However, the tensile stress at 100% of PP 085, PP 150, and their blends [S/P(10/90)] were not available because of their low elongation at break (<100%). With regard to other SBS/PP blends, the tensile stress at 100% and permanent deformation decreased continuously with the increasing SBS content, which were ascribed to the low tensile strength and high elastic resilience of pure SBS. The tear strength of pure PP decreased as the molecular weight of PP decreased, suggesting the strong dependence of molecular weight on the tear properties. For SBS/PP blends, the tear strength gradually decreased with the increasing SBS content.
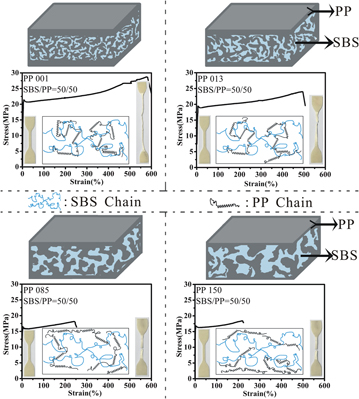
The tensile stress–strain curves and the proposed schematic representation of microstructure diagram of S/P(50/50) were shown in Fig. 4. As shown in Fig. 4, “stress-hardening” behavior was observed for all SBS/PP(50/50) blends, where the stress at break was higher than the yield stress. Similar results were reported previously [Reference Wang and Zhang22]. However, the elongation at break that represented the length of “stress-hardening” exhibited a declining trend as the molecular weight of PP decreased. We attributed this interesting phenomenon to the unique microstructure of PP phase caused by its different molecular weight. Herein, PP with higher molecular weight (i.e., PP 001) exhibited a thicker layer, and a thinner layer was expected for PP with low molecular weight (i.e., PP 150), which were supported by the afore-mentioned scanning electron microscopy (SEM) results. In this case, the thicker PP layer could be more resistant to the stress stimuli during the tensile tests, and thereby its “stress-hardening” was long-lasting.
Stress–strain curves and schematic representation of microstructure diagram of SBS/PP(V/V = 50/50) binary blends with different types of PP.

Rheological measurement
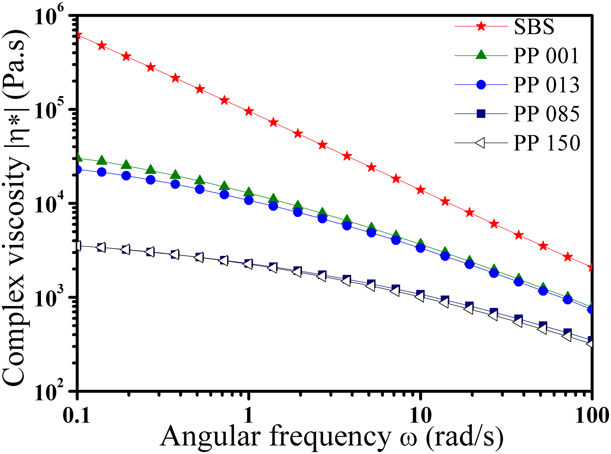
Figure 5 showed the relationship between dynamic frequency and complex viscosities. As shown in Fig. 5, the complex viscosity gradually decreased with the increasing angular frequency which was assigned to the shear-thinning behavior [Reference Zhang, Liu, Wang and Wu24, Reference Wu, Thakur and Kessler28]. With respect to different PPs, the order of complex viscosity was PP 001 > PP 003 > PP 085 ≈ PP 150, which corresponded well with the order of their molecular weight. For SBS, its complex viscosity was much higher than that of PP. This difference was more conspicuous at the low angular frequency region (e.g., the complex viscosity of SBS was nearly 20 times higher than that of PP 001). Based on the rheological results, it was easy to understand the larger phase size of SBS observed in PP 150 system (refer Fig. 2). Because of the lower viscosity of PP 150, it was easier for the PP 150 to entrap the SBS phase, based on which SBS phase could be fully coarsened and coalesced. In this case, the SBS in low molecular weight PP blends was expected to exhibit higher phase domain size.
The relationship between complex viscosity and angular frequency for SBS and PP.

WAXS measurement
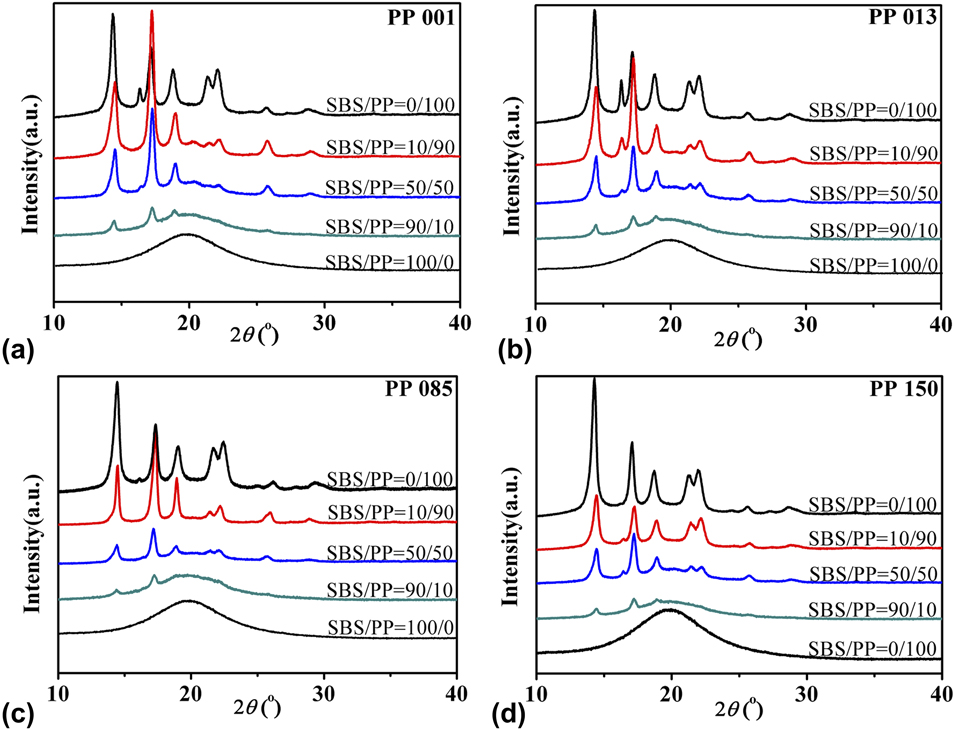
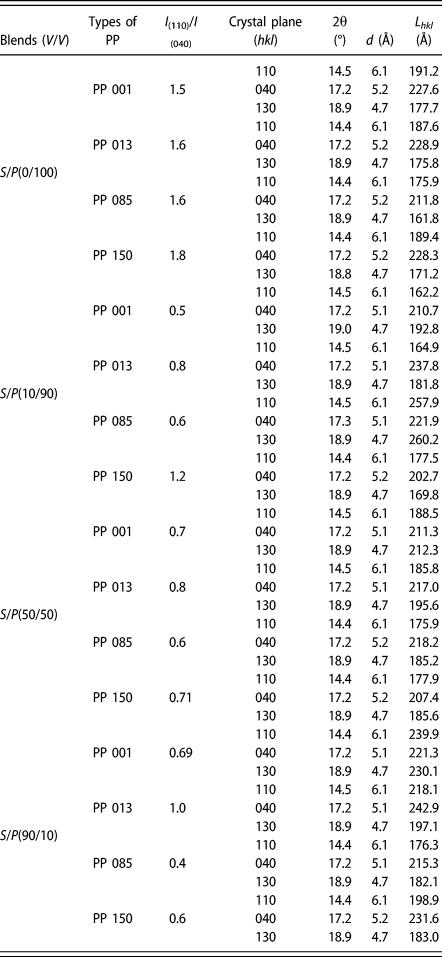
The crystal structures of different blends were investigated by wide angle X-ray scattering (WAXS). Figure 6 displayed the relationship between the intensity and 2θ. Both the theoretical and experimental crystallinities were shown in Table III, while other crystal parameters such as d value and apparent crystallite size were listed in Table IV. As shown in Fig. 6, all the samples except SBS exhibited diffraction peaks at about 2θ = 14.5, 17.4, 19.1, 21.6, and 22.2°. These were characterization peaks of the stable monoclinic α-form of isotactic PP and were assigned to the crystal plane of (110), (040), (130), (131), and (111), respectively [Reference Gulrez, Mohsin, Shaikh, Anis, Pulose, Yadav, Qua and Al-Zahrani2, Reference Greco, Mancarella, Martuscelli, Ragosta and Yin4, Reference Wang and Zhang29, Reference Chen, Dai, Yang, Huang, Zhang and Wang30]. Interestingly, a new diffraction peak at 2θ = 16.4° assigned to the (300) crystal plane of β-hexagonal crystals was observed in some blends, suggesting that β crystalline phases were formed [Reference Greco, Mancarella, Martuscelli, Ragosta and Yin4, Reference Wu, Thakur and Kessler28, Reference Kang, Yang, Chen, Cao and Xiang31, Reference Gohn, Rhoades, Okonski and Androsch32]. The formation of β-hexagonal crystals was ascribed to the short propylene sequences in PP chains [Reference Wang and Zhang29, Reference Kang, Yang, Chen, Cao and Xiang31].
WAXS patterns of SBS/PP binary blends: (a) SBS/PP blends with PP 001; (b) SBS/PP blends with PP 013; (c) SBS/PP blends with PP 085; (d) SBS/PP blends with PP 150.

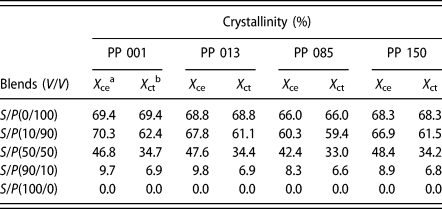
The crystallinity of different materials.

a Experimental value of crystallinity.
b Theoretical value of crystallinity: suppose the crystallinity of PP is constant and PP is well dispersed in blend.
Different parameters derived from WAXS results.

As shown in Table III, the crystallinities of different PPs were about 70%, indicating that the molecular weight did not influence the crystallinity. Addition of SBS considerably decreased the crystallinity in the binary blend. This was expected, since SBS did not contribute to the crystallinity and thereby at least exerted a “diluting” effect. In addition, it was interesting to note that the measured crystallinity was lower than the theoretical one that was calculated based on the “rule of mixture”. This indicated that, in addition of the “diluting” effect, SBS also hindered the crystallization of PP, which resulted in a lower crystallinity.
As shown in Table IV, the ratios of I (110)/I (040) decreased dramatically with the addition of SBS, indicating that the crystal growth along the a axis was restricted by the SBS chains [Reference Greco, Mancarella, Martuscelli, Ragosta and Yin4]. With regard to the d values, almost no changes were observed, indicating that the interplanar distance was independent of the SBS contents and PP molecular weight. For L hkl, the high molecular weight of PP generally resulted in a larger crystallite size. This could be attributed to its longer molecular chains. When polymer chains crystallized and were rearranged into crystal lattice, longer molecular chains allowed more polymer sequences to enter the crystal lattice and thereby resulted in the larger lamellar size. With respect to the effect of SBS content on the crystallite size of different blends, different diffraction peaks exhibited different behaviors. Introduction of SBS increased the L 110 value but decreased the L 040 value, suggesting that the presence of SBS increased the packing order within α crystal but favored the orientation of the b axis in the crystallization process.
Conclusion
In this study, the influence of PP molecular weight on the structure–properties relationship of SBS/PP blends with different volume compositions was investigated. In these blends, PP was always present as continuous phase, which was independent of the molecular weight and volume content of PP, while there was a transition of SBS phase from the dispersed to the co-continuous phase when the SBS content was 50 vol%. The morphological results suggested a unique sandwich structure where the top/bottom PP layers covered the co-continuous structural SBS/PP core. It was found that the molecular weight of PP influenced the sandwich structure; the lower molecular weight decreased the thickness of PP layer but increased the SBS phase domain size. Such changes could be explained by the entanglements between different molecular chains and the different complex viscosity of different components. As a result, PP with high molecular weight exhibited noticeable “stress-hardening” behavior. WAXS results suggested that the molecular weight of PP did not influence the crystallinity. But the composition of SBS/PP did influence the crystallinity, where the higher content of SBS resulted in the lower crystallinity. It was also found that the crystallite size varied as the PP molecular weight and blending composition changed.
Methodology
Materials and preparation
Four types of commercial isotactic PP [PP 001, PP 013, PP 085, PP 150, density (ρ) = 0.90 g/cm3] were provided by Nanjing Jinling Plastic & Petrochemical Co., Ltd., Nanjing, China. The melt flow rate (MFR) of PP 001, PP 013, PP 085, and PP 150 are 0.45, 1.21, 8.76, and 15.40 g/10 min at 230 °C/2.16 kg, respectively. Star-shaped SBS (4402, ρ = 0.94 g/cm3, S/B ratio = 40/60, MFR = 0.1 g/10 min at 200 °C/5 kg) was supplied by Sinopec Assets Management Corporation Baling Petrochemical Branch, Yueyang, China. The antioxidant with the commercial name of B215 was used.
Pure polymers and SBS/PP binary blends with the volume ratios of 90/10, 50/50, 10/90, and 0/100 were prepared via melt mixing, together with 0.3 wt% antioxidants. The mixing process was conducted on a two-roll mill at 180 °C. Once the compounds were obtained, they were compression molded into sheets with 2 mm thickness. The samples with different dimensions were cut from these sheets for characterizations. Specifically, small wafers with the diameter of 23 mm were cut for solvent extraction, rheological, and X-ray diffraction (XRD) tests. In addition, dumbbell and angle-shaped specimens were prepared for tensile and tear tests, respectively. Before characterizations, all the specimens were annealed at 85 °C for 4 h.
Molecular weight measurement
A gel permeation chromatograph (PL-120, Agilent, Palo Alto, California) was used to measure the weight-average molecular weight ( ${\bar{M}_{\rm{w}}}$), number-average molecular weight (
 ${\bar{M}_{\rm{n}}}$), and PDI of SBS at 25 °C. Tetrahydrofuran (THF, 0.1 mg/mL) was used as the isocratic mobile phase at a flow rate of 1 mL/min. Polyethylene glycol was utilized as the calibration standards. To measure the molecular weight of PP samples, a high temperature gel permeation chromatograph (PL-220, Waters, Milford, Massachusetts) with a flow rate of 1 mL/min and 150 °C was used. Before each test, the sample was completely dissolved by 1,2,4-trichlorobenzene with a concentration of 0.1 mg/mL.
Solvent extraction test
For each solvent extraction test, the specimen was immersed in toluene for 4 weeks at room temperature to completely remove SBS phase. The solvent was replaced with fresh one once per week. After extraction, the specimens were dried at 85 °C for 24 h to remove the solvent residue. The sample weight before and after solvent extraction was recorded.
SEM
To investigate the phase morphology of the blends, a SEM (JSM-6510, JEOL, Tokyo, Japan) with a working voltage of 15 kV was used to observe the morphology of the samples. Before observation, the cryo-fractured surfaces were etched with toluene for 24 h at room temperature to dissolve SBS phase. After drying, both the central and marginal areas of the surface morphology were observed by SEM. The circularity ratio (C) value was calculated based on the morphological results according to the following equation:
 $$C = 4\pi {A \over {{P^2}}}\quad ,$$
where A and P was the area and perimeter of the SBS phase, respectively. For the meaning of C, C = 1 indicated that phase was circular in shape, whereas irregular and deformed phase usually exhibited C = 0 [Reference Wang and Zhang22, Reference Zanjanijam, Hakim and Azizi23].
Mechanical characterization
Tensile and tear properties were carried out using a universal testing machine (CMT 5254, Shenzhen SANS Testing Machine Co., Ltd., Shenzhen, China) at a stable rate of 50 mm/min, following ISO37 and ISO34, respectively. All the tests were performed in triplicate and the average value was reported.
Rheological measurement
Rheological properties were investigated with a parallel plate rheometer (MCR302, Anton Paar, Graz, Austria) at 180 °C. A constant strain of 2% was selected to guarantee that all the tests were performed within the linear-viscoelastic limit. A frequency sweep in the range from 0.1 to 100 rad/s was utilized.
WAXS measurement
WAXS measurement was recorded in an XRD diffractometer (SmartLab TM 3 kW, Rigaku corporation, Tokyo, Japan) using Cu Kα radiation (λ = 0.154 nm; 40 kV and 30 mA). Diffraction pattern was collected from 10 to 40° at a scanning rate of 10°/min. In order to investigate the crystal structures, the interplanar distance (d value) and apparent crystallite size (L hkl) were calculated by the Bragg equation [Eq. (2)] and the Scherrer formula [Eq. (3)], respectively [Reference Greco, Mancarella, Martuscelli, Ragosta and Yin4, Reference Ma, Chen, Zhang and Wang33],
 $$d = {\lambda / {2\;\sin \;\theta \quad ,}}$$
 $${L_{hkl}} = {{k\lambda } / {B\;\cos \;\theta \quad ,}}$$
where λ is the wavelength of the radiation used, θ is the Bragg angle, k = 0.89 is the structure factor, and B is taken as the full width at half-maximum of the diffraction peak.
Supplementary material
To view supplementary material for this article, please visit https://doi.org/10.1557/jmr.2019.62.
Acknowledgments
This work was supported by the Priority Academic Program Development of Jiangsu Higher Education Institution (PAPD).