
Nanopores through graphene of single-atom thickness, graphene nanopores, are expected to realize extremely high efficiency in various applications such as DNA sequencing,[ Reference Garaj, Hubbard, Reina, Kong, Branton and Golovchenko 1 , Reference Heerema and Dekker 2 ] water desalination,[ Reference Koh and Lively 3 , Reference Surwade, Smirnov, Vlassiouk, Unocic, Veith, Dai, Mahurin and Karnik 4 ] and selective separation of ions and chemical species.[ Reference Kim, Yoon, Yoon, Yoo, Ahn, Cho, Shin, Yang, Paik, Kwon, Choi and Park 5 , Reference Jain, Rasera, Guerrero, Boutilier, O'Hern, Idrobo and Karnik 6 ] This is because the flow rate through the pore dramatically increases with reduction of the substrate thickness. However, the size-controlled formation of a nanoscale hole in graphene is still challenging. Different from nanopores in other solid substrates created by ion beams,[ Reference Li, Stein, McMullan, Branton, Aziz and Golovchenko 7 ] graphene nanopores are typically drilled using beams of electrons (e-beams).[ Reference Garaj, Hubbard, Reina, Kong, Branton and Golovchenko 1 , Reference Merchant, Healy, Wanunu, Ray, Peterman, Bartel, Fischbein, Venta, Luo, Johnson and Drndić 8 , Reference Schneider, Kowalczyk, Calado, Pandraud, Zandbergen, Vandersypen and Dekker 9 ] In this approach, the highly focused election beam of a transmission electron microscope operated at several hundred kV is focused onto the graphene continuously until achieving a hole of the designated size. However, the high-acceleration voltage of the electron beams could potentially induce damage to the graphene around the pore.
A good method for creating nanopores in graphene should satisfy: (1) controllable formation to the desired dimension and (2) stability (maintaining the shape of the hole) for the desired length of time. The ability to control the hole-size accurately is critical in many single-molecule analyses and size-specific separations of molecules because they utilize a property change by geometric discrepancy at the atomic level. For example, DNA sequencing with graphene nanopores uses the difference in the ionic current depending on the shape of the four bases in DNA (Adenine, Cytosine, Guanine, and Thymine).
In addition, it is known that a nanopore in graphene is not stable against surface-adsorbed C-atoms (i.e., carbon adatoms).[ Reference Zan, Ramasse, Bangert and Novoselov 10 , Reference Tsetserisa and Pantelides 11 ] This weakness is observed even in an ultra-vacuum environment. An individual carbon atom interacts with hydrogen-passivated graphene nanopores and easily forms a planar network filling the nanopores because of hybridization of the s- and p-orbitals of carbon atoms. Such short lifetimes make the applications involving graphene nanopores to be considerably limited. Recently, however, Lee et al.[ Reference Lee, Yang, Zhou, Pennycook, Pantelides and Chisholm 12 ] showed experimentally as well as theoretically that a graphene nanopore can be stabilized by passivating the perimeter carbon atoms with Si-atoms because the latter energetically favor tetrahedral coordination. It forces carbon adatoms to form dendrites sticking out of the graphene plane.
Considering all the above, in this study we propose a new pore formation process in graphene by Si-nanoparticle bombardment and characterize the anomalous features of the proposed process. These are implemented by using extensive molecular dynamics (MD) simulations with rigorous potential models. Such collision-induced pore formation involves several phenomena including deformation of the projectile particles and the graphene, fragmentation and/or exfoliation of the particles (depending on their size), bond-breaking between C-atoms in the graphene, and bond-formation between Si- and C-atoms. The MD simulations can visualize the details of all those processes, and the observations can be thoroughly analyzed with interaction energy approach. Competitive interactions among atomic pairs (Si–Si, Si–C, and C–C) produce several interesting behaviors during pore formation, depending on the size of the bombardment particles. The Si-nanoparticle bombardment has been already applied to microstructure patterning on various substrates.[ Reference Di Fonzo, Gidwani, Fan, Neumann, Iordanoglou, Heberlein, McMurry, Girshick, Tymiak, Gerberich and Rao 13 ]
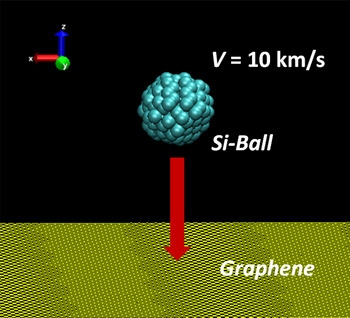
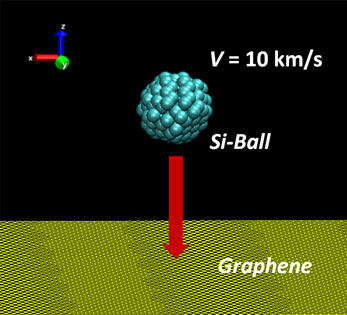
In the present MD simulations, a Si-nanoparticle was projected to the center of a piece of single-layer graphene (32.174 × 32.189 nm2) at the speed of 10 km/s [see Fig. 1]. The four corners of the graphene were fixed and the graphene consisted of 39,693 C-atoms. The size of the graphene piece was large enough to avoid interference by edge reflection of the bombardment-induced fluctuation during penetration—the elastic wave by bombardment did not reach the edge of graphene. Because all the penetration processes happened within a very short period (4.8 ps), the constant volume-constant energy (NVE) ensemble was used. The time-step in the simulations was Δt = 0.5 fs. To describe the bond breaking and formation in the simulations, the Tersoff potential[ Reference Tersoff 14 ] was employed for Si–Si and Si–C pairs while the AIREBO potential[ Reference Stuart, Tutein and Harrison 15 ] was used for C–C pairs. Ziegler–Biersack–Littmark screened nuclear repulsion[ Reference Ziegler, Biersack and Littmark 16 ] was also included to describe high-energy collisions between atoms. Particles of five sizes were considered by varying the diameter (d = 1.0, 1.5, 2.0, 3.0, and 4.0 nm). The initial position of the graphene and nanoparticle were z = 3.0 nm and z = 10.0 nm, respectively. All the MD simulations in this study were performed with LAPPMS.[ Reference Plimpton 17 ]
Schematic representation of projection of Si-nanoparticle onto graphene.

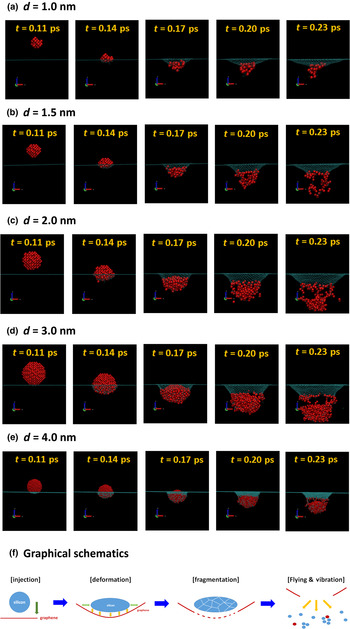
Figure 2 illustrates the pore formation due to Si-nanoparticle bombardment for the five experimental particle sizes [see Figs. 2(a)–2(e)]. The snapshots were rendered with VMD.[ Reference Humphrey, Dalke and Schulten 18 ] From the figure, we find that the pore formation process consists of the following four stages: (1) The first is approaching stage: a high-speed particle approaches the graphene (t = 0.11 ps) and the particle and graphene start to interact. (2) The second is contact and deformation stage. In this stage, deformation of both particle and graphene occurs (t = 0.14 and 0.17 ps). The spherical shape is distorted to a pancake or oblate form, or is unchanged, depending on the particle size. Also, bulging and dishing occur in the graphene. In the bulging area, the plate conforms to the shape of the projectile while in the dishing zone, the bending of the plate extends outward from the contact to between the projectile and plate. (3) The third is reaction stage. In this stage, particle fragmentation with bond-breaking of Si–Si, perforation with bond-breaking of C–C, and passivation via bond-formation of Si–C in the perimeter occur simultaneously (t = 0.17 and 0.20 ps). (4) The final is escape stage. In this stage, the single atoms and clusters/debris are flying into free space and the penetration-induced oscillation starts to travel in the graphene (elastic wave). Once perforation occurs, the petals are generated on the backside because of high-strain-rate of graphene. They were recombined with the graphene piece soon after the escape of the particle to form a stabilized equilibrated pore. This penetration process is graphically summarized in Fig. 2(f). However, if the particle is small as d = 1.0 nm, it could not pass through the graphene: it was disrupted and the fragments were simply attached to the graphene. It should be noted that the observation from Fig. 2 indicates that the drilling of nanopores through graphene with Si-nanoparticle bombardment can overcome two major difficulties of graphene nanopores: (1) control of pore size and (2) pore stabilization by passivation of Si-atoms on the rim of the pore. The pore formation process was further probed quantitatively by illustrating the temporal variation of the radial distribution functions (RDF) of the carbon atoms in the graphene.
Visualization of pore formation due to Si-nanoparticle bombardment for particles of various diameter: (a) d = 1.0 nm; (b) d = 1.5 nm; (c) d = 2.0 nm; (d) d = 3.0 nm, and (e) d = 4.0 nm. (f) Graphical presentation of pore formation due to Si-nanoparticle bombardment.

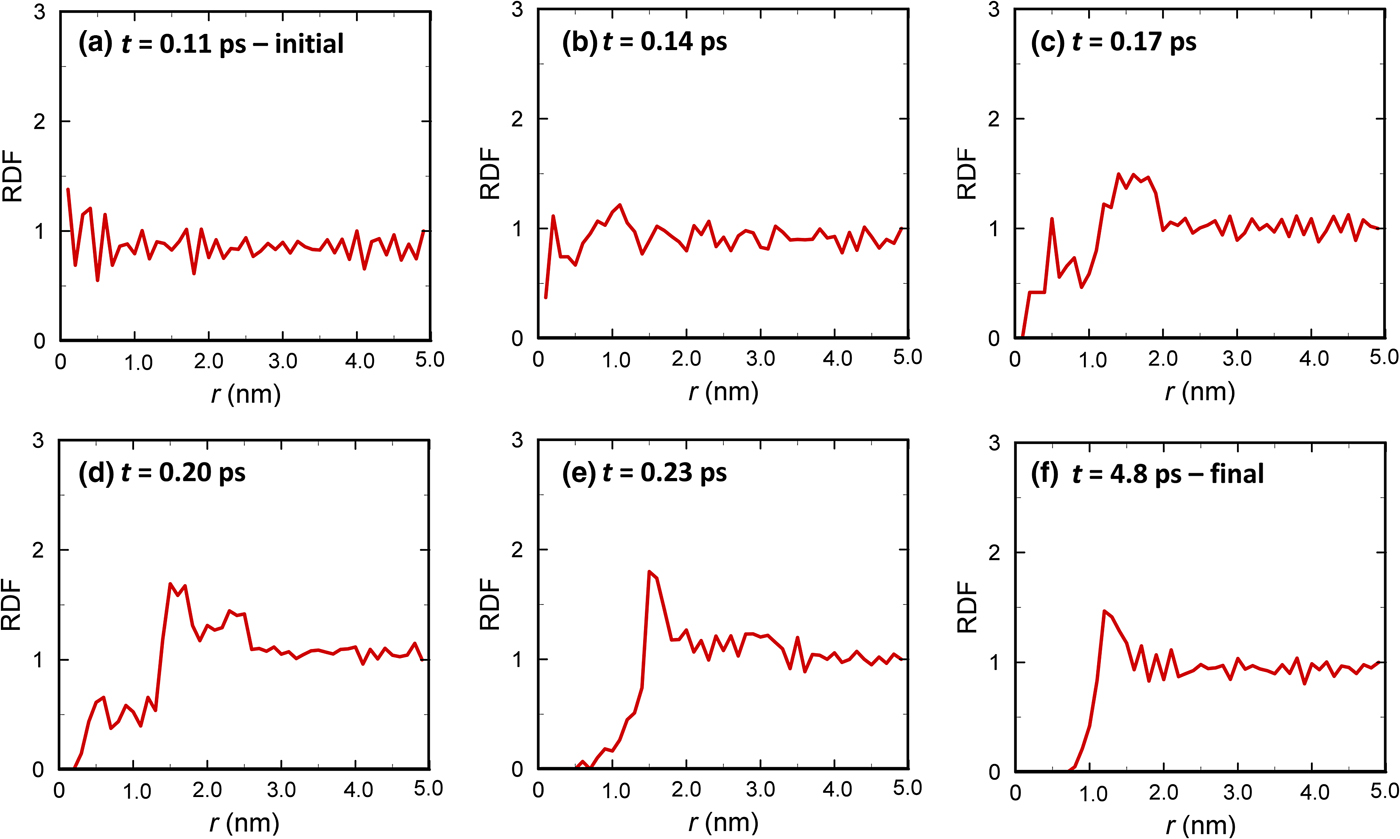
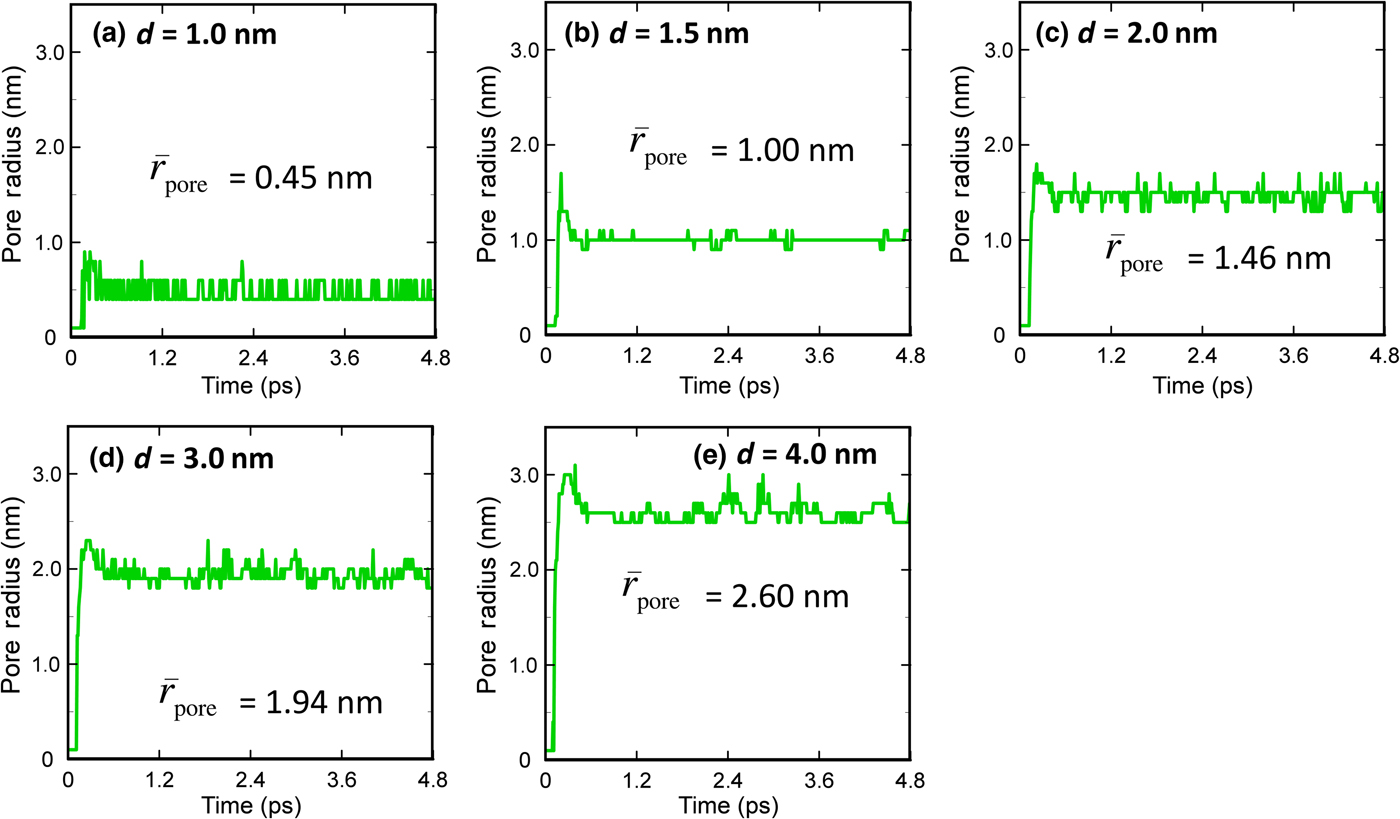
Figure 3 exemplifies the history of the RDFs for the case with d = 2.0 nm. Before t = 0.11 ps, the particle does not arrive at the graphene so that the RDF oscillates only around the value of one. At t = 0.14 ps (deformation stage), the particle is deformed to an oblate shape and a bulge forms in the graphene. Most C–C bonds are stretched but are still connected; while a small number of C-atoms in the center are dislocated radially (a tiny hole is initiated). As a result, a peak starts to form in the RDF. As the particle penetrates the graphene (t = 0.17 and 0.20 ps), the oblate ball is fragmented and the C–C bonds in the graphene break, allowing perforation by the shattered Si-nanoparticle, and thereby the tiny hole initiated becomes enlarged. In the RDF plot, this appears as the reduction of RDF value for r < 1.5 nm and the growth of a peak in the region of 1.5 nm < r < 2.0 nm. At t = 0.23 ps, the disrupted particle has nearly escaped the graphene and the hole is clearly seen as the region in which the RDF value is zero. The hole at t = 0.23 ps is not stable because the number of C-atoms in the first peak at r = 1.5 nm is too large (RDF ~ 1.8). Therefore, the peak shifts to r = 1.2 nm via structural relaxation [see Fig. 3(f)], while the peak value also decreases because RDF ≈ 1.5. Considering this dynamic behavior of the hole in the graphene, in this study the pore radius is defined as the distance from the center of graphene to the first peak of RDF at stable state (long-time limit). Figure 4 presents the dynamic behavior of the pore radius for the particles of various sizes.
Radial distribution function (RDF) for the carbon atoms in graphene: (a) t = 0.11 ps; (b) t = 0.14 ps; (c) t = 0.17 ps; (d) t = 0.20 ps; (e) t = 0.23 ps; (f) t = 4.8 ps. Here, r is the distance measured from the graphene center. These plots are for the particle with d = 2.0 nm.

Time history of pore radius formed in graphene for various particle sizes: (a) d = 1.0 nm; (b) d = 1.5 nm; (c) d = 2.0 nm; (d) d = 3.0 nm; (e) d = 4.0 nm.

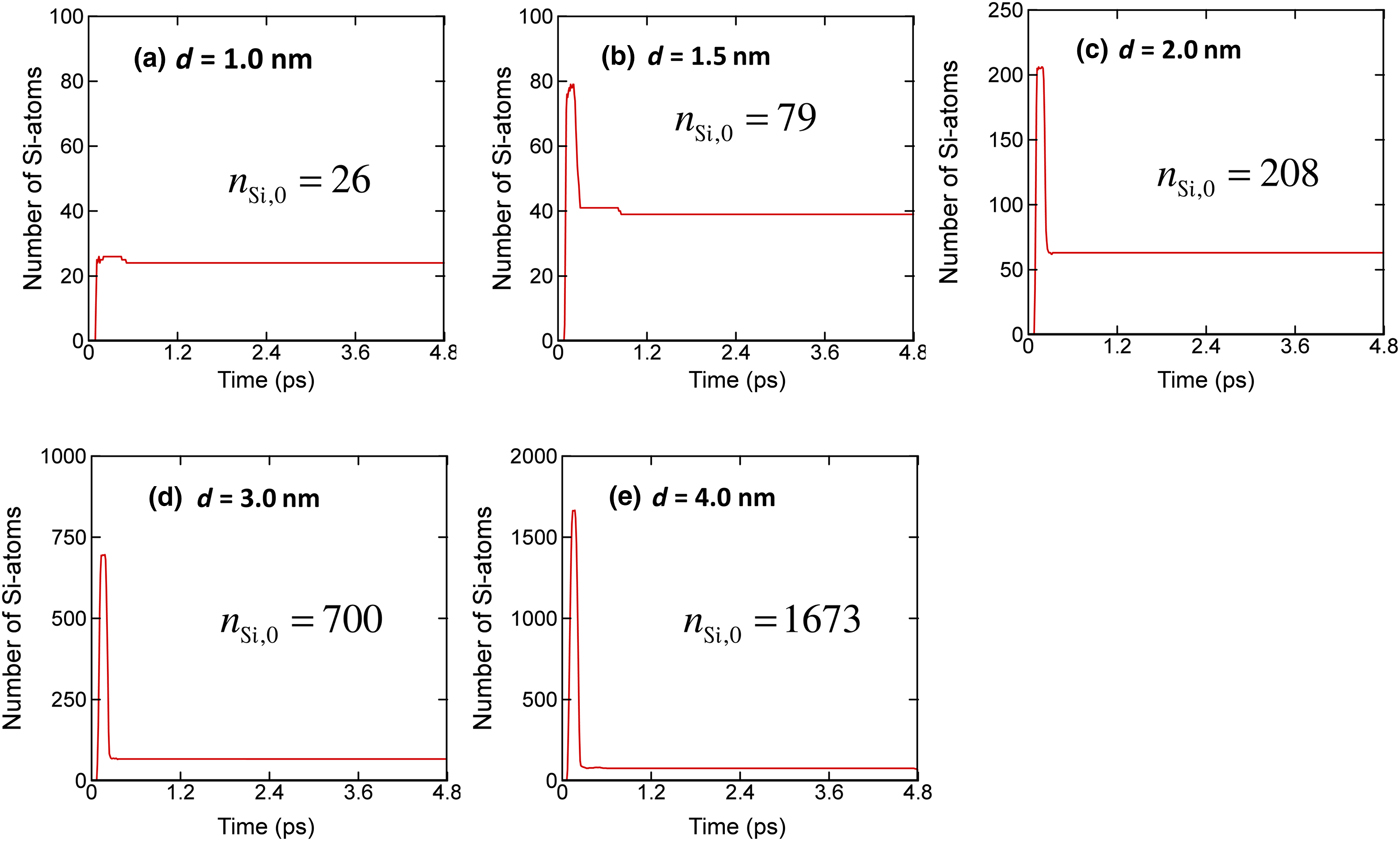
So far, we have examined the nanopore formation with focusing on the size. Another significant aspect of graphene nanopores is how many Si-atoms are left after perforation, because the Si-atoms passivated on the dangling C-atoms along the perimeter is one of the key factors in the stabilization of the hole created (thus maintaining the shape for a sufficiently long time). Figure 5 shows the change of the number of Si-atoms in graphene, n Si, for various particle sizes. In the plots, n Si,0 is the number of Si-atoms of the original nanoparticle. Because there were no Si-atoms in the graphene initially, all the profiles start from zero. The number of Si-atoms in the graphene increases enormously as the particle penetrates the graphene. Then, the number suddenly decreases as the particle escapes the graphene. For the small Si-nanoparticle with size d = 1.0 nm, the particle is disrupted completely and all the Si-atoms attach to the graphene, while several C-atoms travel in space as individual atoms. When the particle size is larger than 1.5 nm, only a fraction of the Si-atoms stays on the nanopores rim. The normalized number of Si-atoms left in the graphene (=n Si/n Si,0) decreases with increase in the size of the particle.
Change of number of Si-atoms in graphene during penetration: (a) d = 1.0 nm; (b) d = 1.5 nm; (c) d = 2.0 nm; (d) d = 3.0 nm; (e) d = 4.0 nm. The sudden increase in the number of Si-atoms presents a moment when the Si-particles are passing the graphene. Here, n Si,0 is the number of Si-atoms in the initial ball (Si-particle).

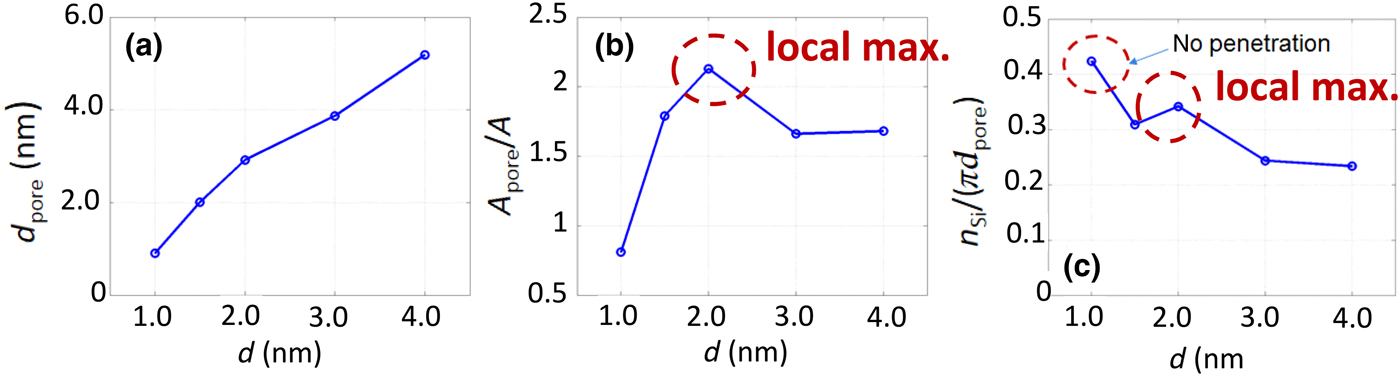
The observations in Figs. 4 and 5 are summarized in Fig. 6. Figure 6(a) reveals the relation between the particle size and the nanopore size. Although this graph appears to confirm a trivial fact (that bigger particles produce larger pores), an interesting observation is found when drawing the normalized pore area
 $A_{{\rm pore}}^{\rm *} $
[see Fig. 6(b)]: the normalized pore area has a local maximum at a certain particle size.
 $A_{{\rm pore}}^{\rm *} $
increases initially with an increase in d, reaches a maximum at d = 2.0 nm, and then decreases with further increase in d. The value of
 $A_{{\rm pore}}^{\rm *} $
saturates to 1.7 after d = 3.0 nm. Considering that the hole is substantially expanded first during penetration and then shrinks down to the equilibrium size [see Fig. 4], the
 $A_{{\rm pore}}^{\rm *} $
value greater than unity represents the residual of instantaneous enlargement during penetration. A constant trend in
 $A_{{\rm pore}}^{\rm *} $
value for d > 3.0 nm was also observed for the penetration and perforation of graphene by a macroscopic free-flying projectile.[
Reference Lee, Loya, Lou and Thomas
19
] In other words, the local maximum found in Fig. 6(b) is a unique feature of the formation of graphene nanopores. Such an anomalous local maximum is also found for the number of Si-atoms left in the graphene per perimeter [see Fig. 6(c)]. The number of Si-atoms was divided by the circumference length of the pore (n
Si/πd
pore) to exclude the effect of particle size. Different from the other cases, for the particle with d = 1.0 nm, all the Si-atoms were bound to the graphene.
Variation of the size of the pore formed in graphene, d
pore: (a) with respect to the particle size, d; (b) normalized cross-section area of the pore,
 $A_{{\rm pore}}^{\rm *} = (A_{{\rm pore}}/A)$
, versus particle size, d. A
pore is the cross-section area of pore formed and A is that of the particle projected, so
 $A_{{\rm pore}}^{\rm *} $
is equivalent to
 $A_{{\rm pore}}^{\rm *} = (d_{{\rm pore}}/d)^2$
; (c) number of Si-atoms left in the graphene per perimeter after penetration, n
Si/(πd
pore).

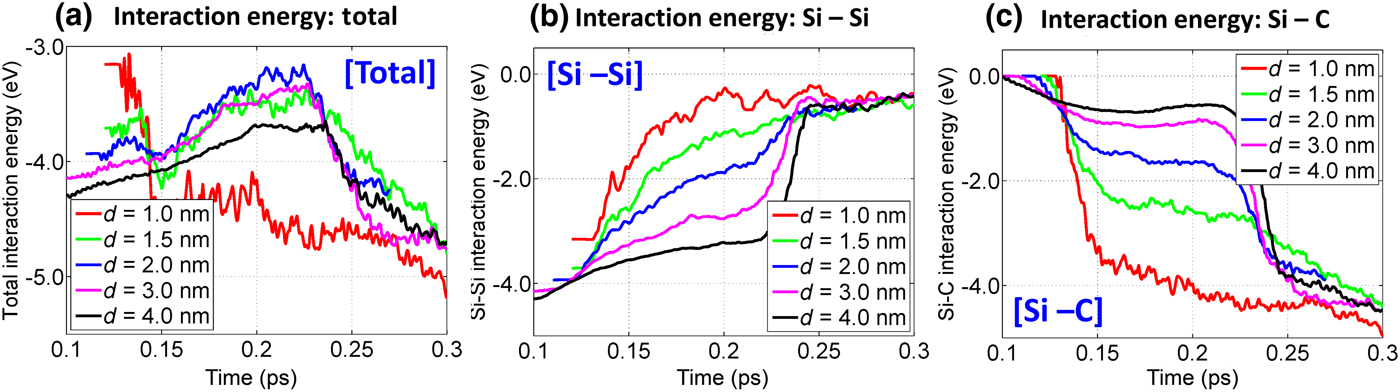
In order to further understand the anomalous trends, in Fig. 7(a) we computed the total interaction energy for a given Si-atom with other atoms
 $E_{{\rm total}}^{{\rm Si}} $
in the region inside and near the graphene during the penetration period (0.1 ps < t < 0.3 ps). Physically, the interaction energy expresses the binding affinity of a Si-atom with the other atoms—the negative sign means that the Si-atom is tied to the surrounding environment. For the smallest particle (d = 1.0 nm), the energy was further reduced to −4.5 eV from −3.1 eV when the particle hit the graphene and was completely disrupted (0.11 ps < t < 0.13 ps). As Si-atoms were spread due to disruption and fragmentation, the Si–Si distance was enlarged and the Si–Si interaction became considerably weaker. Then, they formed Si–C bonds with C-atoms in the graphene. For t– > 0.13 ps, the interaction energy was lowered more as the pore shape relaxed to the equilibrated state. More specifically, the early opening had high-energy level by local atomic jamming, and as the Si-atoms were displaced to the equilibrium positions the energy-level became lower. Except in the case with d = 1.0 nm, the interaction energy constantly increased throughout the penetration period (0.11 ps < t < 0.22 ps). During this period, the Si-nanoparticle was either fragmented (d = 1.5, 2.0 nm) or peeled (d = 3.0, 4.0 nm) to produce individual or clustered Si-atoms. These were bound to the dangling C-atoms on the rim of the pore. As seen from Fig. 7(a), it should be noted that the interaction energy is highest for d = 2.0 nm in which the local maxima were observed in
 $A_{{\rm pore}}^{\rm *} $
and n
Si/πd
pore. Such weak binding allowed the Si-atoms to move more freely, and as a result, a bigger hole was created. The interaction energy was rapidly reduced during the period of 0.22 ps < t < 0.27 ps, as the Si-passivated graphene nanopore self-relaxed to the equilibrium state and the pore shrank.
(a) Temporal variation of total interaction energy for a Si-atom,
 $E_{{\rm total}}^{{\rm Si}} $
, during penetration and its decomposed components of (b) E
Si–Si and (c) E
Si–C.
 $E_{{\rm total}}^{{\rm Si}} $
is computed as
 $E_{{\rm total}}^{{\rm Si}} = E_{{\rm Si}- {\rm Si}} + E_{{\rm Si}- {\rm C}}$
.

In Figs. 7(b) and 7(c), the total interaction energy
 $E_{{\rm total}}^{{\rm Si}} $
were decomposed into Si–Si interaction E
Si–Si and Si–C interaction E
Si–C to examine the contributions by Si and C atoms to the total interaction:
 $$E_{{\rm total}}^{{\rm Si}} = E_{{\rm Si}- {\rm Si}} + E_{{\rm Si}- {\rm C}}$$
Because a smaller particle contains fewer Si-atoms, the initial value of E
Si–Si becomes larger in proportion to d. In Figs. 7(b) and 7(c), as the penetration proceeds, E
Si–Si decreases while E
Si–C increases by the transfer of Si–Si to Si–C bonds. Different from
 $E_{{\rm total}}^{{\rm Si}} $
, which has a local maximum at d = 2.0 nm, both E
Si–Si and E
Si–C vary monotonically according to d. In other words, in the penetration process, E
Si–Si for large d is always higher than E
Si–Si for small d; whereas E
Si–C for large d is always smaller than E
Si–C for small d: E
Si–Si(d = 1.0 nm) < E
Si–Si(d = 1.5 nm) < E
Si–Si(d = 2.0 nm) < E
Si–Si(d = 3.0 nm) < E
Si–Si(d = 4.0 nm); whereas E
Si–C(d = 1.0 nm) > E
Si–C(d = 1.5 nm) > E
Si–C(d = 2.0 nm) > E
Si–C(d = 3.0 nm) > E
Si–C(d = 4.0 nm). Although E
Si–Si(d = 2.0 nm) and E
Si–C(d = 2.0 nm) are placed in the middle of each sequence, the total interaction contributed by both becomes minimized at d = 2.0 nm because of the Si–Si and Si–C interactions act in opposite directions. During the penetration process, the Si-atoms on the outer surface of a Si-particle (to be used for carbon passivation) are pulled by the other Si-atoms in the ball toward the center of the ball, and at the same time, attracted by the C-atoms to the rim of the nanopore. Therefore, the mobility of passivated Si-atoms becomes maximized when the Si–Si and Si–C interactions are comparable.
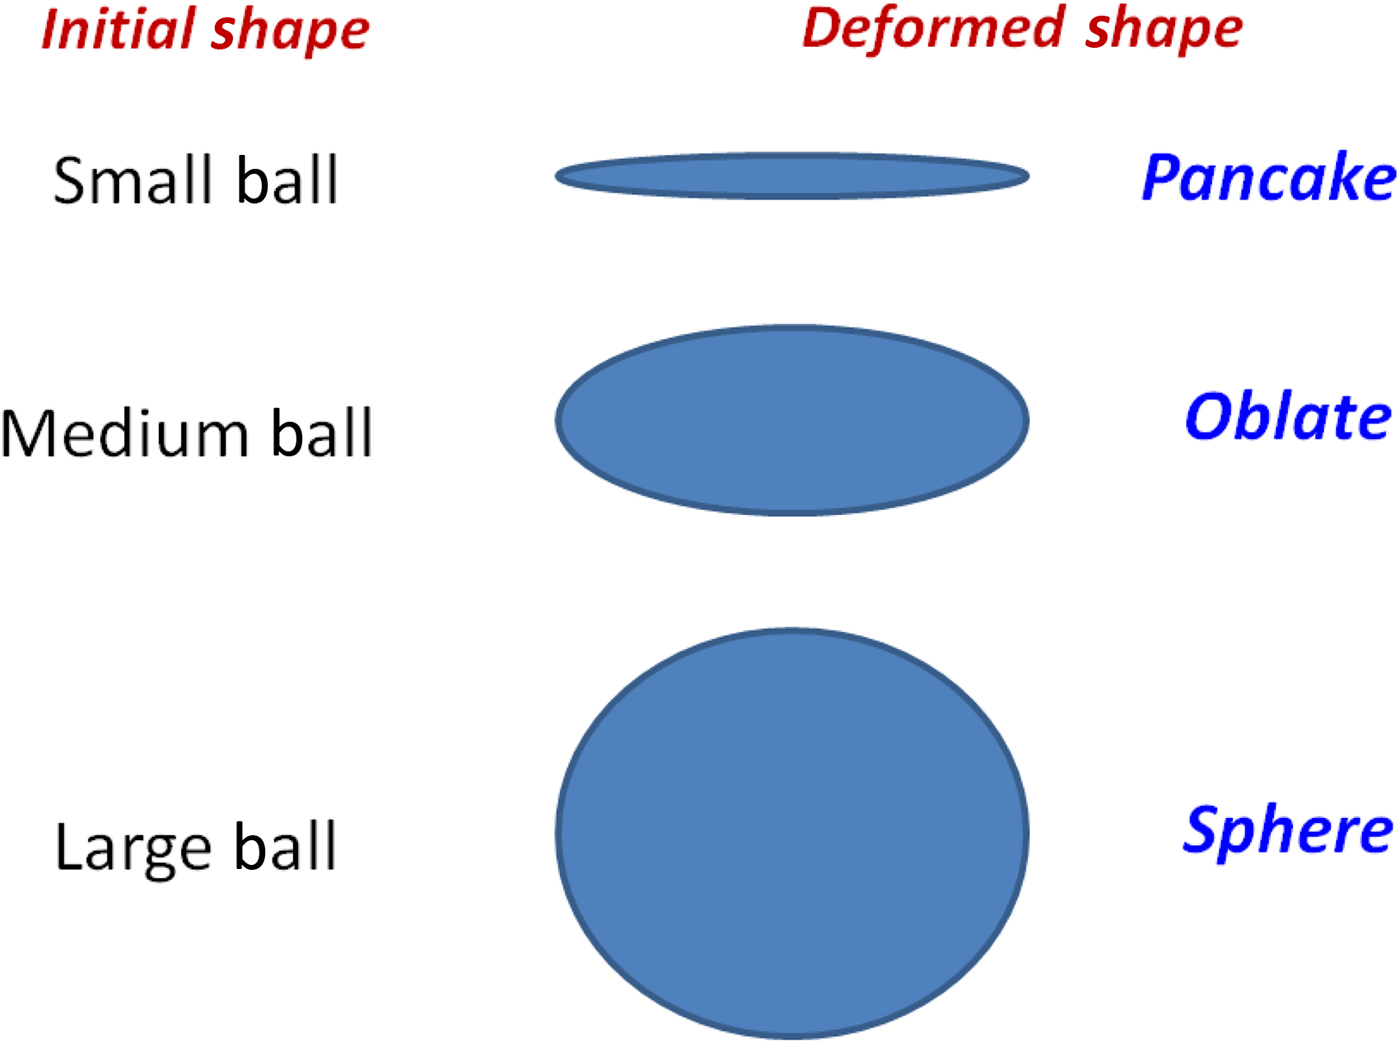
The dynamic behavior of the interaction energy in Fig. 7 can be further understood by investigating the shape change of the projectile and graphene during penetration. The graphene experiences a considerable rounded swelling (bulging and dishing) during penetration, and the degree of the deformation increases with increase in d because of the larger colliding momentum. If the colliding momentum exceeds a certain criterion, a perforation happens and petals are formed on the backside. Also, the shape of incoming particles is significantly altered depending on the size, as illustrated in Fig. 8. When the particle size is small (e.g., d = 1.0 nm) and the kinetic energy is not enough to cause perforation, the particle is deformed to a “pancake” shape and then totally disrupted. The larger particles exhibit less deformation during penetration (“oblate” for mid-size and “spherical” for large). In the pancake deformation, the Si-atoms can approach the C-atoms in graphene closely and strong Si–C bonds are formed and thus the movement of Si-atoms and the instantaneous enlargement of the pore are limited even at the onset of perforation. Also, in the penetration of a “spherical” shape, many of Si–Si bonds keep their short distance structure and the strong Si–Si interaction immobilizes Si-motion until the late phase of penetration (t < 0.22 ps). The Si–C interaction increases considerably only after the particle escapes the graphene (t ~ 0.23 ps). Different from the cases of “pancake” and “spherical” shapes, in the penetration of “oblate” shape (related to mid-sized particles), E Si–Si and E Si–C become comparable due to geometrical distortion that causes a change in Si–Si and Si–C distances. At d = 2.0 nm, the two interactions are balanced and the motion of the Si-atoms is maximized.
Graphical representation of initial and deformed shape of particles during penetration depending on the particle size.

Different from the collisions of Si-nanoparticle with the sufficiently thick solid substrate,[ Reference Suri and Dumitrică 20 ] a perfect particle-deposition mode was not found in the present study because graphene is too thin to dissipate the kinetic energy of a particle in short time. In the present study, the deposition happened along with particle disruption only for the smallest particle of d = 1.0 nm in which the Si–Si interaction is not strong enough to overcome the impact [see Fig. 2(a)]. So, the deposition mode is not expected to appear for nanoparticle-graphene collision regardless of impacting speed. However, for the present nanoparticle-graphene system, the particle-reflection mode was clearly observed when the impinging speed is low as 5.0 km/s (not presented in the current paper). Considering the above discussion and the fact that nanoparticle bombardment onto graphene is usually aimed to drill the holes, it is more natural to focus on the penetration/perforation[ Reference Backman and Goldsmith 21 ] than deposition. Thus, we can classify the particle-graphene collision into three modes of reflection, penetration (penetrate into a substrate but does not pass through), and perforation (finish the penetration completely) depending on speed. It is expected that with an increase in the speed, the observed mode would be changed from reflection, penetration, to perforation. Of course, the presence of those modes will be influenced by the size of the particle. For example, in the present study the particle speed is 10 km/s and a complete perforation happens at d = 1.5 nm, however, when the speed is changed, the perforation will occur at different particle size. Currently, we are performing a parametric study to identify the mode as a function of impacting velocity and particle size. It will be published in near future.
To summarize, in this study we explored the graphene nanopore formation induced by bombardment with Si-nanoparticles by using extensive MD simulations with reactive force fields. The collision-induced pore formation enabled the passivation of the rim of the nanopore with Si-atoms during the pore creation, which is known as an effective manner for the stabilization of graphene nanopores. The considerable interaction between the particles and graphene during penetration produced an anomalous behavior that the normalized pore size and the number of passivated Si-atoms per perimeter were maximized at certain particle size. Such local maximum is a unique feature in nanoscale, which is not observed for the penetrations and perforations of graphene by a macroscopic projectile. The interaction energy analysis was introduced to understand these phenomena quantitatively, and we found that at the certain size of the particle, the Si–Si and Si–C interactions were balanced, the Si-atoms moved freely, and the pore size was maximized by the instantaneous enlargement of the pore at the onset of perforation. Considering that the Si-nanoparticles with a velocity of a few km/s can be generated via CO2-laser-induced decomposition of SiH4 [ Reference Ehbrecht, Ferkel and Huisken 22 ] and hypersonic plasma particle deposition,[ Reference Rao, Tymiak, Blum, Neuman, Lee, Girshick, McMurry and Heberlein 23 ] and there are extensive efforts to increase the particle velocity to tens of km/s,[ Reference Piekutowski and Poormon 24 , Reference Geng, Verkhoturov, Eller, Della-Negra and Schweikert 25 ] the findings in this study are expected to be greatly useful to determine the proper size of impacting particle in drilling the graphene nanopores having Si-passivation on the rim.
Acknowledgments
This research was supported by the Basic Science Research Program through the National Research Foundation of Korea (NRF), and funded by the Ministry of Education (NRF-2014R1A1A2059123). This work was also supported by the Gyeongsang National University Fund for professors on sabbatical leave, 2016.