Publication bias refers to the phenomenon that a certain type of academic research is more likely to be published than others. Often, journal referees and editors prefer to accept manuscripts that demonstrate statistically significant findings, and authors may be more likely to submit papers that report statistically significant effects and less likely to submit those with null results (hence the file-drawer problem).Footnote 1 As a result of such behaviors—gatekeeping, authors’ self-selection, or both—null findings are less likely to appear in print. Therefore, published research does not represent the population of all available evidence. This phenomenon is widely documented in many fields such as medicine (e.g., Easterbrook et al. Reference Easterbrook, Gopalan, Berlin and Matthews1991), psychology (e.g., Ferguson and Heene Reference Ferguson and Heene2012), economics (e.g., Stanley Reference Stanley2008) and more recently, political science (e.g., Doucouliagos and Ulubaşoǧlu Reference Doucouliagos and Ulubaşoǧlu2008; Gerber and Malhotra Reference Gerber and Malhotra2008; Ahmadov Reference Ahmadov2014; Franco et al. Reference Franco, Malhotra and Simonovits2014; Findley et al. Reference Findley, Jensen, Malesky and Pepinsky2016; Philips Reference Philips2016).
Despite wide interest, few scholars consider the conditions under which publication bias is more or less severe.Footnote 2 In this paper, we propose a new mechanism which influences the severity of publication bias. In traditional regression modeling, one may classify research findings about an independent variable into two types: whether it is a key variable or statistical control. A key variable relates to a central question and hypothesis of a study. We argue that the related publication bias should be severe in the former case, but not in the latter. The reasoning is simple. When it comes to a key independent variable of interest, authors are more likely to pursue and submit statistically significant results, and reviewers and editors are more prone to accept them. In contrast, authors, reviewers, and editors are less likely to be troubled by null findings on control variables. Therefore, publication bias should be conditional on whether an independent variable is a key or statistical control in a study.
How do we evaluate the conditional nature of publication bias empirically? One popular method scholars use to identify publication bias is through meta-analysis of all prior studies on a topic. According to Stanley and Doucouliagos (Reference Stanley and Doucouliagos2012), meta-analysis “is the statistical analysis of previously published, or reported, research findings on a given hypothesis, empirical effect, phenomenon, or policy intervention” (2).Footnote 3 When scholars use meta-analysis to test for publication bias, they assess the correlation between estimated effects and their standard errors, which we discuss further below. We demonstrate that the conditional nature of publication bias can be assessed using meta-regression. Employing an interactive meta-regression model, we can derive separate estimates of publication bias between the two scenarios (whether an independent variable is a key or control).
As an illustration, we use the democracy-foreign direct investment (FDI) literature to test our argument. In that literature, scholars have conflicting findings about the effect of democracy on FDI. We collect 229 model estimates of the effect of democracy from 36 published articles, which look at the dependent variables FDI inflows and FDI inflows as a share of gross domestic product (GDP).Footnote 4 We find that publication bias is most severe when democracy is a key theoretical variable, but is weak when democracy is a control.
Our analysis demonstrates that empirical estimates for key and control variables follow different data generation processes. That is, publication bias changes depending on whether an independent variable is a key variable or a statistical control. In addition, we offer a meta regression-based empirical strategy to detect the conditional nature of publication bias, which scholars can apply to other research areas. We believe that similar patterns of publication bias also exist in other literatures that are characterized by competing theories and conflicting findings from quantitative analyses of observational data. This includes, for instance, the democratic peace literature (democracy as a key variable or not), the trade and growth literature (trade as a key variable or not), the trade and conflict literature (trade as a key variable or not), etc. Hence, our study makes a novel contribution to the study of publication bias that affects many research areas.
1. Empirical strategy for evaluating publication bias
Our empirical strategy for evaluating publication bias is motivated by the following logic. Because statistical significance depends on the size of the t-statistic (i.e., the ratio of a coefficient estimate to its standard error), to improve statistical significance for a fixed sample size, an analyst must increase the magnitude of the coefficient estimate or reduce the size of the standard error via modeling choices. Now, imagine that an analyst is unconcerned with statistical significance (i.e., a large t-statistic). They would not experiment with different model specifications and estimation techniques to boost coefficient estimates when standard errors are large. In this scenario, the coefficient estimates would be uncorrelated with standard errors. In contrast, imagine that an analyst is motivated to find statistically significant results. They would have to either find larger coefficient estimates when standard errors are large or reduce standard errors to keep the same coefficient estimates. In this scenario, the coefficients would be correlated with standard errors. Thus, one indication of the presence and severity of publication bias is the correlation between coefficients and their standard errors.Footnote 5
To test for publication bias, however, we cannot directly compare the original coefficient estimates, standard errors, and t-statistics across studies. This is because the models in the original studies have different degrees of freedom and may measure dependent and independent variables differently. To make those quantities comparable, the conventional practice in meta-analysis is to convert coefficient estimates or t-statistics from original models to some standardized measure. Following Stanley and Doucouliagos (Reference Stanley and Doucouliagos2012), we employ the partial correlation coefficient, calculated as $r_{ij}={t_{ij}}/{\sqrt {t^2_{ij}+df_{ij}}}$ . r ij refers to the partial correlation between an independent variable and the dependent variable from model j in study i, t ij is the relevant t-statistic from model j of study i, and df ij is the degrees of freedom. The standard error of the partial correlation is computed as ${\rm se}_{ij}=\sqrt {{( 1-r_{ij}) ^2 }/{df_{ij}}}$
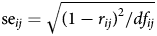 (Stanley and Doucouliagos Reference Stanley and Doucouliagos2012, 25). The level of correlation between the partial correlation, r ij, and its standard error, seij, according to our discussion in the previous paragraph, should provide evidence of the presence and severity of publication bias (e.g., Stanley Reference Stanley2008, 107).Footnote 6 The larger the correlation, the more severe the publication bias.
Based on this logic, one can demonstrate publication bias in two ways. The first method is to inspect the data using a funnel plot, with the partial correlation estimates on the horizontal axis, and the precision of the estimates on the vertical axis. The most common measure of precision is the inverse of the standard error (Stanley and Doucouliagos Reference Stanley and Doucouliagos2012). If there is no publication bias, the values of the partial correlation should be randomly and symmetrically distributed. When there is publication bias (i.e., scholars push for more significant results), we should observe an asymmetric funnel plot skewed toward larger partial correlations in absolute terms for a given level of precision (Stanley and Doucouliagos Reference Stanley and Doucouliagos2012). Conventionally, meta-analysts do not distinguish between key variable-related and control variable-related quantities in the funnel plot. According to our argument, however, publication bias should be more severe for the former than for the latter. Hence, the distribution in the funnel plot should be more asymmetrical for the former, but not for the latter.
While the funnel plot is revealing, the visual inspection method does not provide a rigorous statistical test (Stanley Reference Stanley2005). The second method to identify publication bias is via meta-regression estimation. The conventional practice is to estimate the following meta-regression (Egger et al. Reference Egger, Smith, Schneider and Minder1997; Stanley and Doucouliagos Reference Stanley and Doucouliagos2012)Footnote 7 :

The dependent variable is the partial correlation coefficient described above. On the right hand, seij is the standard error of the partial correlation, and u ij is the random error. As shown by Stanley and Doucouliagos (Reference Stanley and Doucouliagos2012), the variances of r ij and u ij are not constant among observations and thus Equation (1) should be estimated with weighted least squares, with weights equal to the inverse of each estimate's variance. In Equation (1), the constant term α0 represents the value of the dependent variable when publication bias is zero. α1 represents the relationship between the partial correlation and its standard error. If α1 is statistically insignificant, the evidence for publication bias is weak.Footnote 8 For statistically significant α1, the larger its size, the more severe the publication bias. When α1 is between 1 and 2, publication bias is substantial, and when it is larger than 2, publication bias is severe (Doucouliagos and Stanley Reference Doucouliagos and Stanley2013, 320).Footnote 9
Clearly, Equation (1) does not provide a test of our argument. According to our argument, publication bias should be more severe for key variable-related estimates than control variable-related estimates. To model the conditional nature of publication bias, we use the following interaction model in Equation (2):

In this equation, Keyj is a dummy variable equal to one if the independent variable is a key variable of interest in study j and zero if it is a control. It is worth noting that we consider a variable to be key if there is a formal hypothesis about the variable and it is part of the central research question of the paper. α1 reflects the publication bias when the independent variable is a control variable; in contrast, (α1 + α3) reflects the publication bias when the independent variable is a key variable. We expect (α1 + α3) to be strictly larger than α1 in absolute terms and α3 to be statistically different from zero (α3 ≠ 0).
However, the estimates from original studies are inherently heterogeneous due to differences in design features (e.g., data sources, measurement, estimation techniques, and sample), and ignoring such heterogeneity could lead to overestimated publication bias (Egger et al. Reference Egger, Schneider and Smith1998). To address this possibility, we also estimate Equation (3), in which X ij represents a vector of design features:

At the same time, one may be concerned that controlling for design features will include post-treatment effects (i.e., design features are selected as a means of p-hacking).Footnote 10 To address this concern while still controlling for heterogeneity, we estimate Equation (3) including the year of publication (in lieu of specific design choices), which should capture the evolution of methodologies and standard design choices in the literature over time.
2. An application: the effect of democracy on FDI
In this section, we illustrate how we use this empirical strategy to detect the conditional nature of publication bias in real-world applications. We choose the literature on the effect of democracy on FDI. Whether democratic countries attract more or less FDI is a substantively important question, with policy implications for countries that compete for foreign capital. In this literature, scholars have offered competing arguments about whether and how democratic countries attract more or less FDI.Footnote 11 On the one hand, democracy may encourage more FDI by enhancing property rights protection and policy stability, providing better growth prospects and more media openness, reducing uncertainty, and offering a more favorable labor environment. On the other hand, democracy may discourage FDI by adopting more stringent anti-trust regulation, offering more protection to domestic firms and less generous tax incentives to foreign investors, and failing to shield multinational firms from domestic popular pressures and to ensure economic freedom in developing countries. Mixed empirical findings accompany the lack of theoretical consensus in the literature both in terms of the direction of the effect of democracy on FDI and the statistical significance of the coefficient (Li et al. Reference Li, Owen and Mitchell2018).
In Li et al. (Reference Li, Owen and Mitchell2018), we test the different theoretical mechanisms in the democracy-FDI literature using meta-regression. Our premise is that as individual scholars continue to produce studies that rely on different specifications based on the same or similar underlying data, it is difficult to know how to adjudicate between different studies. Put differently, among the continually expanding set of papers that examine aggregate FDI, how much information can we learn from one more model specification? The motivation of that paper is to demonstrate how a meta-regression analysis of empirical estimates from prior studies can help us evaluate different theoretical mechanisms.Footnote 12 In that study, we find that previous arguments about property rights, exchange rate volatility, and political constraints receive robust support among studies of the level of FDI inflows, and the mechanisms of growth and domestic political risk receive relatively robust support among studies of FDI inflows as a share of GDP. Yet, even though that earlier study controls for publication bias, it does not consider its conditional nature.
Based on our argument above, we expect that in the democracy-FDI literature, publication bias should be severe for studies in which democracy is a key variable, but weak for studies in which democracy is a control. We test this conditional nature of publication bias in a sample of 229 model estimates of the effect of democracy on FDI from 36 published articles. For selection criteria, these 36 studies all examine country-level FDI as the dependent variable in a cross-national sample and include democracy as an independent variable.Footnote 13 We use these 229 model estimates to compute the partial correlation coefficients and the associated standard errors. We code democracy as a key variable in a study if a central research question in the study focuses on democracy as an independent variable and there is at least one formal hypothesis on the impact of democracy on FDI. Democracy is a key variable in 17 studies and a control in 23 others. It is striking to note the difference in the rate of statistical significance of the coefficient on democracy between models in which democracy is a key versus control variable. Among all included estimates, the coefficient on democracy is statistically different from zero in 44.98 percent of estimates. Yet, among models with democracy as a key variable, the coefficient is statistically significant 71.00 percent of the time, compared to 24.81 percent in models where democracy is a control.
We should note that in the literature, scholars use various measures of FDI. The two most prominent measures are the level of net FDI inflows and net FDI inflows as a share of GDP. In Li et al. (Reference Li, Owen and Mitchell2018), we demonstrate that the two measures are associated with different data generation processes. Thus, model estimates using these two measures are not directly comparable and should be analyzed separately.
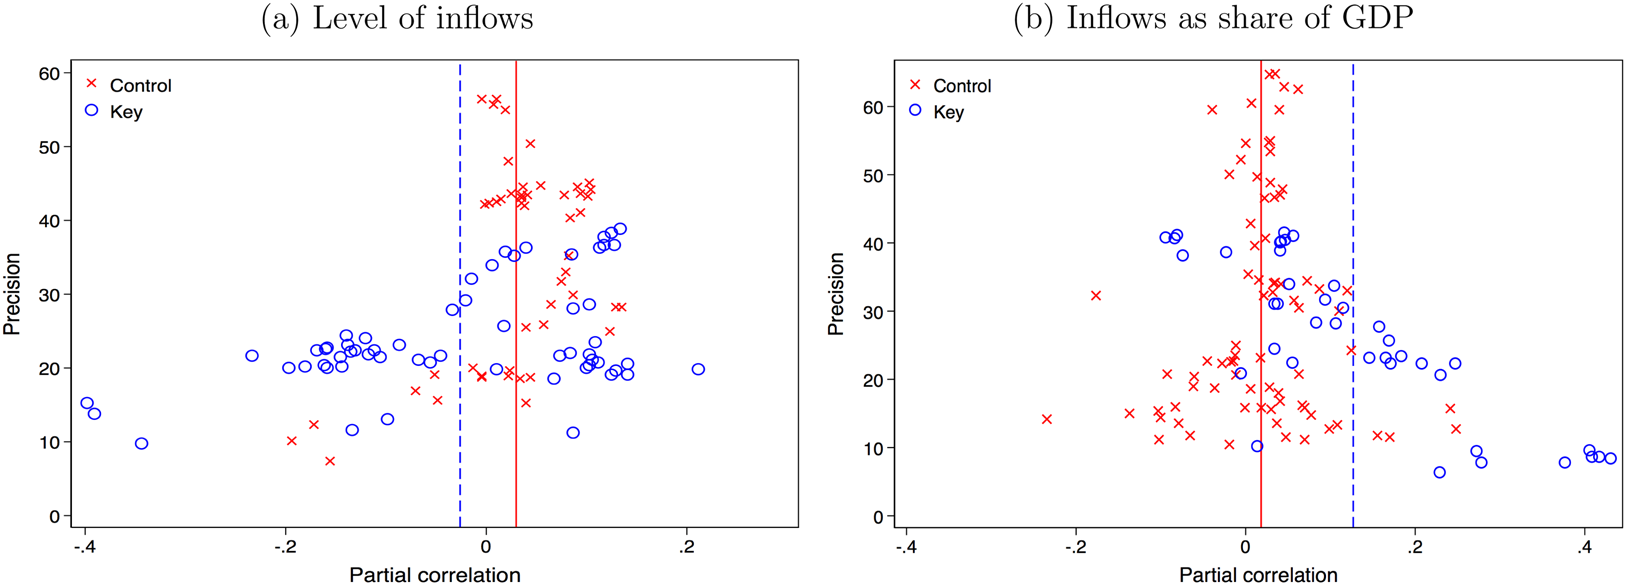
According to the empirical strategy laid out in the previous section, we first present the funnel plot with the partial correlation estimates on the horizontal axis and the precision on the vertical axis. In Figure 1, panel A is for estimates based on the level of FDI inflows, and panel B for estimates based on FDI inflows as a share of GDP. In each panel, estimates from studies where democracy is a key variable are denoted with circles, with the mean indicated by a dashed line; estimates from studies where democracy is a control are denoted with x's, with the mean indicated by a solid line.
Funnel plots for democracy-FDI partial correlations: (a) level of inflows and (b) inflows as share of GDP. Note: Dashed (solid) line represents mean partial correlation when democracy is key (control) variable.

In panel A, when democracy is a key variable, the partial correlations are more skewed toward negative values, and the mean is negative; when democracy is a control variable, the partial correlations are less skewed, and the mean is positive. In panel B, comparing when democracy is a key variable to when it is a control, the partial correlations are more skewed toward positive values, and the mean is positive and larger. In sum, in both panels A and B, the estimates are more skewed when democracy is a key variable than when it is a control. This pattern is consistent with our argument. Interestingly, if there were publication bias, the direction of the bias is negative for level studies and positive for share studies.Footnote 14
Next, we estimate Equations (1)–(3) to formally identify publication bias and test our argument. For our analysis, the dependent variable is the partial correlation coefficient for the effect of democracy on FDI. Keyj is a dummy variable equal to one if democracy is a key variable of interest in study j and zero if it is a control. The X ij represents a vector of various design features of the original FDI models; these variables are further defined in the supplementary appendix. Summary statistics are presented in the supplementary appendix.
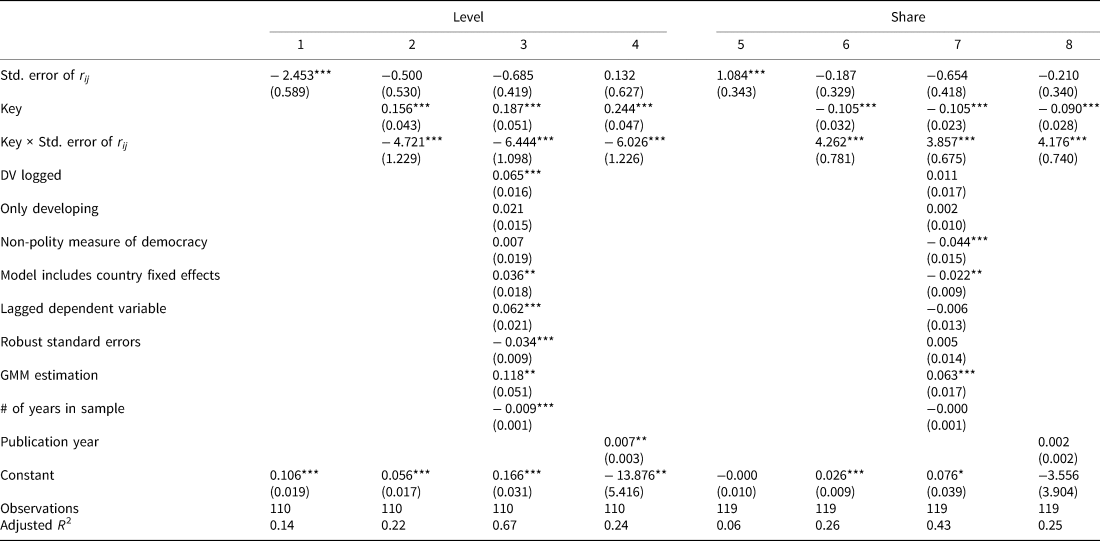
Table I presents the meta-regression results for level and share studies. Models 1 (level) and 5 (share), based on Equation (1), provide results for the unconditional publication bias test. The coefficient on the standard error of r ij is statistically significant in both models. Consistent with Figure 1, publication bias is negative in level studies and positive in share studies.
Conditional publication bias

Robust standard errors in parentheses. *p < 0.1, **p < 0.05, ***p < 0.01.
How severe is publication bias according to these two models? As discussed earlier, a coefficient on the standard error of r ij between 1 and 2 indicates substantial publication bias and a value greater than 2 indicates severe bias. In Table I, the absolute value of the coefficient is 2.453 for Model 1 and 1.084 for Model 5. Hence, publication bias is severe in level studies and substantial in share studies.
Models 2 (level) and 6 (share), based on Equation (2), provide results from the conditional publication bias test. In both models, the coefficient on the interaction term between the key variable dummy and the standard error of r ij is statistically different from zero. If we treat Models 1 and 5 as the baseline test of publication bias, then Models 2 and 6 provide a test of our argument. Therefore, a comparison of model fit between Models 1 and 2 and between Models 5 and 6 reflects how much more explanatory power our argument has over the baseline. According to adjusted R 2 reported in Table I, the model fit improves from 0.14 in Model 1 to 0.22 in Model 2, a 57 percent increase, and from 0.06 in Model 5 to 0.26 in Model 6, a 333 percent increase.
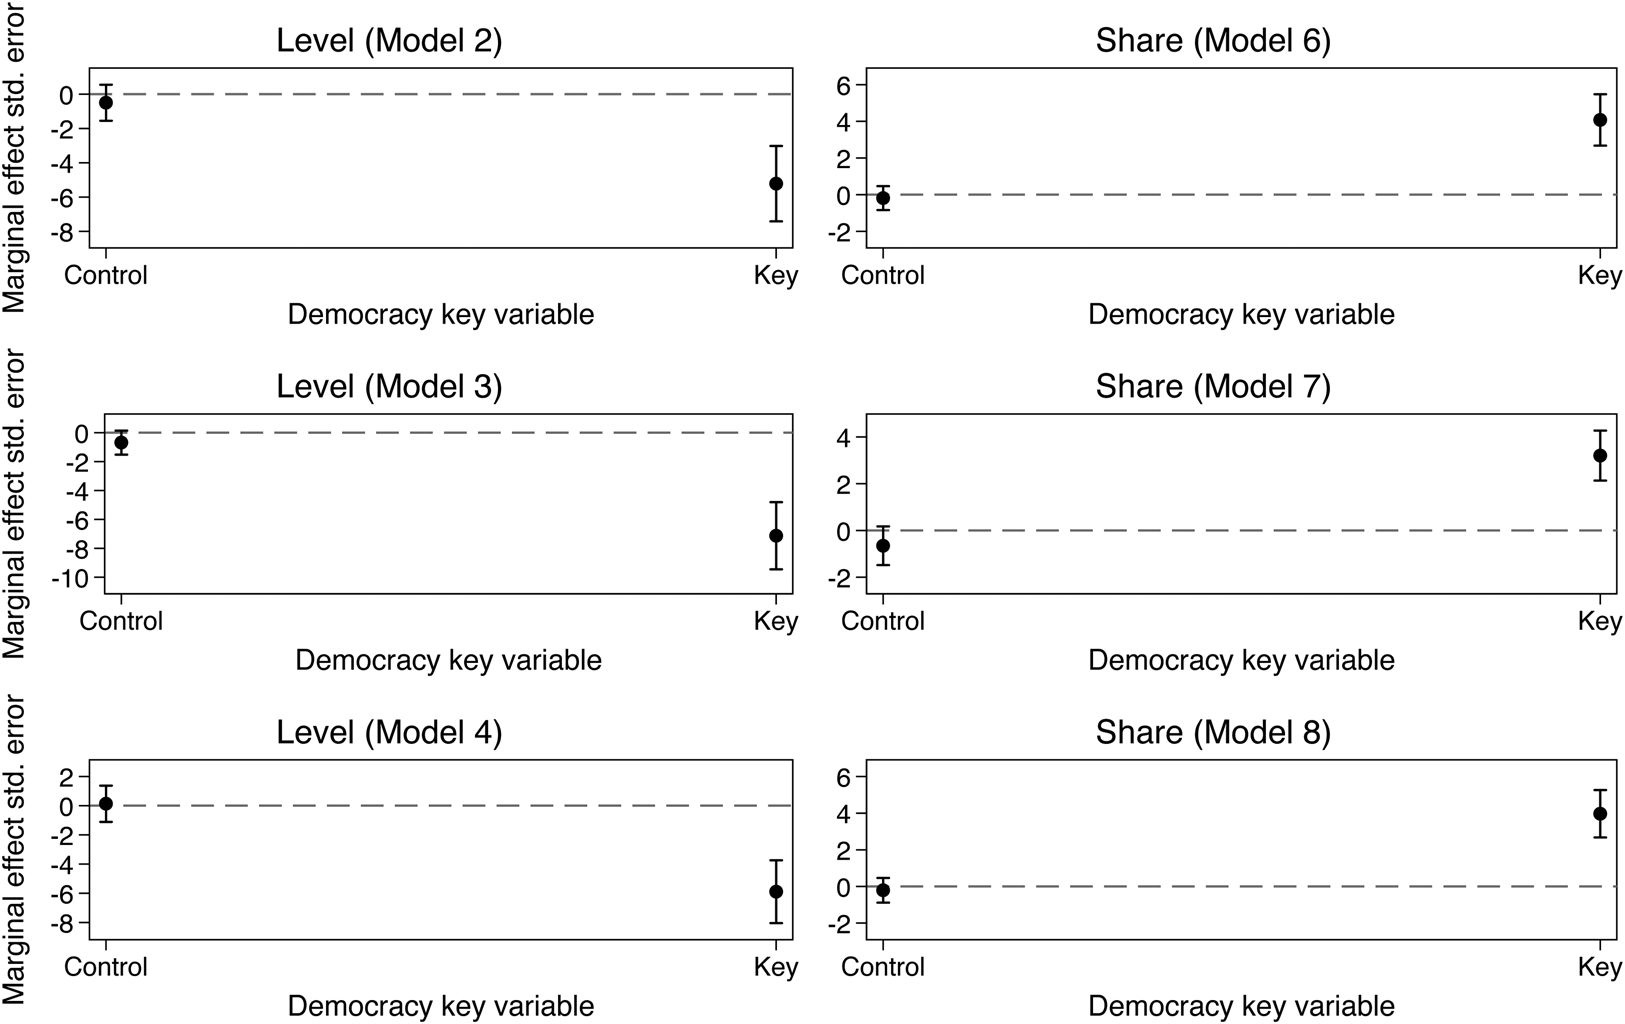
Figure 2 demonstrates how publication bias differs between the two scenarios. The top panel of Figure 2 is based on Models 2 and 6. For level studies, when democracy is a control, the marginal effect of the standard error of r ij is − 0.500 (95 percent confidence interval: [− 1.551, 0.551]). In contrast, when democracy is a key variable, the marginal effect increases to − 5.221 (95 percent confidence interval: [− 7.419, − 3.023]). For share studies, when democracy is a control, the marginal effect of the standard error of r ij is − 0.187 (95 percent confidence interval: [− 0.839, 0.466]). In contrast, when democracy is a key variable, the marginal effect increases to 4.075 (95 percent confidence interval: [2.674, 5.477]). Substantively, for both level and share studies, publication bias is extremely severe when democracy is a key variable, but appears weak when democracy is a control.
Conditional nature of publication bias.

Models 3 (level) and 7 (share), based on Equation (3), test our argument while controlling for a variety of design features. Due to space constraints, we do not interpret the results for design controls because our goal is not to explain variation in overall effect sizes. Rather our interest is in how controlling for design features might affect the estimates of publication bias. As shown in Table I and the second row of Figure 2, the conditional nature of publication bias remains robust even after controlling for various design features. The substantive effects remain largely consistent with those from the top panels of Figure 2 in terms of the size, direction, and statistical significance of the publication bias. There is some change in the magnitude of the estimated bias for key variables. Relative to Models 2 and 5 (not controlling for design features), the estimated publication bias for key variables is larger (more negative) for level studies, and is slightly smaller for share studies. As discussed above, it is important to account for heterogeneity in design so as not to overestimate publication bias.
Controlling for these design features in Models 3 and 7 could be undesirable for our analysis of publication bias if they are part of the authors’ calculation to produce significant results in the original studies. But ignoring heterogeneity across original studies could produce an over-estimation of publication bias. As one way to balance these two possibilities, we estimate Models 4 (level) and 8 (share) which include only the publication year as a control. This captures changes over time with respect to methodological choices, data availability, etc., in the literature. The results in Models 4 and 8 are similar to earlier models both with respect to statistical significance and magnitude of the publication bias. The marginal effects plots are shown in the third row of Figure 2.
One important robustness test concerns how one tests for publication bias. In early studies of publication bias, some scholars use the inverse of the square root of the sample size (e.g., Begg and Berlin Reference Begg and Berlin1988) as an alternative crude measure to test for publication bias. The rationale for this test is that there should not be any correlation between the effect size and the sample size in the absence of publication bias. We re-estimate the models from Table I using this measure. The results (in the supplementary appendix) demonstrate that our findings are robust under this alternative measure.
3. Control variables
Since we focus on the relationship between publication bias and the key/control variable distinction, the motivation for and role of control variables requires clarification. Why is a control variable like democracy added to a model in an original study? It is easy to understand why a key variable is included in a study, that is, to test some hypothesis of interest. But the decision to include that same variable as a control in a different study needs clarification. In traditional regression modeling, three commonly noted reasons for including control variables are to rule out confounding forces, improve model fit, and provide a validity check. First, a researcher must include control variable Z when estimating the effect of the main explanatory variable X on the dependent variable Y if Z is correlated with both X and Y; otherwise, the coefficient estimate of X would be biased, hence the omitted variable bias.Footnote 15 Second, researchers may also include control variables to improve the explanatory power of the model, which may lead to better forecasts and which can also influence precision of coefficient estimates.Footnote 16 Third, although researchers may not be intrinsically interested in coefficient estimates of control variables, they often use those results of control variables as a validity check of their model specification, that is, to see whether their model produces estimated effects that are consistent with established patterns in the literature or not.Footnote 17
In our case, among the 23 studies that include democracy as a control, the inclusion of democracy is almost always motivated by a reference to the literature, and in a few cases with explicit reference to omitted variable bias. In our supplementary appendix, we include quotes both regarding the motivation for including democracy as a control from each study in our sample and how the estimation results are interpreted. Out of these 23 studies, 19 explicitly discuss the statistical significance (and direction) of the coefficient of democracy; all others save one discuss control variables in general terms.Footnote 18 Thus, there appears to be a large degree of homogeneity in how authors motivate and interpret controls in the democracy-FDI literature, at least on the surface.
4. Conclusion
Previous research demonstrates that publication bias is pervasive because journals and scholars tend to reward and be rewarded for statistically significant findings. However, the determinants of the severity of publication bias are less well understood. We argue that results for key theoretical variables are more likely driven by severe publication bias than those for control variables. We propose an empirical strategy for separating publication bias between the two scenarios using an interactive meta-regression set-up. We believe that the empirical strategy is applicable to a variety of research areas. As an illustration, we apply the proposed empirical test to the democracy-FDI literature. We find that publication bias is extremely severe among studies with democracy as a key variable, but appears weak when democracy is a control. Our research suggests that re-analysis of previous meta-regressions of publication bias that do not distinguish between key and control variables could yield different conclusions and is thus necessary.
As the problem of publication bias has attracted growing attention, one might wonder how we should resolve it. To mitigate the problem, a number of different approaches have been suggested, including results-free review (Findley et al. Reference Findley, Jensen, Malesky and Pepinsky2016), correcting for publication bias by comparing predicted publication probabilities to actual distributions (Andrews and Kasy Reference Andrews and Kasy2019),Footnote 19 transparency in covariate specifications (Lenz and Sahn Reference Lenz and Sahn2017), and ensuring research design quality more generally (Blair et al. Reference Blair, Cooper, Coppock and Humphreys2019).Footnote 20 Our analysis highlights the need to consider the nature of data generation process of publication bias because of its contingent nature. Authors, editors, reviewers, and readers should understand when the bias is large or small. Therefore, the previously proposed solutions to publication bias should particularly be applied to the case of the key variable in a study.
Supplementary material
To view supplementary material for this article, please visit https://doi.org/10.1017/psrm.2020.15.