1 Introduction
Linear processes play an essential role in the subcritical transition to turbulence (Henningson & Reddy Reference Henningson and Reddy1994; Waleffe Reference Waleffe1995) and to the sustenance of turbulence (Kim & Lim Reference Kim and Lim2000) in wall-bounded shear flows. Linear analyses involve decomposing the velocity fields into a base flow and perturbations about the base flow; for transition to turbulence, the base flow is the steady laminar solution, while for fully turbulent flows, the appropriate choice for the base flow is the turbulent mean velocity (Reynolds & Tiederman Reference Reynolds and Tiederman1967). The turbulent mean velocity is linearly stable, and the coupling term in the linearized Navier–Stokes equations (LNSE) is responsible for the sustenance of turbulence structures, as shown by Kim & Lim (Reference Kim and Lim2000). In more recent work, McKeon & Sharma (Reference McKeon and Sharma2010) exposed the nature of the linear processes to be that of selective amplification of certain modes (which tend to be travelling waves localized around a critical layer in their analysis), allowing for a substantial reduction in the dimensionality (number of degrees of freedom) of high-Reynolds-number turbulence (Moarref et al. Reference Moarref, Sharma, Tropp and McKeon2013).
A turbulent eddy viscosity is often introduced into the LNSE to fix the turbulent mean velocity profile as an exact solution of the equations, and to model the dissipative effect of the small scales of turbulence on the large-scale perturbations (Reynolds & Hussain Reference Reynolds and Hussain1972). The eddy-viscosity-enhanced linearized Navier–Stokes equations (eLNSE) have been successful in describing several features of wall-bounded turbulence. For instance, Del Álamo & Jimenez (Reference Del Álamo and Jimenez2006) and Pujals et al. (Reference Pujals, García-Villalba, Cossu and Depardon2009) showed that dominant turbulence structures are captured by the eLNSE as the perturbations with the largest transient growth; Hwang & Cossu (Reference Hwang and Cossu2010b ) extended these to study the response to harmonic and stochastic forcing, and showed the existence of inner and outer peaks in spanwise size of maximally amplified structures, as well as a self-similar range between the two peaks. Illingworth, Monty & Marusic (Reference Illingworth, Monty and Marusic2018) and Towne, Yang & Lozano-Durán (Reference Towne, Yang and Lozano-Durán2018) have demonstrated that the addition of an eddy viscosity to the linear operator significantly improves the performance of a linear estimator. Hwang (Reference Hwang2016) suggested that the eddy viscosity enhancement could also help reconcile the inner–outer interaction (Mathis, Hutchins & Marusic Reference Mathis, Hutchins and Marusic2009) in the near-wall region. A review of LNSE and eLNSE models for wall-bounded turbulence has recently been presented by McKeon (Reference McKeon2017).
The impulse response completely characterizes a linear dynamical system in the time domain. In the context of the linearized dynamics of turbulence, this involves studying the response to nonlinearities that are localized in both space and time. Using the impulse response to study coherent structures has the advantage of parametrizing their evolution without the need to impose a priori either their wall-parallel dimensions (i.e. fundamental Fourier modes in the streamwise and spanwise directions) or a phase relationship between the Fourier modes to give overall structure. Several researchers have applied the impulse response or similar tools to turbulent flows. Although not using the impulse response directly, Landahl (Reference Landahl1990) argued that the near-wall dynamics of turbulence can be considered as the linear response to spatio-temporally localized nonlinear terms because of the high intermittency of wall-normal velocity fluctuations.
The seminal work of Huerre & Monkewitz (Reference Huerre and Monkewitz1985) used the impulse response to determine the convective or absolute nature of a flow based on whether the disturbance decayed or grew for large times at all points in the flow. Jovanović & Bamieh (Reference Jovanović and Bamieh2001) used the impulse response to study the evolution of perturbations about a laminar base flow. Luchini, Quadrio & Zuccher (Reference Luchini, Quadrio and Zuccher2006) did this for turbulent flows by introducing white noise at the wall in a direct numerical simulation (DNS) and computing space–time correlations at
 $Re_{\unicode[STIX]{x1D70F}}=180$
. Codrignani (Reference Codrignani2014) extended the DNS-based study to different wall-normal locations for the impulse at a slightly lower Reynolds number of
 $Re_{\unicode[STIX]{x1D70F}}=150$
. More recently, Eitel-Amor et al. (Reference Eitel-Amor, Örlü, Schlatter and Flores2015) investigated the evolution of hairpin vortices at a higher Reynolds number of
 $Re_{\unicode[STIX]{x1D70F}}=590$
, using the eLNSE as well as DNS to include a fully turbulent background. They found that the evolution of a single hairpin vortex observed in the turbulent DNS was well represented by the eddy-viscosity-enhanced LNSE; however, the linear model failed to capture regeneration, consistent with the earlier observations of Kim & Lim (Reference Kim and Lim2000). Farano et al. (Reference Farano, Cherubini, Robinet and De Palma2017) also noted the transient nature of hairpin vortices and explained their regeneration in the framework of a nonlinear, self-sustaining cycle.
In this paper, the low computational cost of the eLNSE model is exploited to extend these investigations of the impulse response to turbulent flows at higher Reynolds numbers; we use
 $Re_{\unicode[STIX]{x1D70F}}=10\,000$
to allow for a decade of wall-normal extent of the log layer, although computations at higher
 $Re_{\unicode[STIX]{x1D70F}}$
are also feasible. The aims of the work are to investigate (i) if the impulse response captures the vortex–streak structure known to be important to turbulence (Jiménez & Moin Reference Jiménez and Moin1991; Hwang Reference Hwang2015), (ii) the prevalence of the hairpin vortex (Adrian Reference Adrian2007), and (iii) the geometrical scaling of the coherent structures and associated turbulent stresses as they evolve in time. The numerical formulation for computing the impulse response is presented in § 2, and the results for nine different cases of impulses are shown in § 3. In § 4, we summarize the principal observations of this paper and discuss the limitations of the present model.
2 Numerical formulation
The flow under consideration is incompressible channel flow. A Cartesian coordinate system is employed, where
 $x$
,
 $y$
and
 $z$
represent the streamwise, spanwise and wall-normal directions, respectively. Following Reynolds & Hussain (Reference Reynolds and Hussain1972), a triple decomposition is performed on the velocity field,
 $\boldsymbol{u}_{total}=[U(z),0,0]+\boldsymbol{u}+\boldsymbol{u}^{\prime }$
, where
 $U(z)$
is the turbulent mean velocity,
 $\boldsymbol{u}$
is a large-scale perturbation, and
 $\boldsymbol{u}^{\prime }$
represents the small-scale turbulent fluctuations. Both
 $\boldsymbol{u}^{\prime }$
and the perturbation vector
 $\boldsymbol{u}$
have components
 $[u,v,w]^{\text{T}}$
, where
 $u$
is the streamwise velocity,
 $v$
is the spanwise velocity and
 $w$
is the wall-normal velocity. We are interested in the evolution of these perturbations about a specified turbulent mean. The turbulent mean,
 $U(z)$
, is computed by integrating an integrand containing the turbulent eddy viscosity,
 $(-u_{\unicode[STIX]{x1D70F}}Re_{\unicode[STIX]{x1D70F}}\unicode[STIX]{x1D702})/(\unicode[STIX]{x1D708}_{T}/\unicode[STIX]{x1D708})$
, from
 $\unicode[STIX]{x1D702}=-1$
to
 $z$
. Here,
 $z$
is the wall-normal coordinate non-dimensionalized by the channel half-height such that the channel walls are at
 $z=\pm 1$
,
 $\unicode[STIX]{x1D702}$
is a proxy for the non-dimensionalized wall-normal coordinate,
 $Re_{\unicode[STIX]{x1D70F}}$
is the Reynolds number based on the friction velocity
 $u_{\unicode[STIX]{x1D70F}}$
, and
 $\unicode[STIX]{x1D708}_{T}$
is the total eddy viscosity. The total eddy viscosity
 $\unicode[STIX]{x1D708}_{T}=\unicode[STIX]{x1D708}_{t}+\unicode[STIX]{x1D708}$
contains the turbulent eddy viscosity
 $\unicode[STIX]{x1D708}_{t}$
and the molecular viscosity
 $\unicode[STIX]{x1D708}$
, and is approximated using the semi-analytical expression of Cess (Reference Cess1958) as reported by Reynolds & Tiederman (Reference Reynolds and Tiederman1967):
 $$\begin{eqnarray}\unicode[STIX]{x1D708}_{T}=\frac{\unicode[STIX]{x1D708}}{2}\left[1+\frac{\unicode[STIX]{x1D705}^{2}Re_{\unicode[STIX]{x1D70F}}^{2}}{9}(1-z^{2})^{2}(1+2z^{2})^{2}\left\{1-\exp \left(\frac{Re_{\unicode[STIX]{x1D70F}}(|z|-1)}{A}\right)\right\}^{2}\right]^{1/2}+\frac{\unicode[STIX]{x1D708}}{2},\end{eqnarray}$$
where the von Kármán constant
 $\unicode[STIX]{x1D705}=0.426$
and the constant
 $A=25.4$
. We note that these values were optimized for the turbulent mean velocity profile at
 $Re_{\unicode[STIX]{x1D70F}}=2003$
in Hoyas & Jiménez (Reference Hoyas and Jiménez2006) but have also been used for friction Reynolds numbers as high as
 $Re_{\unicode[STIX]{x1D70F}}=10^{10}$
in Moarref et al. (Reference Moarref, Sharma, Tropp and McKeon2013).
We investigate the evolution of perturbations due to a spatio-temporally impulsive body force, which is considered to represent an idealized bursting event. This spatio-temporal impulse,
 $\tilde{\unicode[STIX]{x1D6FF}}(\boldsymbol{x}-\boldsymbol{x}_{0},t)$
, is factorized into impulses along each direction and time as
 $$\begin{eqnarray}\tilde{\unicode[STIX]{x1D6FF}}(\boldsymbol{x}-\boldsymbol{x}_{0},t)=\unicode[STIX]{x1D6FF}(x)\unicode[STIX]{x1D6FF}(y)\unicode[STIX]{x1D6FF}(z-z_{0})\unicode[STIX]{x1D6FF}(t),\end{eqnarray}$$
where
 $\unicode[STIX]{x1D6FF}$
is the Dirac delta function. The impulse is introduced at
 $x=y=t=0$
, with a variable wall-normal location
 $z_{0}$
. The Fourier transform of the impulse along
 $x$
and
 $y$
produces a coefficient of unity for each Fourier mode.
A momentum impulse along the direction
 $(m_{x}\hat{\boldsymbol{e}}_{x}+m_{y}\hat{\boldsymbol{e}}_{y}+m_{z}\hat{\boldsymbol{e}}_{z})$
, with
 $\hat{\boldsymbol{e}}_{s}$
being the unit vector along direction
 $s\in \{x,y,z\}$
, enters the evolution equations for any Fourier mode
 $\text{e}^{\text{i}(k_{x}x+k_{y}y)}$
as follows:
 $$\begin{eqnarray}\left.\begin{array}{@{}c@{}}\unicode[STIX]{x2202}_{t}\hat{\unicode[STIX]{x1D753}}=\unicode[STIX]{x1D63C}\hat{\unicode[STIX]{x1D753}}+\unicode[STIX]{x1D63D}\,\hat{\boldsymbol{f}}\unicode[STIX]{x1D6FF}(t),\\ \hat{\boldsymbol{u}}=\unicode[STIX]{x1D63E}\hat{\unicode[STIX]{x1D753}},\end{array}\right\}\end{eqnarray}$$
where the state
 $\hat{\unicode[STIX]{x1D753}}=[{\hat{w}},\hat{\unicode[STIX]{x1D702}}]^{\text{T}}$
contains the Fourier coefficients of wall-normal velocity and wall-normal vorticity, and
 $\hat{\boldsymbol{f}}(z)=[m_{x}\unicode[STIX]{x1D6FF}(z-z_{0}),m_{y}\unicode[STIX]{x1D6FF}(z-z_{0}),m_{z}\unicode[STIX]{x1D6FF}(z-z_{0})]^{\text{T}}$
is the wavenumber-independent Fourier coefficient for the impulsive body force (which models an idealized bursting event in the present work). The operators
 $\unicode[STIX]{x1D63C}$
,
 $\unicode[STIX]{x1D63D}$
and
 $\unicode[STIX]{x1D63E}$
are dependent on the wavenumbers of the Fourier mode, and are presented below:
 $$\begin{eqnarray}\left.\begin{array}{@{}c@{}}\unicode[STIX]{x1D63C}=\left[\begin{array}{@{}cc@{}}\unicode[STIX]{x1D6E5}^{-1}{\mathcal{L}}_{OS} & 0\\ -\text{i}k_{y}U^{\prime } & {\mathcal{L}}_{SQ}\end{array}\right],\quad \unicode[STIX]{x1D63E}={\displaystyle \frac{1}{k_{x}^{2}+k_{y}^{2}}}\left[\begin{array}{@{}cc@{}}\text{i}k_{x}{\mathcal{D}} & -\text{i}k_{y}\\ \text{i}k_{y}{\mathcal{D}} & \text{i}k_{x}\\ k_{x}^{2}+k_{y}^{2} & 0\end{array}\right],\\ \unicode[STIX]{x1D63D}=\left[\begin{array}{@{}ccc@{}}-\text{i}k_{x}\unicode[STIX]{x1D6E5}^{-1}{\mathcal{D}} & -\text{i}k_{y}\unicode[STIX]{x1D6E5}^{-1}{\mathcal{D}} & -(k_{x}^{2}+k_{y}^{2})\unicode[STIX]{x1D6E5}^{-1}\\ \text{i}k_{y} & -\text{i}k_{x} & 0\end{array}\right].\end{array}\right\}\end{eqnarray}$$
Here the prime and
 ${\mathcal{D}}$
represent wall-normal differentiation,
 $\unicode[STIX]{x1D6E5}={\mathcal{D}}^{2}-(k_{x}^{2}+k_{y}^{2})$
, and the operators
 ${\mathcal{L}}_{OS}$
and
 ${\mathcal{L}}_{SQ}$
are
 $$\begin{eqnarray}\left.\begin{array}{@{}c@{}}{\mathcal{L}}_{OS}=\text{i}k_{x}U^{\prime \prime }-\text{i}k_{x}U\unicode[STIX]{x1D6E5}+\unicode[STIX]{x1D708}_{T}\unicode[STIX]{x1D6E5}^{2}+2\unicode[STIX]{x1D708}_{T}^{\prime }\unicode[STIX]{x1D6E5}{\mathcal{D}}+\unicode[STIX]{x1D708}_{T}^{\prime \prime }({\mathcal{D}}^{2}+(k_{x}^{2}+k_{y}^{2})),\\ {\mathcal{L}}_{SQ}=-\text{i}k_{x}U+\unicode[STIX]{x1D708}_{T}\unicode[STIX]{x1D6E5}+\unicode[STIX]{x1D708}_{T}^{\prime }{\mathcal{D}}.\end{array}\right\}\end{eqnarray}$$
See chap. 10 of Jovanović (Reference Jovanović2004) for a similar investigation of perturbations about the laminar flow; the operators
 $\unicode[STIX]{x1D63D}$
and
 $\unicode[STIX]{x1D63E}$
remain the same as in that study, while the operator
 $\unicode[STIX]{x1D63C}$
is identical to the one used in Hwang & Cossu (Reference Hwang and Cossu2010b
) to reflect the linearization about the turbulent mean velocity and the introduction of the turbulent eddy viscosity.
The velocity perturbations for any Fourier mode at time
 $t$
due to an impulse introduced at time
 $t=0$
is calculated explicitly for any time
 $t>0$
, without resorting to time marching, as
 $$\begin{eqnarray}\hat{\boldsymbol{u}}=C\text{e}^{At}B\,\hat{\boldsymbol{f}},\end{eqnarray}$$
which is obtained by integrating (2.3). The impulse response is computed for a spatially periodic flow with domain sizes
 $8\unicode[STIX]{x03C0}$
and
 $3\unicode[STIX]{x03C0}$
along the streamwise and spanwise directions. The Fourier modes used to construct the field of perturbations are integral multiples of the fundamental wavenumbers
 $k_{x,0}=(2\unicode[STIX]{x03C0})/(8\unicode[STIX]{x03C0})$
for streamwise and
 $k_{y,0}=(2\unicode[STIX]{x03C0})/(3\unicode[STIX]{x03C0})$
for spanwise directions. The modes are truncated so that higher wavenumbers that are excluded have less than 0.001 % of the energy in the most energetic Fourier mode; the number of Fourier modes needed to meet this truncation criterion goes from
 $(160,192)$
modes along streamwise and spanwise directions (counting positive and negative wavenumbers) at early times to
 $(40,40)$
modes at later times.
Along the wall-normal direction, the Chebyshev collocation method is used. To facilitate consistent discretization, the wall-normal Dirac delta function is approximated by an exponential function in the wall-normal direction,
 $$\begin{eqnarray}\unicode[STIX]{x1D6FF}(z-z_{0})\approx f_{s0}(z;z_{0}):=\frac{K}{2\sqrt{\unicode[STIX]{x03C0}\unicode[STIX]{x1D716}}}\exp \left(-\frac{(Re_{\unicode[STIX]{x1D70F}}(z-z_{0}))^{2}}{4\unicode[STIX]{x1D716}}\right),\end{eqnarray}$$
where
 $z_{0}$
is the location of the impulse, and
 $\unicode[STIX]{x1D716}$
quantifies the width of the impulse. We use
 $\unicode[STIX]{x1D716}=z_{0}^{+}/4$
to have consistent discretization of the exponential function in (2.7) near the wall and in the core of the channel; here,
 $z^{+}=Re_{\unicode[STIX]{x1D70F}}(1+z)$
is the wall-normal coordinate expressed in inner units and referenced from the bottom wall, so that the bottom wall is at
 $z=-1$
and
 $z^{+}=0$
. The constant
 $K$
in (2.7) is set so that the function has an area of unity. The number of Chebyshev nodes used in the wall-normal direction is 768; increasing this number to 1152 produces a relative change in energy of less than 0.01 % for all Fourier modes and times considered here.
The operators
 $\unicode[STIX]{x1D63C}$
,
 $\unicode[STIX]{x1D63D}$
and
 $\unicode[STIX]{x1D63E}$
have been validated using the results of Pujals et al. (Reference Pujals, García-Villalba, Cossu and Depardon2009) and Hwang & Cossu (Reference Hwang and Cossu2010b
). The impulse response was separately validated about a laminar base flow using the results in chap. 10 of the PhD thesis of Jovanović (Reference Jovanović2004).
3 Results
The responses to impulses introduced at three different locations,
 $z^{+}\approx 30$
,
 $z^{+}\approx 500$
and
 $z=-0.5$
(or
 $z^{+}=5000$
) at
 $Re_{\unicode[STIX]{x1D70F}}=10\,000$
are computed at times
 $tu_{\unicode[STIX]{x1D70F}}/h$
from 0.05 to 1.5 in steps of 0.05, or
 $tU_{CL}/h$
from 1.42 to 41.2 in steps of 1.42. At each location, the body force is introduced along each of the three coordinate axes, producing a total of nine cases. For convenience, these cases will be identified with a name such as
 $I30x$
, where the ‘
 $I30$
’ part refers to the forcing location being 30 inner units, and ‘
 $x$
’ refers to the forcing direction. The names for the first six cases will start with ‘
 $I30$
’ or ‘
 $I500$
’, followed by the direction of the forcing, while the last three cases will start with ‘
 $O05$
’ followed by the direction.
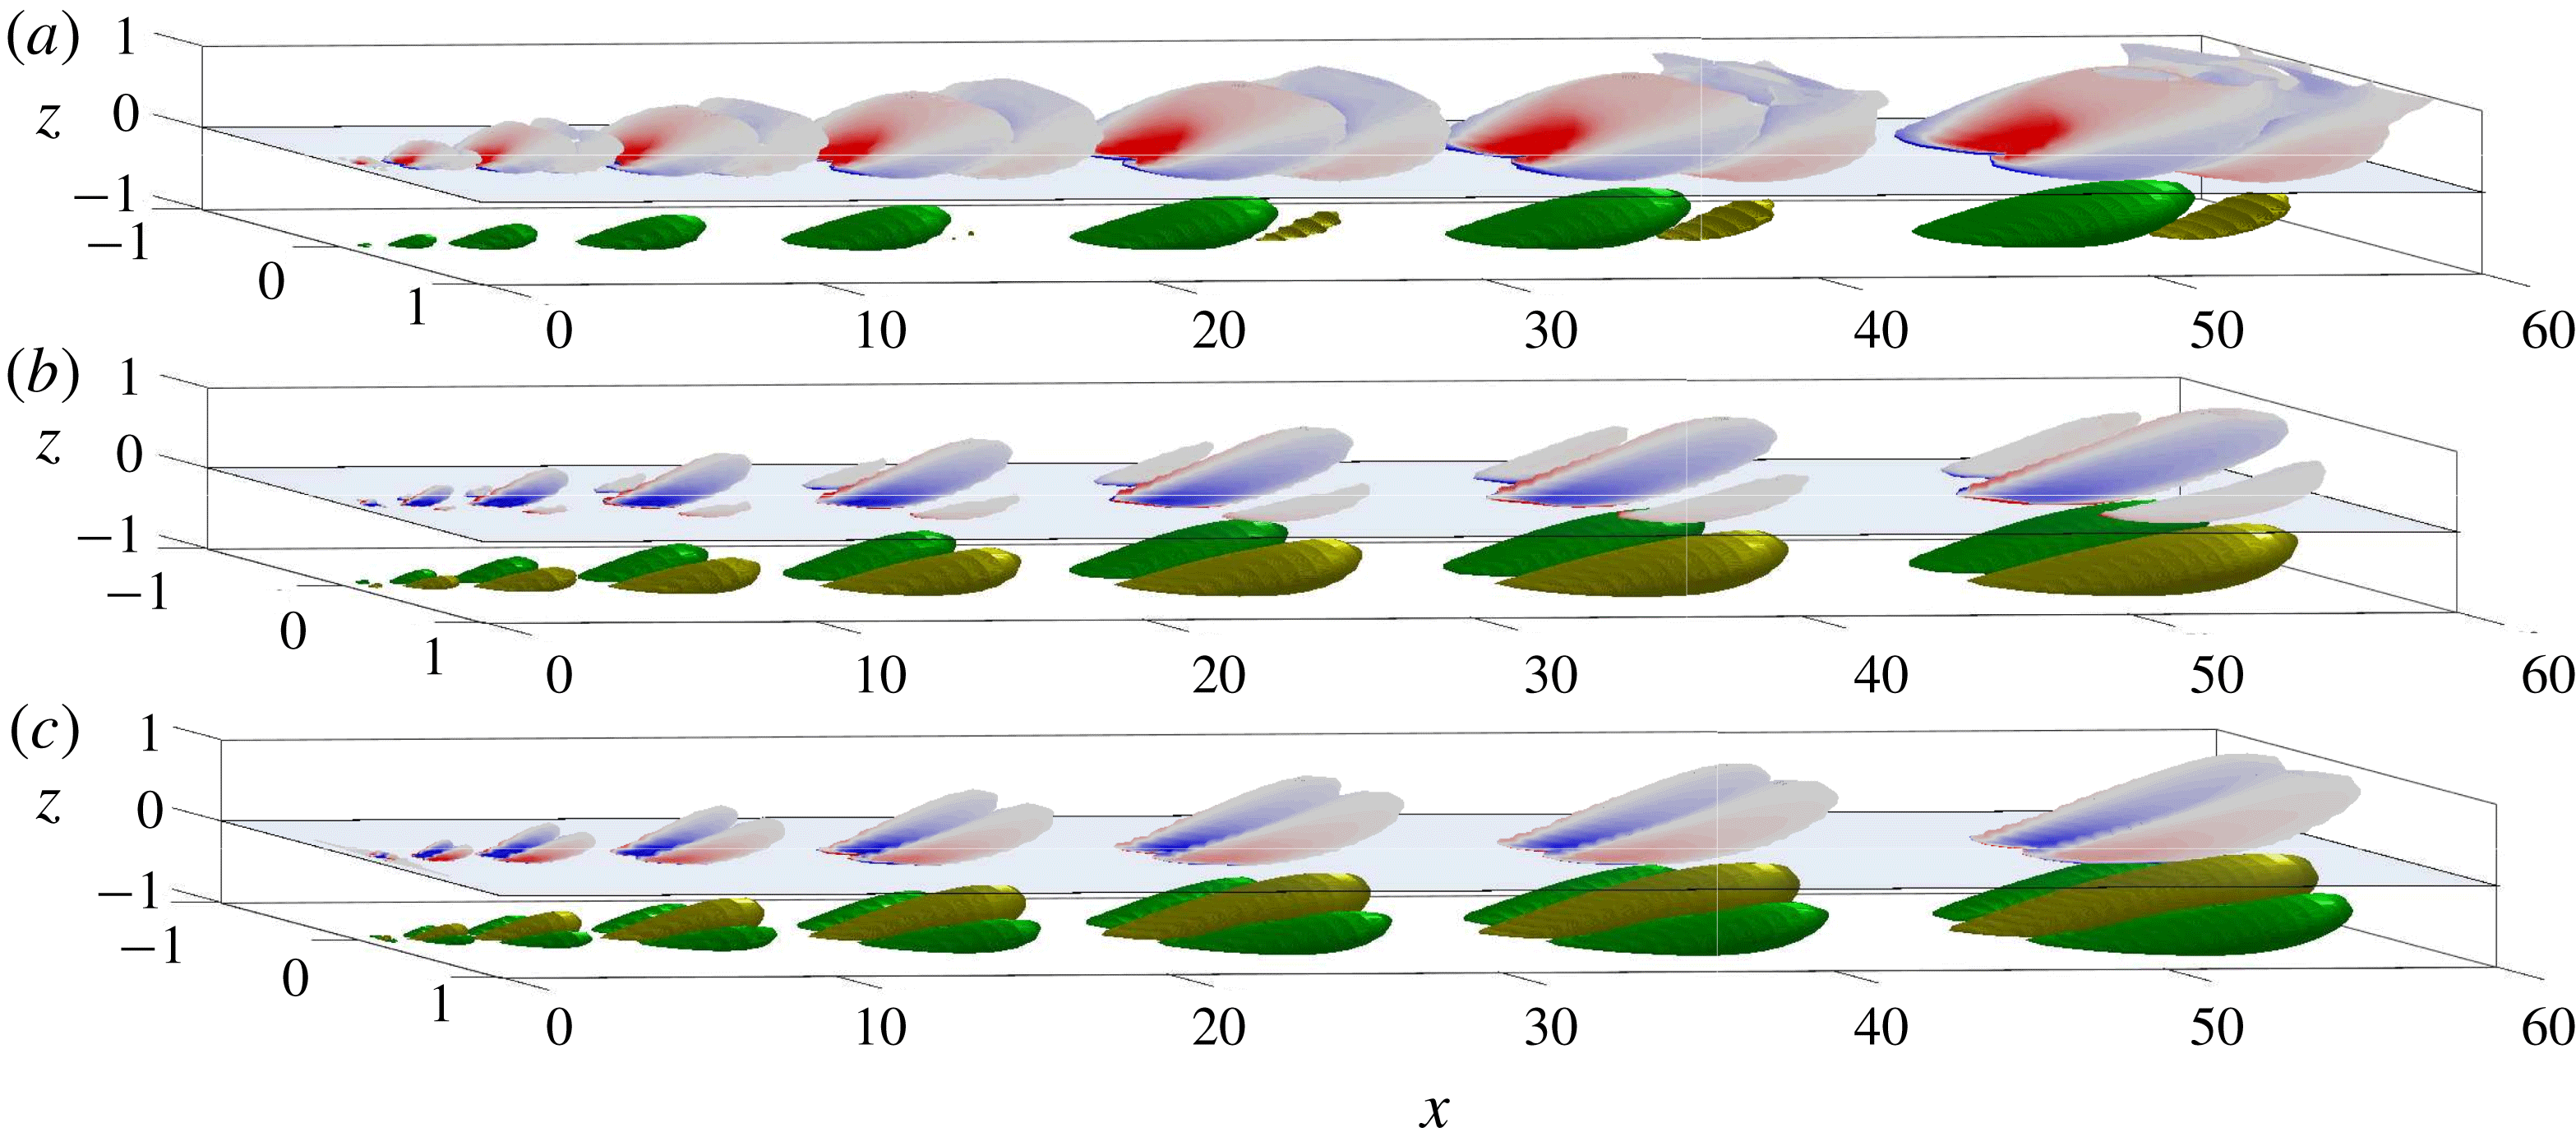
Coherent structures at times (from left to right)
 $tU_{CL}/h$
from 1.42 to 41.2 in steps of 5.7 due to the impulses (from a to c)
 $I30x$
,
 $I30y$
and
 $I30z$
. Green–yellow isosurfaces are for streamwise perturbation velocity at
 $+25\,\%$
of instantaneous maximum (green) and
 $-25\,\%$
of instantaneous maximum (yellow), with their streamwise locations modified to facilitate visualization. Red–white–blue isosurfaces are for swirling strength at 10 % of the instantaneous maximum (coloured by spanwise vorticity), and are plotted with a wall-normal offset of 1 to avoid overlap with the streamwise velocity isosurfaces.

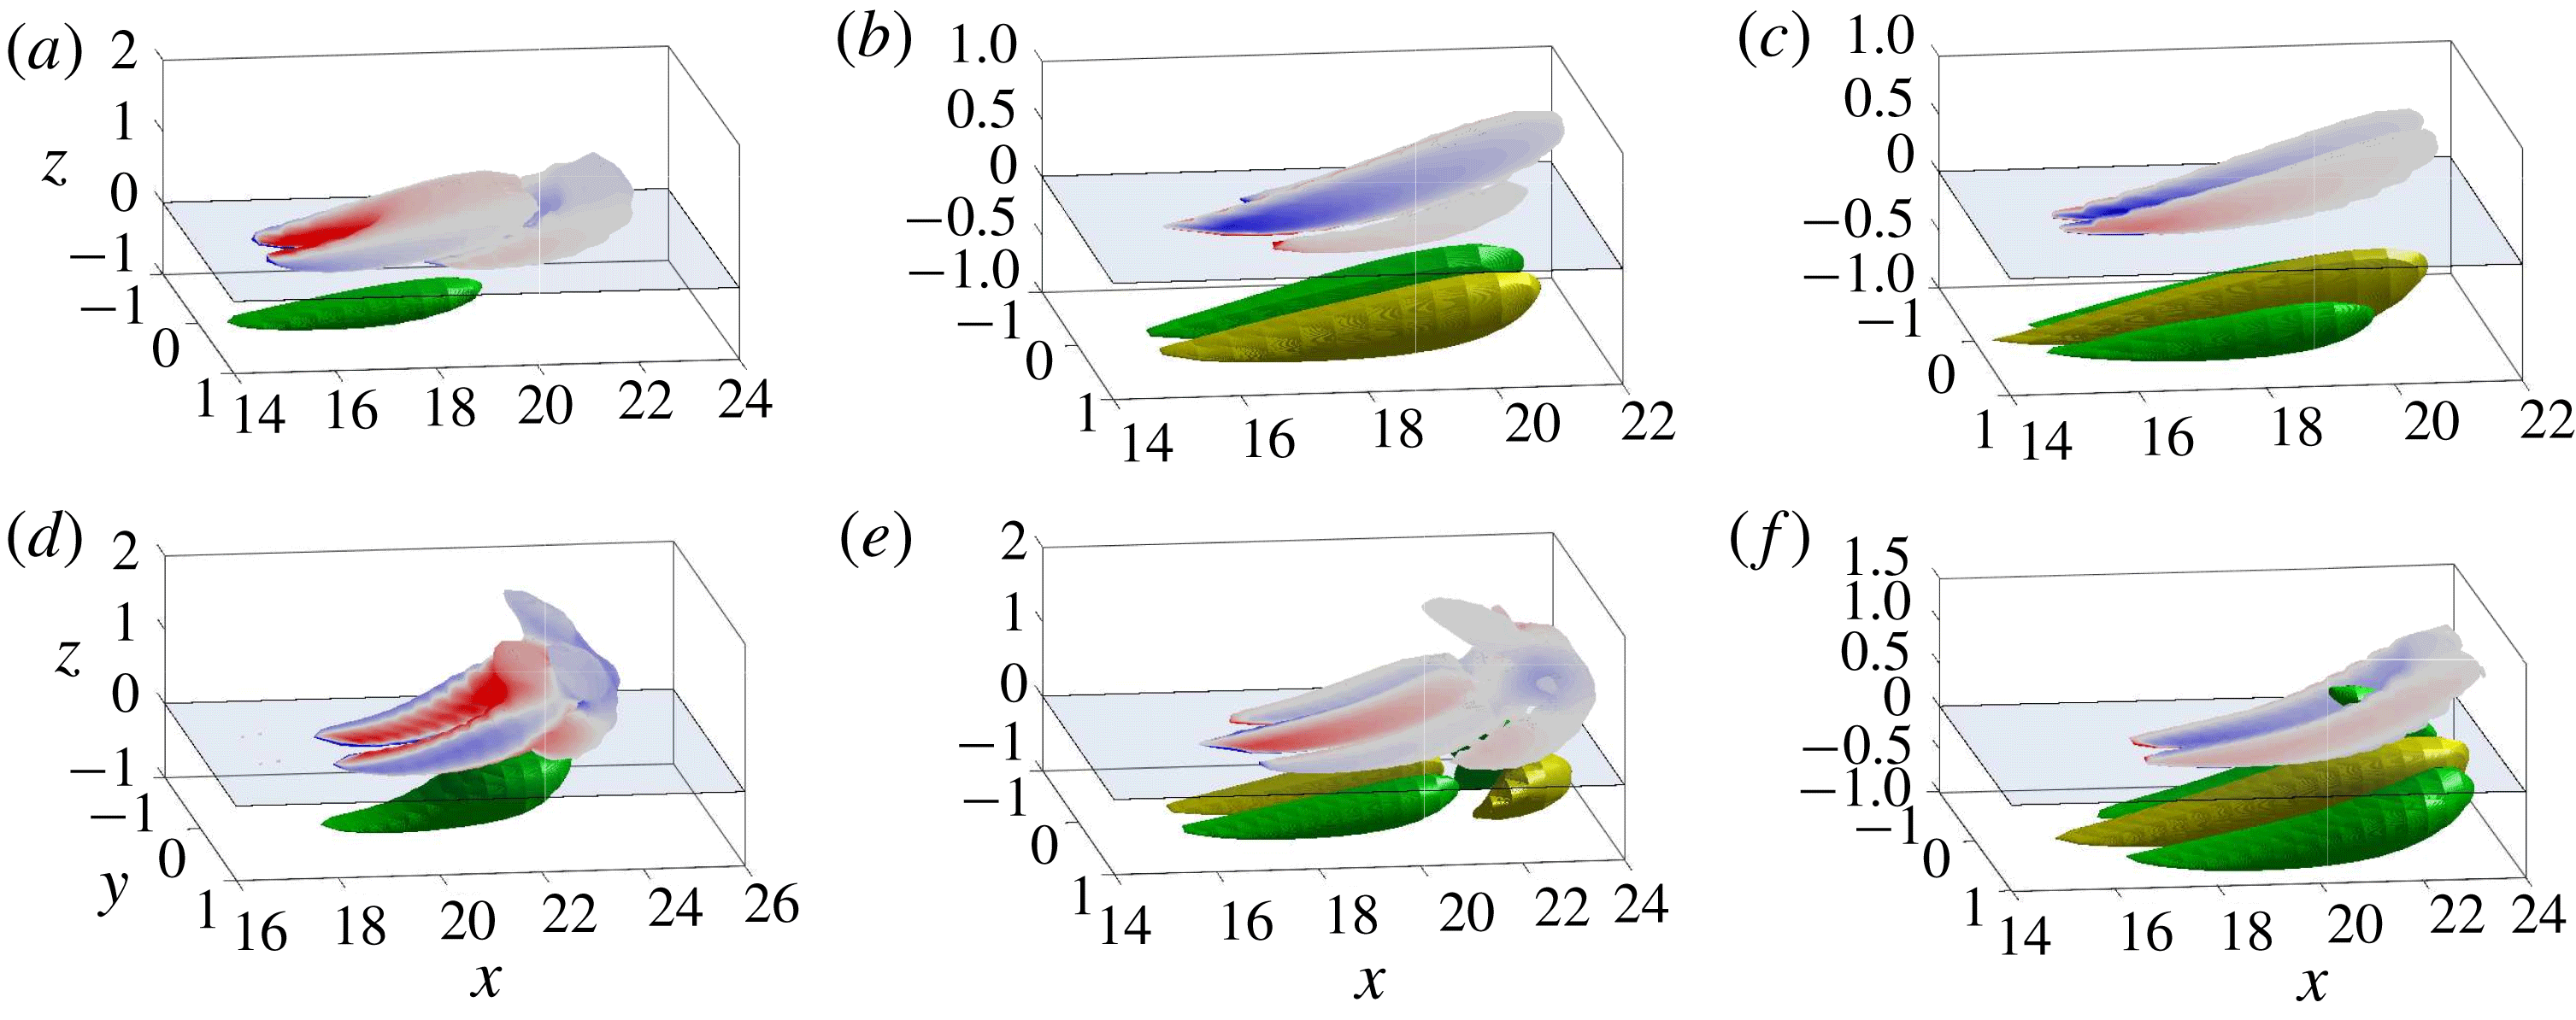
Coherent structures due to the impulses at
 $z^{+}=500$
(a–c) and
 $z=-0.5$
(d–f) along directions
 $x$
(a,d),
 $y$
(b,e) and
 $z$
(c,f) at time
 $tU_{CL}/h=24.1$
. Isosurfaces are as in figure 1, and swirling strength has a wall-normal offset of 1 as before to avoid overlap with velocity isosurfaces.

3.1 Structure topology
The topology of the coherent structures produced by the impulse response at different times is illustrated in figure 1, where isosurfaces of swirling strength and streamwise velocity are plotted for
 $I30x$
,
 $I30y$
and
 $I30z$
cases for eight different times:
 $tU_{CL}/h$
from 1.42 to 41.2 in steps of 5.7. The coordinate axes are scaled unequally to facilitate visualization. The same isosurfaces are shown in figure 2 for the
 $I500$
and
 $O05$
cases, but at only one time instant,
 $tU_{CL}/h=24.1$
. The swirling strength is defined at each point in the domain as the imaginary part of the complex eigenvalue of the velocity gradient tensor (Zhou et al.
Reference Zhou, Adrian, Balachandar and Kendall1999).
The coherent structure produced by the impulse contains streamwise velocity streaks which are flanked or enclosed by quasi-streamwise vortices. These results are reminiscent of earlier studies where the most amplified structures are streamwise streaks which are forced by quasi-streamwise vortices (e.g. Del Álamo & Jimenez Reference Del Álamo and Jimenez2006; Pujals et al.
Reference Pujals, García-Villalba, Cossu and Depardon2009; Hwang & Cossu Reference Hwang and Cossu2010a
). The topologies of the streaks and vortices change when the direction of the body force is changed. For example, the contours of the swirl when the impulse is in the
 $x$
- and
 $z$
-directions have a hairpin-like structure while the
 $y$
case does not since it is not symmetric with respect to the
 $x{-}z$
plane. Changing the location of the forcing from
 $z^{+}\approx 30$
to
 $z^{+}\approx 500$
, however, does not result in a significant difference. Forcing at
 $z=-0.5$
, on the other hand, produces a more observable change in the structure of the perturbations, especially when they extend into the top half of the channel. However, features such as the number of streaks and vortices, and their relative arrangement, are unaffected. All of the structures also appear to be attached to the wall; this becomes more clear when Reynolds stresses are plotted in § 3.4.
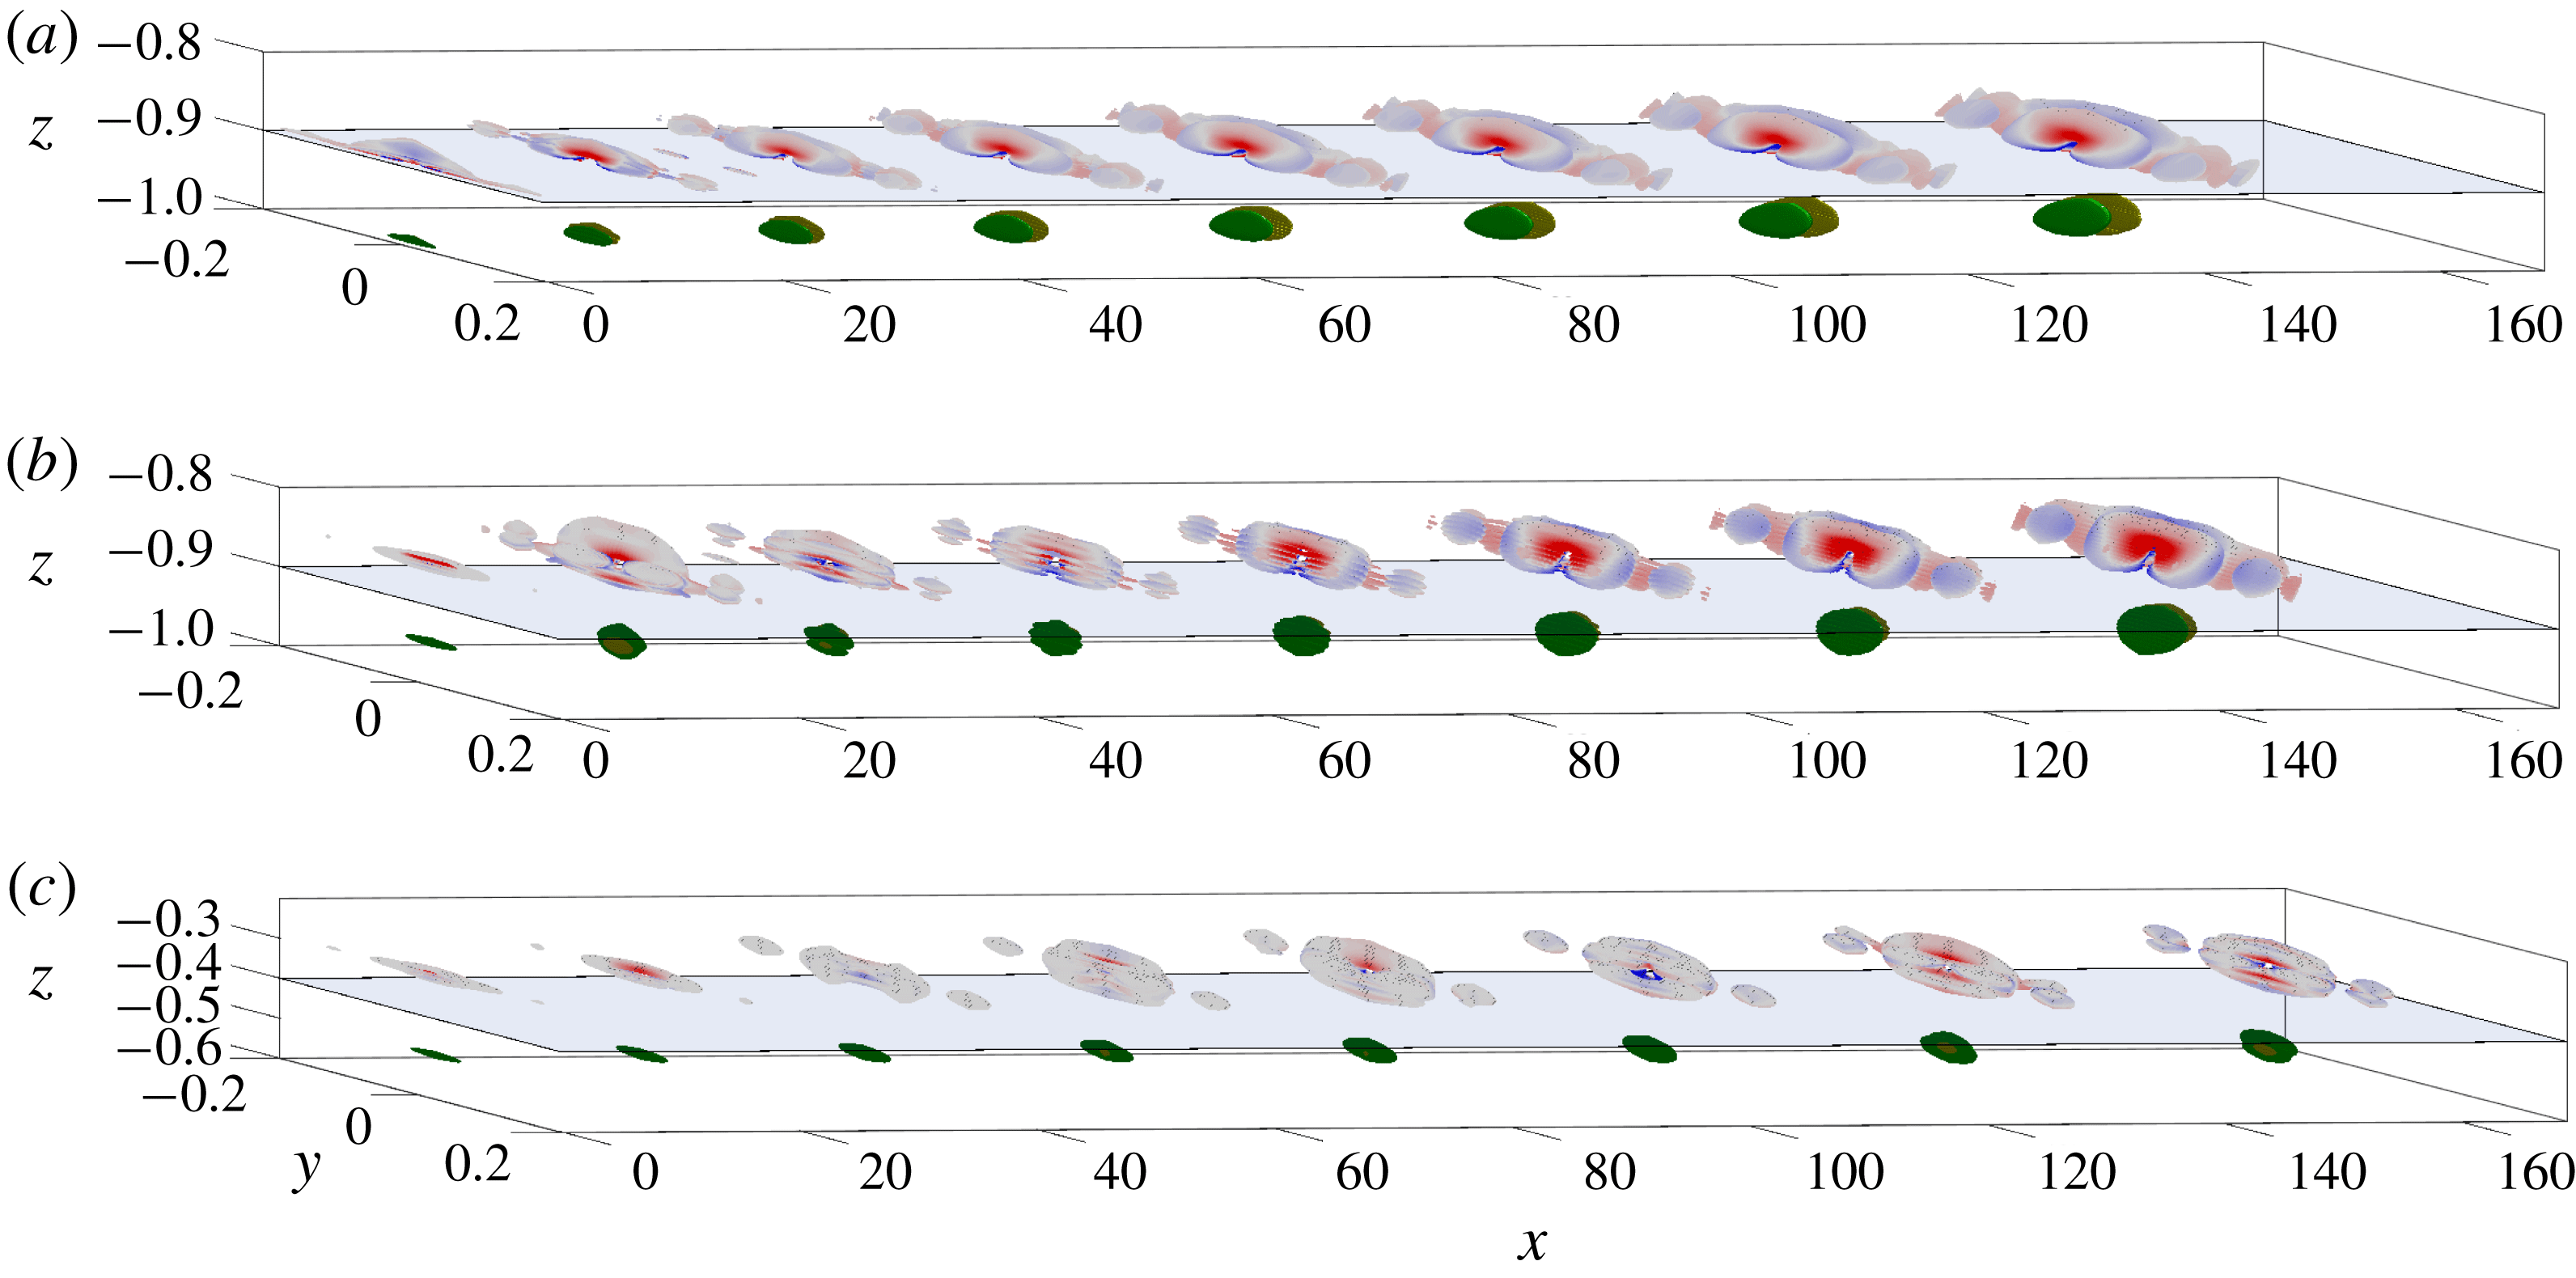
Coherent structures at times (from left to right)
 $tU_{CL}/h$
from 1.42 to 41.2 in steps of 5.7 due to the impulses (from a to c)
 $I30x$
mol,
 $I500x$
mol and
 $O05x$
mol. Isosurfaces are as in figure 1, and swirling strength has a variable wall-normal offset to avoid overlap with velocity isosurfaces.

In other studies, the linear dynamics of the Navier–Stokes equations generally result in structures which are detached from the wall if eddy viscosity is not included (e.g. McKeon & Sharma Reference McKeon and Sharma2010). This occurs since structures are localized around the wall-normal height where their phase speed
 $c^{+}$
matches the local mean velocity
 $U^{+}$
. The impulse response in the
 $x$
-direction only is computed for the molecular viscosity case, i.e.
 $\unicode[STIX]{x1D708}_{T}=\unicode[STIX]{x1D708}$
, for all three wall-normal heights (these are denoted
 $I30x$
mol,
 $I500x$
mol and
 $O05x$
mol). As seen in figure 3, the wall-normal extents of the structures are significantly smaller than those of their eddy viscosity counterparts and only the
 $z^{+}=30$
structures are attached to the wall. It should be noted that the
 $z$
axis has been rescaled in order to facilitate visualization.
3.2 Physical scaling
The self-similarity of the structures can first be studied by considering their aspect ratios. The streamwise size of the structures for the
 $I30x$
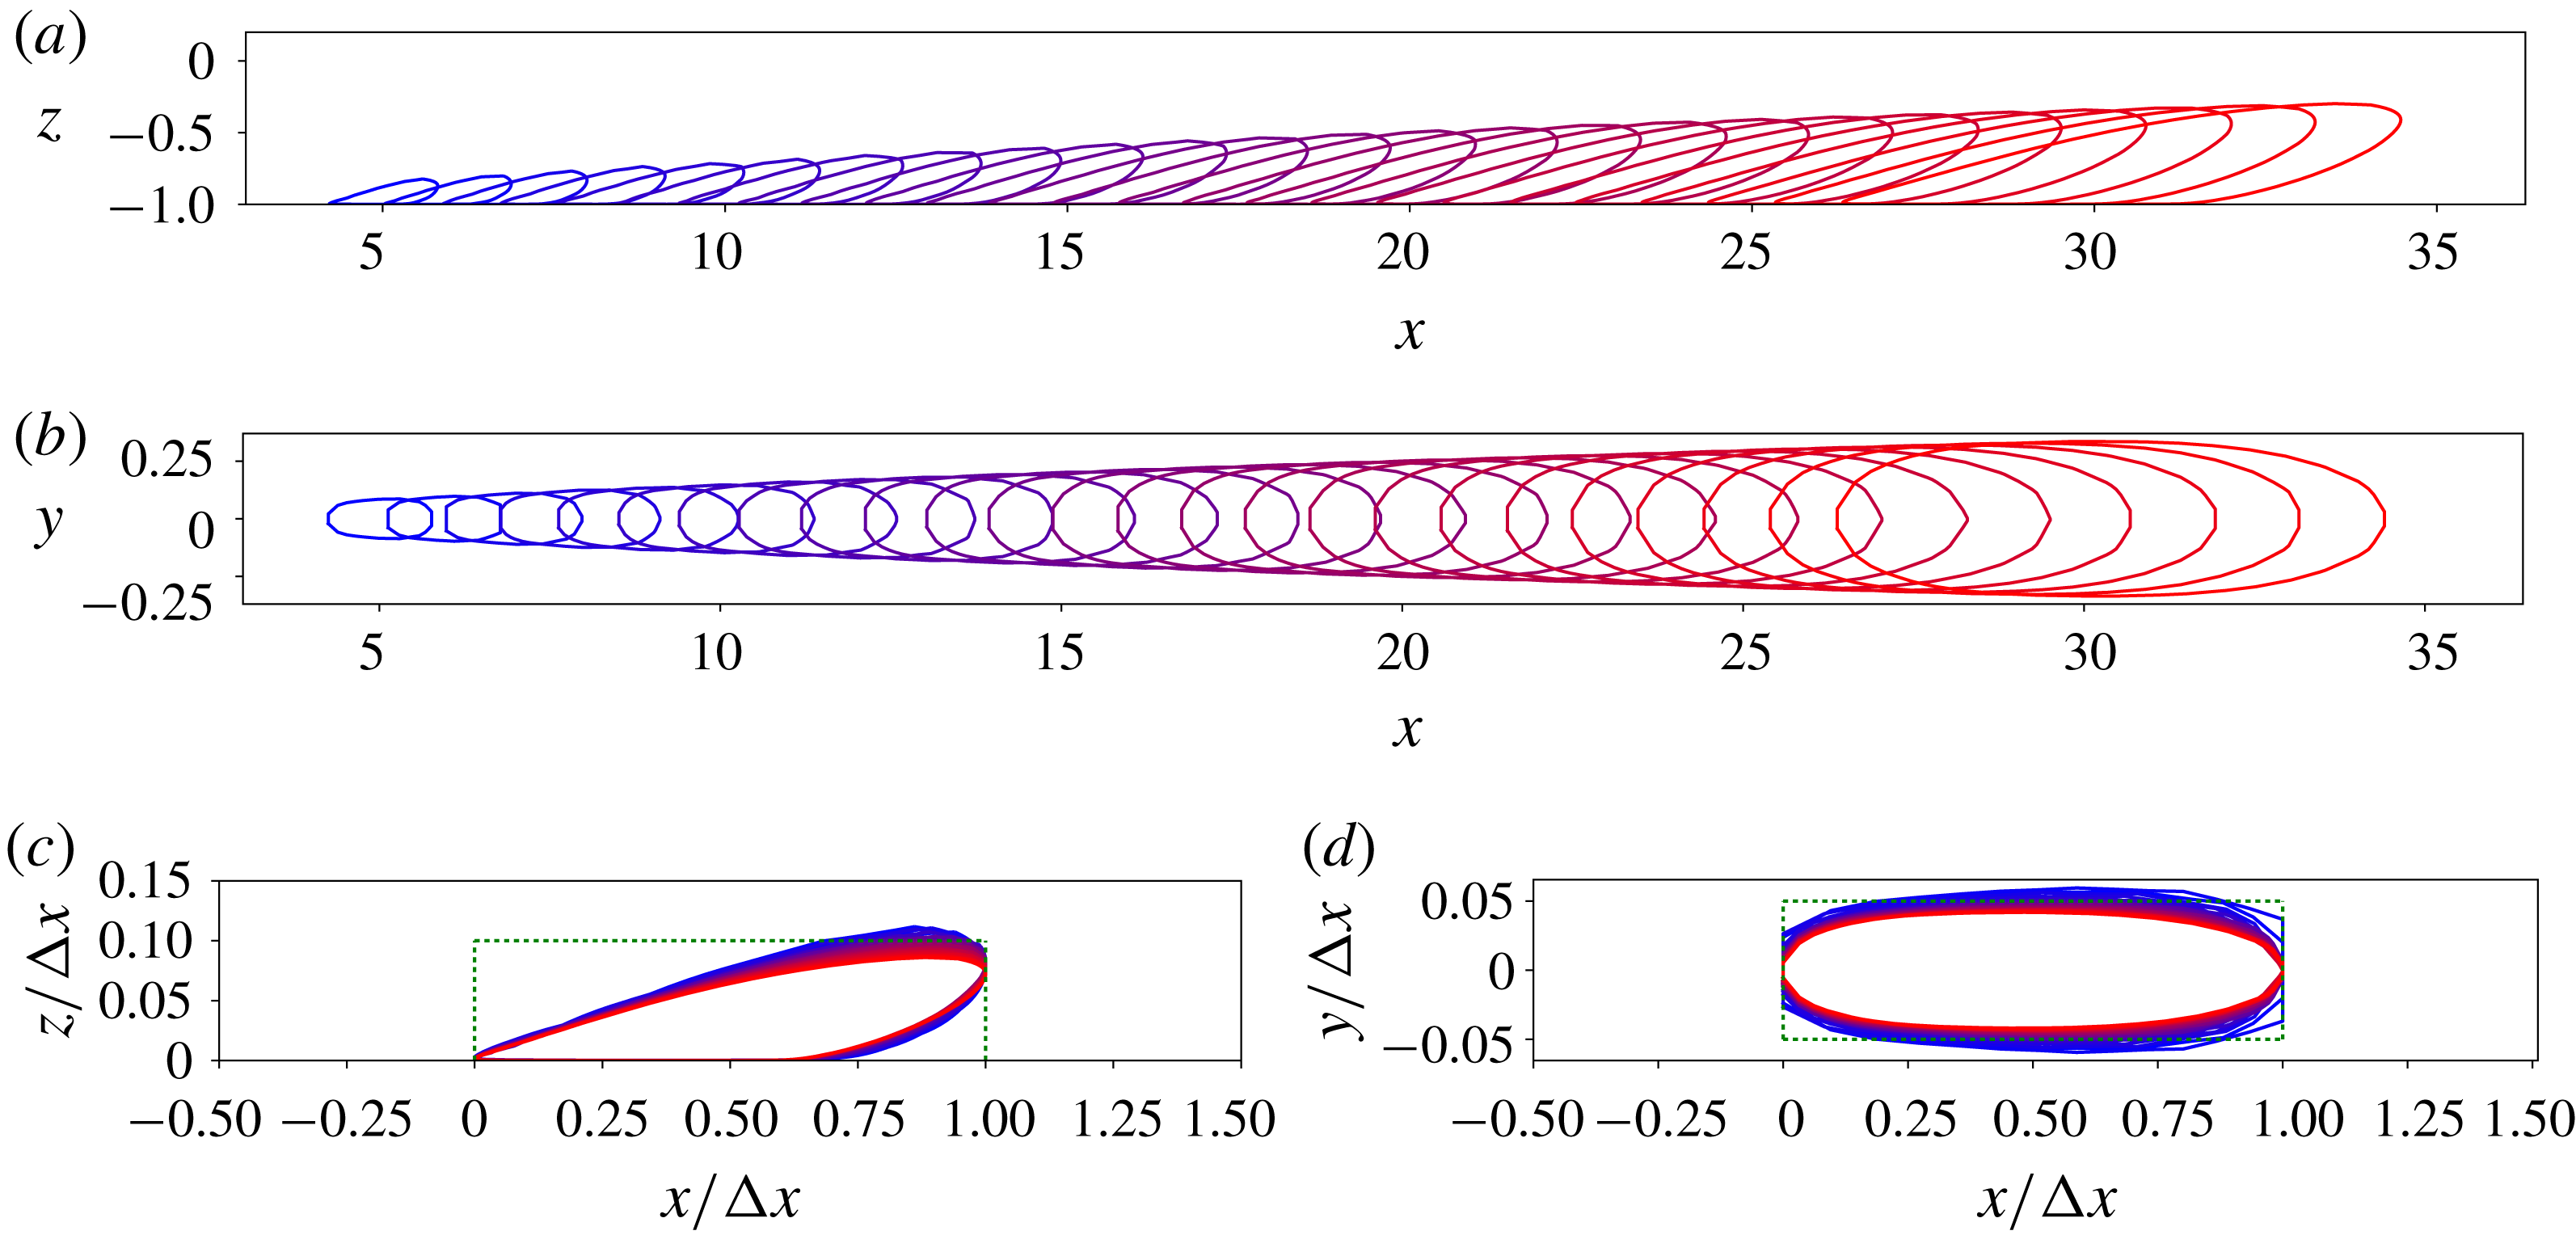
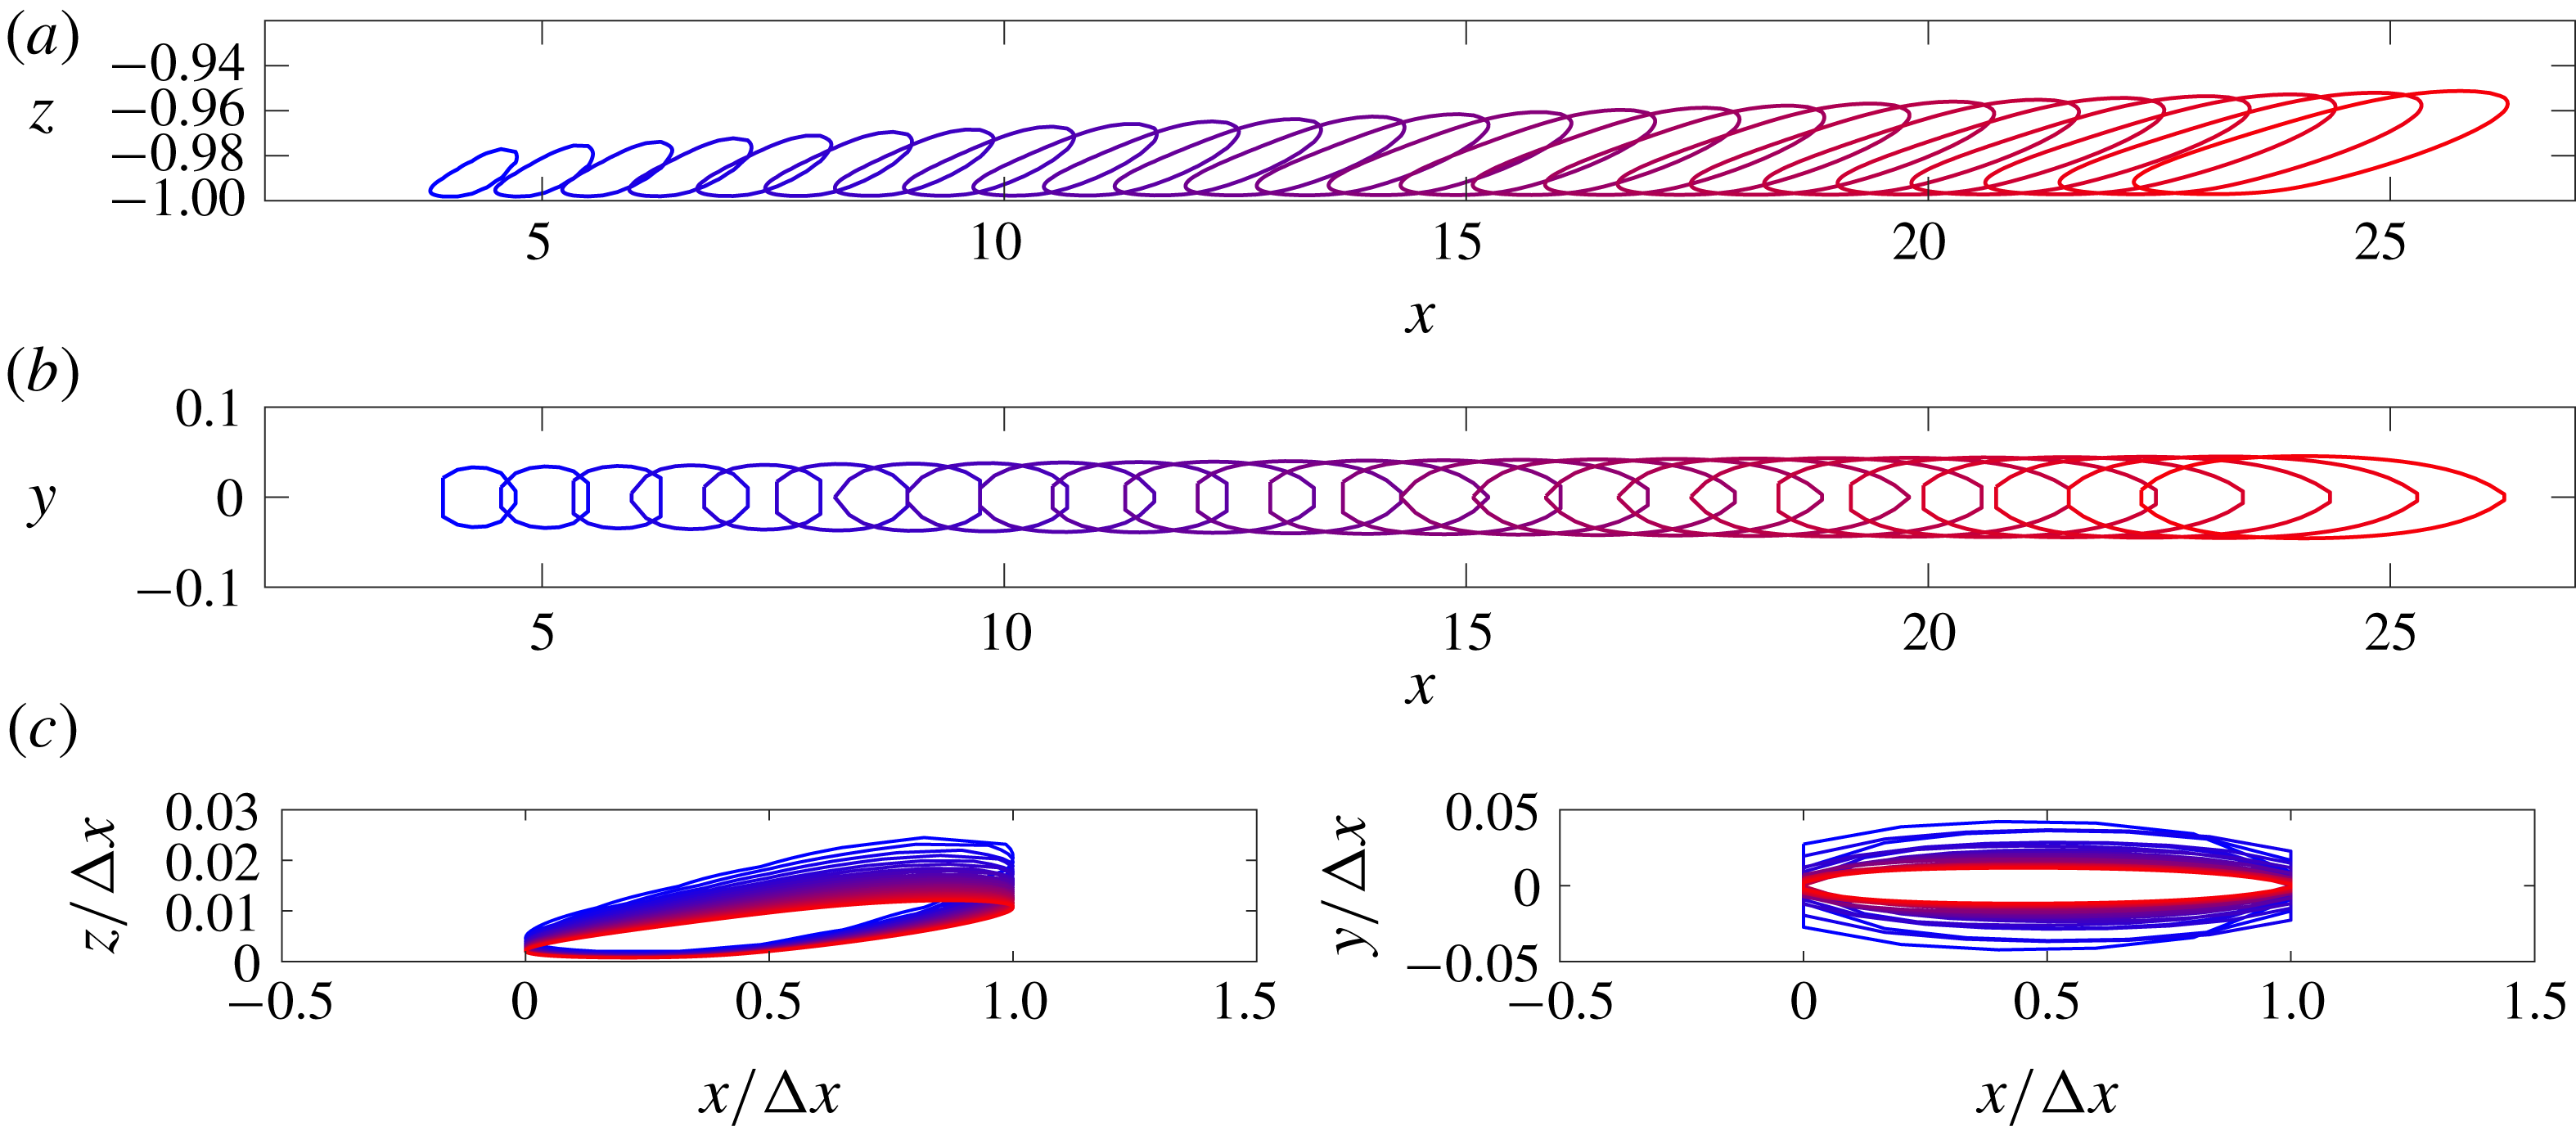
case, for example, is approximately 10 times greater than their wall-normal or spanwise size. Geometric self-similarity, furthermore, is nominally observed in the evolution of these vortex structures. The self-similarity of the coherent structures can be seen more clearly by projecting isosurfaces of streamwise velocity (at 25 % of instantaneous maximum) to the
 $x{-}z$
and
 $x{-}y$
planes. These are illustrated in figure 4 for the
 $I30x$
case, which has a single dominant streak. The projections show an approximate collapse in rectangular boxes of aspect ratio 10 (also shown in figure 4). Conversely, the molecular viscosity isosurfaces, plotted in figure 5, are not self-similar, as the structure gradually becomes significantly longer in the streamwise direction compared to its spanwise or wall-normal lengths.
Isocontours of streamwise velocity (25 % of maximum) for the
 $I30x$
case projected on the
 $y=0$
plane (a) and on the
 $z=0$
plane (b) at times
 $tU_{CL}/h$
from 8.52 to 42.7 in steps of 1.42; (c,d) show these contours scaled by streamwise size (
 $\unicode[STIX]{x0394}x$
) and shifted to
 $x=0$
, projected on
 $y=0$
(c) and
 $z=0$
(d). Contours are coloured to show evolution in time in the overlaid contours in the bottom panels. Rectangles of aspect ratio 10 are also plotted (dotted lines) to highlight the aspect ratio of the structures.

The aspect ratios of the structures for all nine eddy viscosity cases are summarized in table 1. These are measured for the final instant in time
 $tU_{CL}/h=41.2$
for the lower wall-normal heights and
 $tU_{CL}/h=14.2$
for the
 $z=-0.5$
case since the structure grows beyond the channel centreline for large
 $tU_{CL}/h$
. The particular value of
 $tU_{CL}/h$
does not affect these values significantly since, as seen in figure 4, the aspect ratios are roughly constant over time. The results are similar for
 $z^{+}=30$
and
 $z^{+}=500$
but differ for
 $z=-0.5$
. Impulses introduced at the lower wall-normal heights produce structures which have a streamwise to spanwise ratio of the order of
 $\unicode[STIX]{x1D706}_{x}/\unicode[STIX]{x1D706}_{y}\sim 8$
whereas the ratio for the
 $z=-0.5$
case is of the order of
 $\unicode[STIX]{x1D706}_{x}/\unicode[STIX]{x1D706}_{y}\sim 2$
. These results are consistent with those of Del Álamo & Jimenez (Reference Del Álamo and Jimenez2006), Lozano-Durán, Flores & Jiménez (Reference Lozano-Durán, Flores and Jiménez2012) and Hwang (Reference Hwang2015). Structures that originate nearer the wall share characteristics of very-large-scale motion (VLSM) while the structures in the outer layer have length scales similar to large-scale motion (LSM). The aspect ratio of the structures generated by impulses in the other directions is slightly more difficult to measure since they do not contain a single velocity streak. The spanwise width is measured across all velocity streaks contained in the structure. The ratio
 $\unicode[STIX]{x1D706}_{x}/\unicode[STIX]{x1D706}_{y}$
decreases from 8 to 5 for the
 $I30$
and
 $I500$
cases while it remains roughly constant between 2 and 3 for the
 $O05$
cases.
Isocontours of streamwise velocity (25 % of maximum) for the
 $I30x$
mol case projected on the
 $y=0$
plane (a) and on the
 $z=0$
plane (b) at times
 $tU_{CL}/h$
from 8.52 to 42.7 in steps of 1.42; (c,d) show these contours scaled by streamwise size (
 $\unicode[STIX]{x0394}x$
) and shifted to
 $x=0$
, projected on
 $y=0$
(c) and
 $z=0$
(d). Contours are coloured to show evolution in time.

Aspect ratios of the vortex structures for the nine cases considered.

3.3 Convection velocity
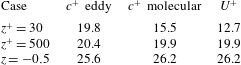
The convection velocity
 $c^{+}$
of the structures is computed by tracking the position of the maximum streamwise velocity
 $|u|_{max}$
at the wall-normal location where the impulse was introduced. The results for the
 $x$
impulse case are summarized in table 2 where the convection velocity of the structures in the molecular viscosity cases matches the mean velocity at the same wall-normal height. Notably,
 $c^{+}>U^{+}$
for the
 $z^{+}=30$
case, which is consistent with McKeon & Sharma (Reference McKeon and Sharma2010). The convection velocity of the structures generated with eddy viscosity does not agree perfectly with the local mean velocity, a trend that was also observed in Zare, Jovanović & Georgiou (Reference Zare, Jovanović and Georgiou2017).
Comparison of the convection velocity
 $c^{+}$
of the structures with and without eddy viscosity to the local mean velocity at the wall-normal height
 $z^{+}$
where the impulse is generated.

It can be concluded that one of the primary effects of the eddy viscosity is to weaken the critical layer mechanism. Eddy viscosity tends to smooth the spatial support of the most amplified disturbances, or resolvent modes, over a greater wall-normal extent. The optimal disturbances which excite them are also spread over a larger
 $\unicode[STIX]{x0394}z$
, signifying that an impulse will probably trigger significantly more resolvent modes than it would without the presence of eddy viscosity. In the molecular viscosity case, only the optimal modes located at the critical layer are activated by the impulse.
3.4 Reynolds stresses
The self-similarity of the eddy viscosity case only is further probed by considering the Reynolds stresses scaled by the height of the coherent structures (distance from the wall). For the periodic domain under consideration, the Reynolds stresses are defined as
 $$\begin{eqnarray}I_{ij}\left(\frac{1+z}{\unicode[STIX]{x1D6FF}_{h}},t\right):=\frac{K}{u_{\unicode[STIX]{x1D70F}}^{2}}\frac{k_{x,0}}{2\unicode[STIX]{x03C0}}\frac{k_{y,0}}{2\unicode[STIX]{x03C0}}\int _{x=0}^{2\unicode[STIX]{x03C0}/k_{x,0}}\!\int _{y=0}^{2\unicode[STIX]{x03C0}/k_{y,0}}u_{i}\left(x,y,\frac{1+z}{\unicode[STIX]{x1D6FF}_{h}},t\right)u_{j}\left(x,y,\frac{1+z}{\unicode[STIX]{x1D6FF}_{h}},t\right)\text{d}x\,\text{d}y.\end{eqnarray}$$
Here, all wall-normal distances are referenced from the wall (hence the
 $(1+z)$
dependence). The distances are scaled by
 $\unicode[STIX]{x1D6FF}_{h}$
, which represents the wall-normal height of the coherent structure, and is defined as the maximum height from the bottom wall of the
 $|u|=0.25|u|_{max}$
isosurface. The height of the structure is set to 1 whenever the isosurface extends into the top half of the channel. The constant
 $K$
is chosen such that the maximum of
 $-I_{13}$
is 1. This scaling of the Reynolds stresses is similar to the eddy intensity functions of Townsend (Reference Townsend1976), which is reasonable considering that the coherent structures in the impulse response are reminiscent of the attached eddies in Townsend’s attached-eddy hypothesis.
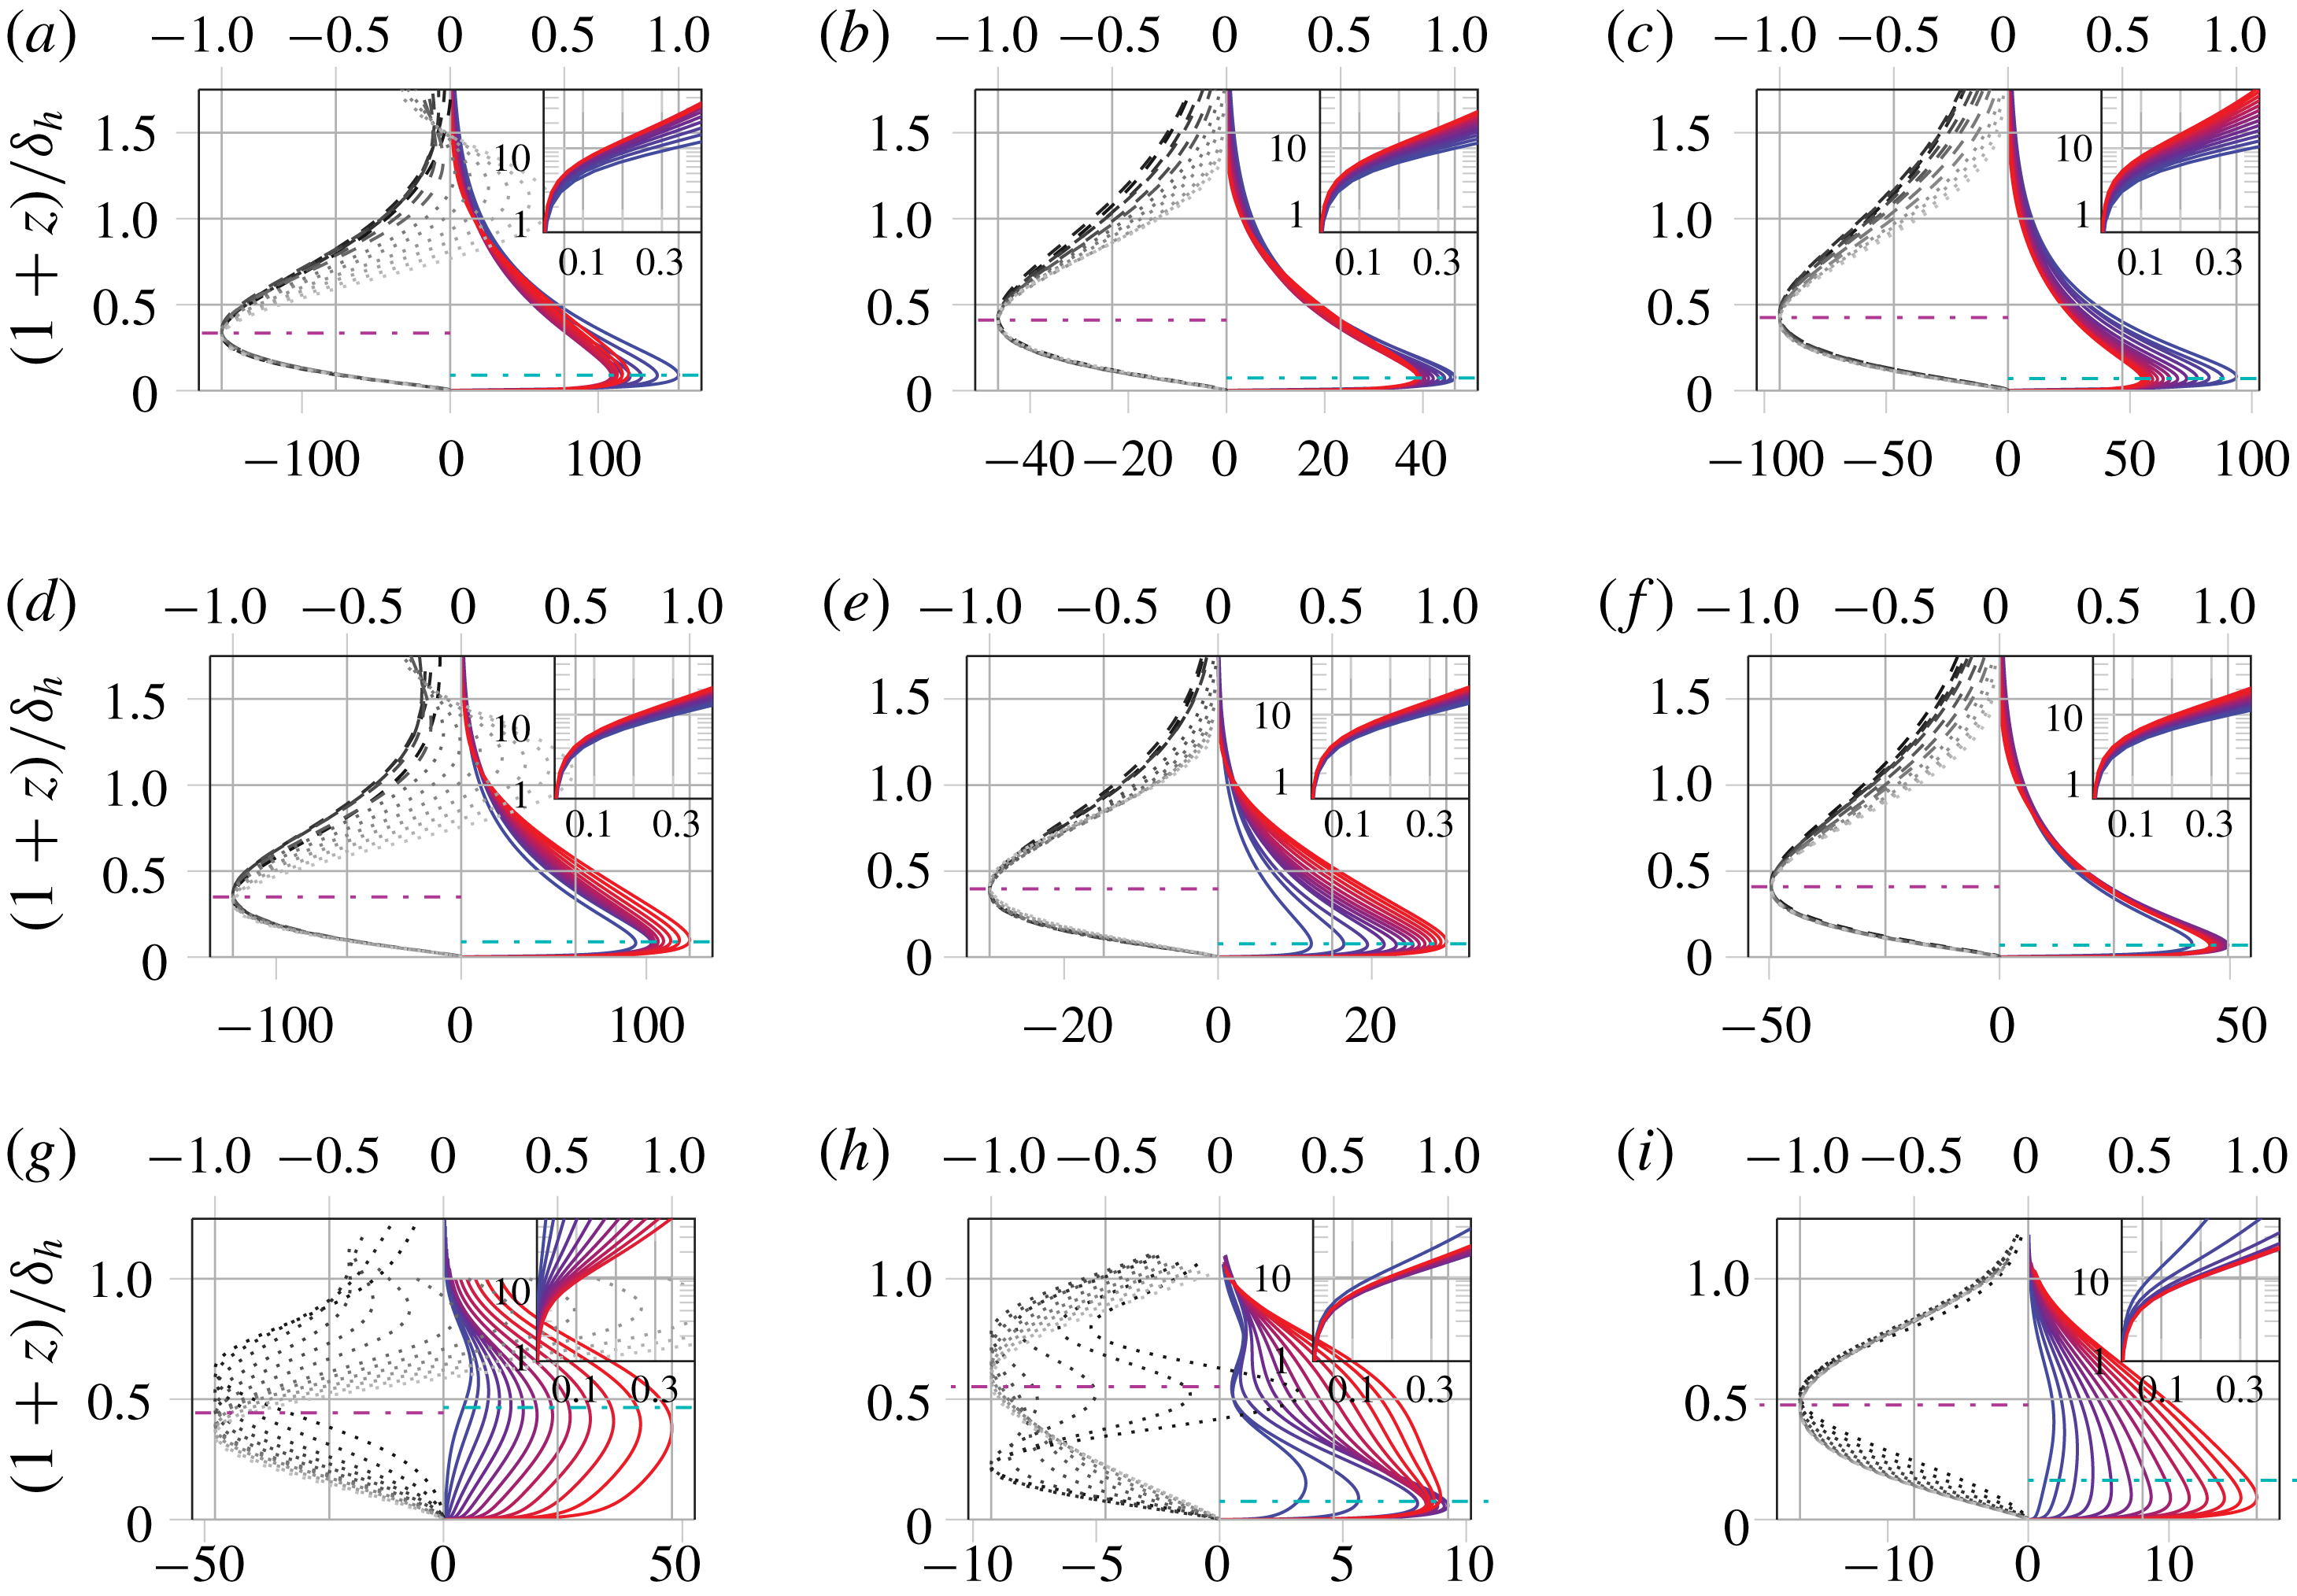
Reynolds stresses for impulses at
 $z^{+}=30$
(a–c),
 $z^{+}=500$
(d–f) and
 $z=-0.5$
(g–i) with forcing along
 $x$
(a,d,g),
 $y$
(b,e,h) and
 $z$
(c,f,i) at times
 $tU_{CL}/h$
from 5.7 to 42.7 in steps of 2.84. Panels show
 $I_{11}$
with scale on the bottom
 $x$
-axis, blue —— to red —— for increasing time; and
 $I_{13}$
with scale on the top
 $x$
axis, black —— to grey —— for increasing time, – – – for structures with
 $\unicode[STIX]{x1D6FF}_{h}\leqslant 0.5$
and
 $\cdots \cdots$
otherwise. The average locations of the peaks of
 $I_{11}$
(cyan – ⋅ – ⋅ –) and
 $I_{13}$
(magenta – ⋅ – ⋅ –) are also shown. All curves are truncated to ignore the top half of the channel (
 $z>1$
). Insets show near-wall streamwise energy:
 $I_{11}/\max (I_{11})$
on the
 $x$
-axis against
 $z^{+}$
on the
 $y$
-axis in log scale; note that
 $z^{+}$
here is not scaled by
 $\unicode[STIX]{x1D6FF}_{h}$
.

Reynolds stresses are shown for the nine cases of impulsive forcing in figure 6. Notably, the Reynolds stresses are smaller for the
 $z=-0.5$
cases, which is consistent with the fact that the structures are shorter in the
 $x$
-direction and are associated with weaker streamwise velocity perturbations. For all cases except
 $O05x$
, the coherent structures have non-zero streamwise energy at
 $z^{+}\sim 10$
(shown in inset), with
 $I_{11}/\max (I_{11})$
being greater than 10 %, thus showing that they are all attached to the wall. The shear intensity,
 $I_{13}$
, is consistently negative, except for very tall structures with
 $\unicode[STIX]{x1D6FF}_{h}>0.5$
in the core region of the channel. The locations of the peaks of
 $I_{13}$
show good collapse, and this peak is located further away from the wall than the peak of
 $I_{11}$
. The peaks of
 $I_{11}$
also show good collapse of the peak locations, but not in the peak magnitudes. The similarities in these three aspects – wall-attachedness, negative
 $I_{13}$
and relative location of
 $I_{13}$
and
 $I_{11}$
peaks – amongst the different impulse cases demonstrates that there is an underlying structure to the topology of the vortex–streak structures.
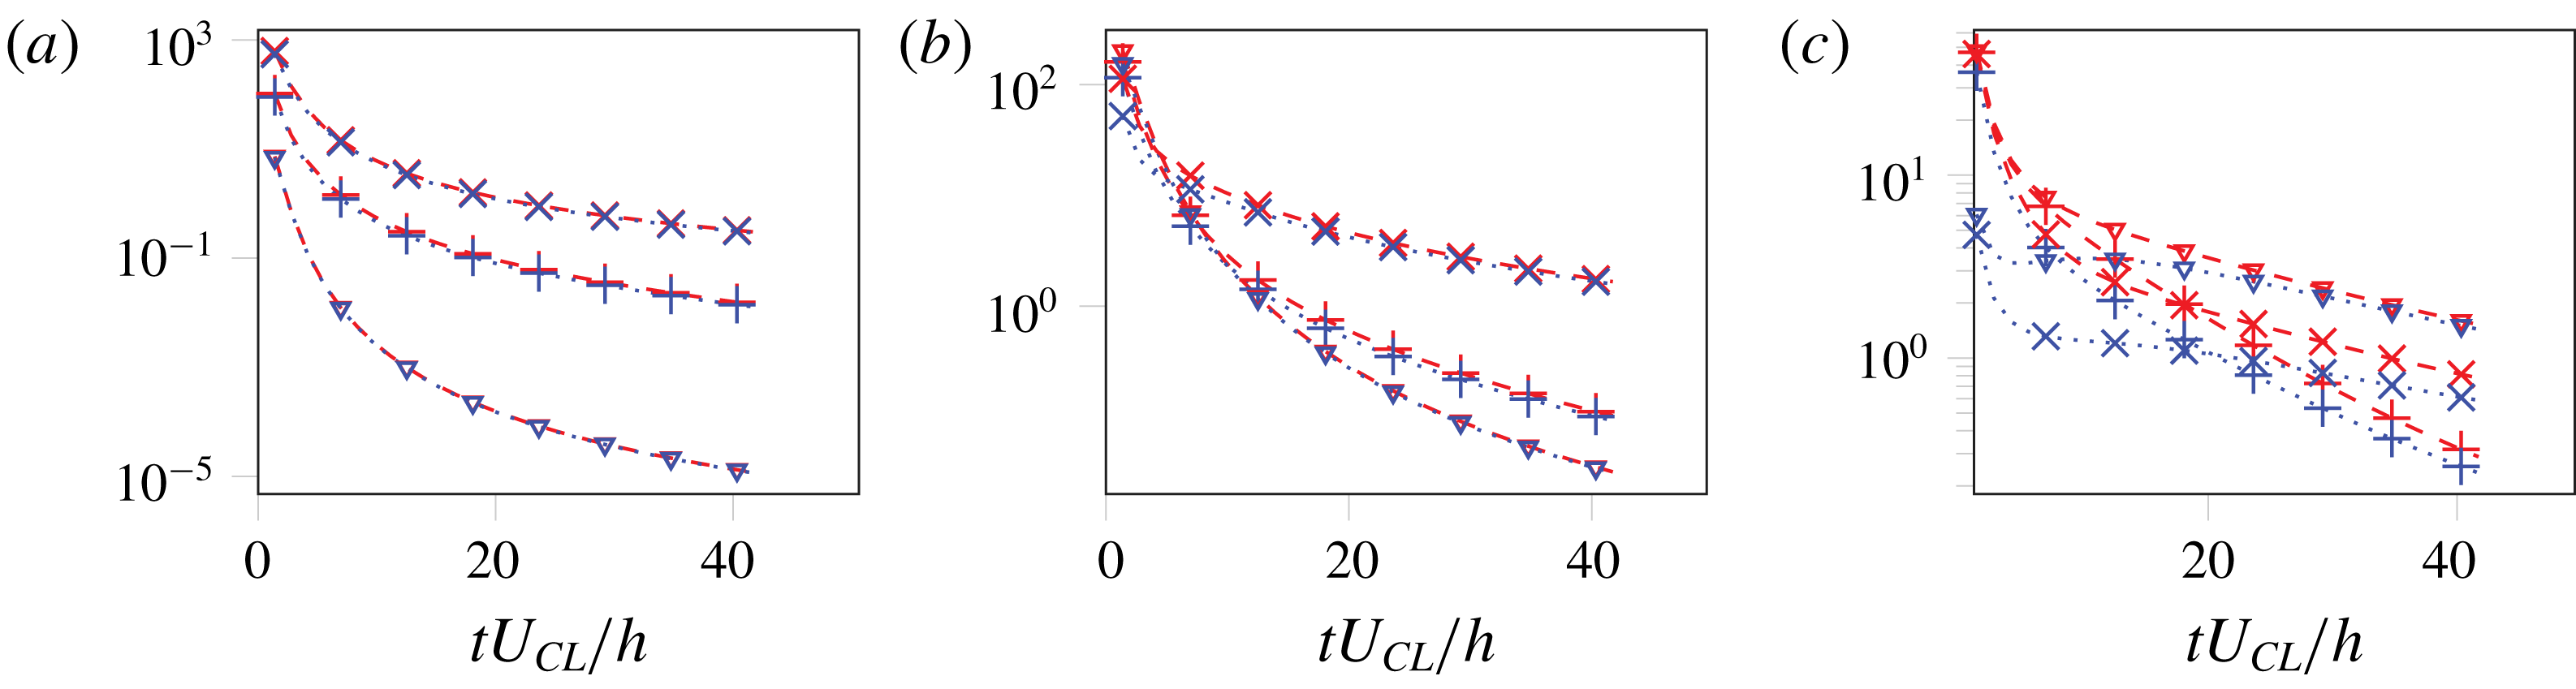
While the coherent structures exhibit self-similarity, they also decay quickly as shown in figure 7, where the streamwise and total kinetic energy density are shown for all nine impulses. The kinetic energy density is defined for each velocity component,
 $E_{u_{i}}$
, as
 $$\begin{eqnarray}E_{u_{i}}:=\frac{k_{x,0}}{2\unicode[STIX]{x03C0}}\,\frac{1}{2}\,\frac{k_{y,0}}{2\unicode[STIX]{x03C0}}\int _{x=0}^{2\unicode[STIX]{x03C0}/k_{x,0}}\!\int _{y=0}^{2\unicode[STIX]{x03C0}/k_{y,0}}\!\int _{z=-1}^{1}\left(\frac{u_{i}}{u_{\unicode[STIX]{x1D70F}}}\right)^{2}\text{d}x\,\text{d}y\,\text{d}z,\end{eqnarray}$$
with the total kinetic energy density
 $E$
being their sum,
 $E=E_{u}+E_{v}+E_{w}$
. For the
 $I30$
and
 $I500$
cases, the energy in the perturbations reduces by a few orders of magnitude by the time the structures reach the core of the channel (
 $\unicode[STIX]{x1D6FF}_{h}\gtrapprox 0.5$
). For the near-wall case, the total energy is predominantly due to streamwise velocity for the range of times considered here. For the impulses further away from the wall, however, there is significant energy in the cross-stream components. As the location of the impulse moves further away from the wall, the energy in the cross-stream components remains significant quite late into the decay. We reason that these differences arise due to the local differences in the mean shear and the eddy viscosity; due to the large mean shear near the wall, cross-stream velocities extract a large streamwise perturbation velocity from the mean velocity, while the cross-stream components themselves dissipate due to the eddy viscosity. For impulses away from the wall, the mean shear is significantly weaker, leading to slower extraction of streamwise velocity perturbation energy from the mean velocity. A detailed investigation of the early-time evolution of these perturbations is needed to shed light on these mechanisms.
Evolution of total (– – –) and streamwise (
 $\cdots \cdots$
) kinetic energy density for impulses introduced at different locations:
 $z^{+}\approx 30$
(a),
 $z^{+}\approx 500$
(b) and
 $z=-0.5$
(c). For each location, the plots show energy due to impulses along streamwise (
 $+$
), spanwise (
 $\times$
) and wall-normal (▿) directions. Markers correspond to times where coherent structures are plotted in figure 1.

4 Conclusion and outlook
The impulse response of the eddy-viscosity-enhanced linearized Navier–Stokes equations (eLNSE) shows spatially growing vortex–streak structures that have approximate geometric self-similarity, illustrated here at
 $Re_{\unicode[STIX]{x1D70F}}=10\,000$
. For the molecular viscosity case, the coherent structures are no longer self-similar and resemble a critical layer mechanism, particularly when the impulse is introduced at
 $z^{+}=500$
and
 $z=-0.5$
. This was consistent with the convection velocity of the structures which matched the local mean velocity. The coherent structures for eLNSE are quite similar to the vortex–streak structures known to be important to turbulence (Jiménez & Moin Reference Jiménez and Moin1991; Halcrow et al.
Reference Halcrow, Gibson, Cvitanović and Viswanath2009; Hall & Sherwin Reference Hall and Sherwin2010; Hwang Reference Hwang2015). These structures have an aspect ratio (streamwise size to wall-normal size) of approximately 10, which is close to the experimental observations of aspect ratios of attached eddies in the log layer (reported to be
 ${\approx}14$
based on linear coherence by Baars, Hutchins & Marusic (Reference Baars, Hutchins and Marusic2017) for boundary layers). The topology of the vortex streak structure does not change when the forcing is moved from
 $z^{+}\approx 30$
to
 $z^{+}\approx 500$
, but is dependent on the direction of the impulsive body force. This trend is also observed for forcing at
 $z=-0.5$
, albeit with noticeable differences in the shape of these structures as they extend into the top half of the channel.
Including an eddy viscosity, the coherent structures due to all nine impulses considered here evolve to have non-zero energy extending down to
 $z^{+}\sim 10$
, i.e. they are all attached to the wall. This includes the cases where the forcing is introduced at
 $z=-0.5$
. For the molecular viscosity case, the structures are localized around the critical layer. The coherent structures for all cases also produce a negative Reynolds shear stress
 $I_{13}$
, which peaks further away from the wall than
 $I_{11}$
. These observations are consistent with the supposed prevalence of attached eddies and the significance of ejection and sweeping events in turbulence. In short, irrespective of the location and direction of the impulse, the resulting structures are vortex–streak structures that are wall-attached and self-similar with negative
 $I_{13}$
and an aspect ratio of approximately 10. Considering this robust behaviour of the impulse response, we can expect that employing a spatio-temporally distributed body forcing would also produce similar structures. This provides more direct evidence, albeit under the approximation of the eLNSE model, for wall-attached hairpin-like vortices flanking velocity streaks in high-Reynolds-number flows.
The energy decay seen in the impulse response needs further clarification, since the large-scale structures appear to have very little energy density, which was also noted by Eitel-Amor et al. (Reference Eitel-Amor, Örlü, Schlatter and Flores2015). This hurdle could possibly disappear when, instead of response to isolated impulses, an appropriate sum of impulse responses is used; such forcing would represent the response to some spatio-temporally distributed forcing instead of a spatio-temporally localized forcing. Indeed, the Orr–Sommerfeld–Squire operator employed here is capable of producing energy growth that is larger than is needed to capture turbulence statistics (see figure 16 of Zare et al. Reference Zare, Jovanović and Georgiou2017). It is worth noting that the spatio-temporally distributed forcing that must be considered to compensate for the energy decay cannot be the actual Reynolds shear stresses, since a part of these stresses has been absorbed into the eddy viscosity. It would be interesting to determine such forcing, which would be an analogue of the work of Zare et al. (Reference Zare, Jovanović and Georgiou2017) for a flow field decomposed into self-similar coherent structures instead of Fourier modes. Unfortunately, no numerical schemes are presently available, as far as the authors are aware, that could achieve this; further limitations arise from the increasing difficulty to obtain spatio-temporally resolved measurements with increasing Reynolds number.
An alternative approach to constructing turbulence fields with the present coherent structures is the attached-eddy model of Perry & Marusic (Reference Perry and Marusic1995), which describes turbulent fluctuations as a superposition of self-similar attached eddies with a prescribed spatial distribution. The geometrically self-similar vortex–streak structures found in this work have the potential to be used as the building blocks in the attached-eddy model; this would bypass the need to prescribe the spatio-temporal distribution of the forcing. However, preliminary calculations (not included in this paper) show that the ratio of the peaks of the streamwise kinetic energy to the negative of the shear stress,
 $\max (I_{11})/\max (-I_{13})$
, due to the present coherent structures are higher, by a factor of order 10, than are needed to match the slopes of the Reynolds stresses in a fully turbulent flow using the attached-eddy model. This difference possibly suggests that the required attached-eddy velocity field requires more than the linear response considered here. This could include modifications to the linear operator or the inclusion of nonlinear interactions. However, these remain open issues that require further investigation. Even so, the robustness of the coherent structures found using the computationally cheap eLNSE model shows good potential in identifying a fundamental self-similar basis to describe turbulence dynamics.
Acknowledgement
The authors are grateful for the financial support of the Australian Research Council.