1. Introduction
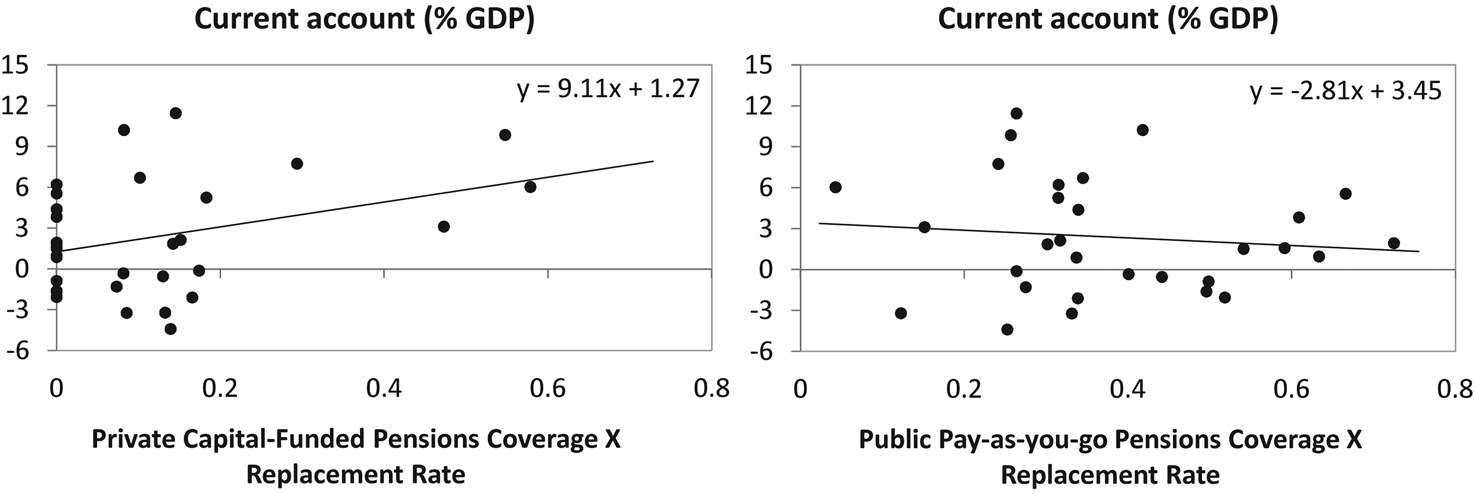
Figure 1 plots 2013 current account balances for high-income Organization for Economic Co-operation and Development (OECD) countries against two different pension variables, as well as linear correlations. The first pension variable is a measure of average post-retirement income provided by private capital-funded pensions, namely the product of the coverage rate with the average replacement rate of private pensions. The second variable does the same for public pay-as-you-go pensions. The figure suggests a positive association of the current account balance with private capital-funded pensions and a negative association with public pay-as-you-go pensions, both intuitive associations. Pay-as-you-go pensions indeed dispense households from saving for retirement and should lower current account balances, while capital-funded pension systems with a mandatory component or a tax incentive should increase national savings and thus the current account balance, ceteris paribus. The goal of the paper is to compare the impact of pay-as-you-go pensions on current account balances with the impact of capital-funded pensions in a systematic fashion.Footnote 1
Current account balances – pension variables correlations, rich OECD countries, 2013.

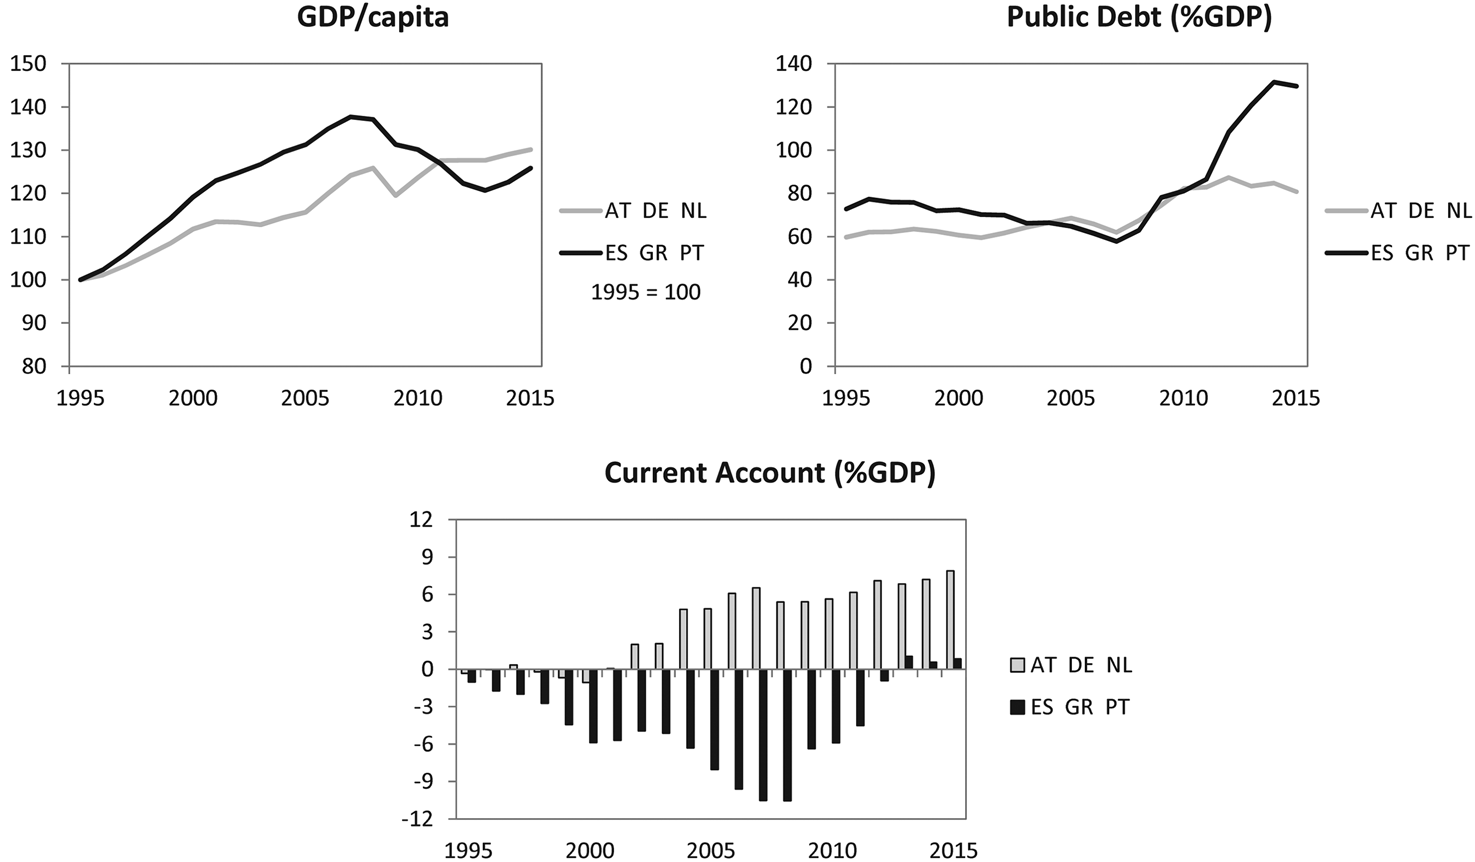
Large global trade and current account imbalances have attracted much policy attention.Footnote 2 While imbalances are not always a problem per se, they can signal problems or risks (Obstfeld, Reference Obstfeld2012). For instance, savings increases in developing countries can be a threat to efficient capital allocation in developed countries (Bernanke, Reference Bernanke2005). Excessive imbalances of current accounts between developed countries are also a cause for concern. The role of trade deficits in the prolonged Eurozone crisis, which led gross domestic product (GDP) to drop by 2.5% between 2008 and 2014 in the whole region, by 5% in Luxembourg, 8% in Finland, 11% in Italy and by 25% in Greece, has been intensely debated. Some attribute the crisis to excessive intra-European current account imbalances, revealing a loss of productive competitiveness in countries with growing trade deficits (Lane and Pels, Reference Lane and Pels2012). Others dispute this interpretation and contend that current account flows rather reflected the internationalization of investment and risk diversification (Reis, Reference Reis2012).
Given the policy relevance of current account imbalances, a number of explanations have been provided, including fiscal policy (Chinn and Prasad, Reference Chinn and Prasad2003), exchange rate regimes (Lane and Milesi-Ferretti, Reference Lane and Milesi-Ferretti2002), financial crises (Gruber and Kamin, Reference Gruber and Kamin2007), financial openness (Reinhardt et al., Reference Reinhardt, Ricci and Tressel2013), the development of financial markets (Mendoza et al., Reference Mendoza, Quadrini and Rios-Rull2009; Sandri, Reference Sandri2014), expropriation risk (Aguiar and Amador, Reference Aguiar and Amador2011; Benhima, Reference Benhima2013), assets prices (Fratzscher et al., Reference Fratzscher, Juvenal and Sarno2010), real estate valuation (Aizenman and Jinjarak, Reference Aizenman and Jinjarak2009), productivity shocks (Bussiere et al., Reference Bussiere, Fratzscher and Mueller2010), firms' credit constraints (Song et al., Reference Song, Storesletten and Zilibotti2011; Bacchetta and Benhima, Reference Bacchetta and Benhima2015), households' credit constraints (Coeurdacier et al., Reference Coeurdacier, Guibaud and Jin2015), households' saving constraints (Caballero et al., Reference Caballero, Farhi and Gourinchas2008; Gourinchas and Jeanne, Reference Gourinchas and Jeanne2013) or demographics (Chinn and Ito, Reference Chinn and Ito2007; Gerigk et al., Reference Gerigk, Rinawi and Wicht2018).Footnote 3 Yet, as Fratzscher et al. (Reference Fratzscher, Juvenal and Sarno2010) write, ‘the debate on the causes of global current account imbalances is still wide open’ (p. 657).
Eugeni (Reference Eugeni2015) investigates the role of public pensions. Households should save more in countries with smaller public pay-as-you-go pension systems to finance their old age consumption, a positive impact on current account balances. Using a worldwide country sample, she empirically verified this prediction. However, I show that the test fails when restricted to high-income countries. Yet, large imbalances among rich countries also generate concerns.
I use two complementary approaches to compare the impact of pay-as-you-go pensions on current account balances with the impact of capital-funded pensions. The main comparison is made with model simulations, which offers a clean identification mechanism. The key theoretical outcome is then tested using the empirical approach from Eugeni (Reference Eugeni2015), after adjustments of the pension variables.
Model simulations are made with the overlapping-generations model developed by Keuschnigg et al. (Reference Keuschnigg, Davoine and Schuster2015), which explicitly differentiates between households' savings, pay-as-you-go pensions and capital-funded pensions. Austria is used as a representative country because of its large public pension system and because it has no capital-funded component, offering a clean starting point for the comparisons. A small open economy assumption is applied to isolate the impact of pension systems from the impacts due to demographic differentials.Footnote 4 Because the accumulation process in capital-funded pensions is slow, the analysis focuses on the long run and thus takes population aging into account.
The main simulation findings are the following. Consistent with the intuition, pure pay-as-you-go pensions decrease the net holdings of foreign assets as the population ages. A multi-pillar system with large enough capital-funded pensions does the opposite. In four decades, net foreign assets would for instance decrease by 35 percentage points of GDP with a pure pay-as-you-go system but increase by 5 percentage points of GDP with a multi-pillar system where the capital-funded pillar accounts for 18% of pension expenditures. Two decades after the introduction of the capital-funded pillar, the current account balance would be 1.0 percentage point of GDP higher with multi-pillar pensions than with pure pay-as-you-go pensions. The actual current account surplus in Austria, which averaged 1.8% of GDP between 2011 and 2016, puts these findings in perspective.
The driving force for these findings is the savings nature of capital-funded pensions. While social security contributions from workers are immediately transferred to retired persons for consumption under a pay-as-you go system, they are put in a retirement fund and saved for future own consumption in capital-funded pensions. National saving is higher in the second case, exceeding domestic investment opportunities and generating investments abroad, and thus an increase of the current account balance and net foreign assets.
Empirically, I present cross-section evidence with partial support for the theoretical findings. The signs of private and public pension coefficients are consistent with the simulation findings but only the private pension coefficient is statistically significant. For high-income OECD countries, I find that the current account balance increases with the coverage and replacement rates of capital-funded pensions.
The research I present is related to two strands of the literature. First, it contributes to the large literature on the determinants of the current account, introduced above. Specifically, it is a complement to Eugeni (Reference Eugeni2015), focusing on developed countries and separating pay-as-you-go and capital-funded pensions. It is also related to Schimmelpfennig (Reference Schimmelpfennig2000), who shows that the current account impact of reforms implementing capital-funded systems differs if individuals are forward-looking or myopic. In this paper, I only consider forward-looking households but add labor supply incentives. As my presentation will show, a fine labor market representation is important to quantify labor supply, domestic investment and current account reactions.
Second, it links two parts of the general equilibrium macroeconomic literature on aging and pensions. One part differentiates between pay-as-you-go and capital-funded pensions but does not consider current account impacts. This part of the literature is comparatively smaller.Footnote 5 The second part of the literature considers current account impacts, often with multi-country models,Footnote 6 but does not explicitly model capital-funded pensions and sometimes interprets households' own savings as pre-funded pensions. The current paper links both parts of the literature and illustrates differences between households' savings and pre-funded pensions.
The paper continues with the presentation of the simulation model, followed by an elementary analysis in Section 3, by simulation results in Section 4 and by cross-section empirical results in Section 5. Section 6 provides a perspective on the results, including policy implications. Concluding remarks are given in Section 7.
2. Model
The model used for the simulations comes from Keuschnigg et al. (Reference Keuschnigg, Davoine and Schuster2015). It is of the Auerbach and Kotlikoff (Reference Auerbach and Kotlikoff1987) family and builds on Jaag et al. (Reference Jaag, Keuschnigg and Keuschnigg2010), which includes endogenous consumption and labor supply decisions, three skill classes, imperfect labor markets and an explicit modeling of multi-pillar pensions. The resulting model is a large-scale overlapping-generations model offering a precise quantification of macroeconomic outcomes suitable for policy evaluation, a benefit for the simulations performed in this paper.Footnote 7 At the same time, the large-scale model is consistent with stylized two-period models used to obtain analytical results on pensions and the current account, as in Eugeni (Reference Eugeni2015). Calibration is made for Austria, with average values between 2010 and 2015 to remove business cycle fluctuations.
This section presents in detail the most relevant parts of the model and summarizes other features at the end.Footnote 8
2.1 Demographics
Households go through several stages a ∈ {1, …, 8} in their life. A stage a lasts several time periods. After birth, households are educated, then enter the labor market and retire. Several stages a cover labor market activity, allowing for different productivity levels (typically hump-shaped). Households face a constant, age-dependent probability of dying 1 − γ a. They differ in skills, birth date and death date.Footnote 9 After they are born, they are randomly assigned one of three skill levels, low, medium or high, i ∈ {l, m, h}. Medium and high skills are acquired through further education, which has no cost but delays access to the labor market. Education for medium skills takes place in stage a = 1, for high skills in stages a ∈ {1, 2}. Retirement is defined exogenously and happens some time during stage a R = 5. Stages a ∈ {6, 7, 8} are full retirement stages but with different probabilities of dying 1 − γ a, to better replicate the empirical age structure of the population. As in Blanchard (Reference Blanchard1985), a reverse life insurance allocates assets at death.Footnote 10
2.2 Labor market
After education, households can enter the labor market. They choose whether to participate or not (at a rate δ a,i ∈ [0, 1], which represents the number of time periods of the life-cycle stage with participation). If they participate, they decide how many hours to work in their jobs (l a,i ≥ 0). Non-participation in stage a R is interpreted as retirement. Conditional on labor market participation, gross labor income equals
 $$y_{lab}^{a,i} = l^{a,i}\cdot \theta ^{a,i}\cdot w^{a,i}$$
where θ a,i is an exogenous age-productivity profile calibrated with micro-data and w a,i is the wage per efficiency unit, assuming separate labor markets for each life-cycle group and skill class. In addition to income, labor market activity gives access to earnings-related pensions, as presented below.
2.3 Household maximization
Households are fully rational with perfect foresight, make labor supply decisions (δ a,i , l a,i ) and consumption decisions C a,i to maximize their expected life-time utility  $V_t^{0,i} $, where
 $V_t^{a,i} $ is the expected remaining life-time utility of a household in life-cycle stage a with skill level i at time t. Preferences are expressed in recursive fashion and restrict households to being risk neutral with respect to variations in income but allow for an arbitrary intertemporal elasticity of substitution:
 $$V_t^{a,i} = \max \left[ {{\left( {Q_t^{a,i}} \right) }^\rho + \gamma^a\beta {\left( {GV_{t + 1}^{a,i}} \right) }^\rho} \right] ^{1/p}$$
where ρ defines the elasticity of intertemporal substitution 1/(1 − ρ), β is a time discounting factor,  $Q_t^{a,i} $ is effort-adjusted consumption, and G = 1 + g is the gross factor of growth by which the model is detrended.
Labor market activity generates disutility: As in Greenwood et al. (Reference Greenwood, Hercowitz and Huffman1988) and Jaag et al. (Reference Jaag, Keuschnigg and Keuschnigg2010), effort-adjusted consumption Q a,i captures the utility cost of labor market activity expressed in goods equivalent terms, with
 $$Q^{a,i} = C^{a,i}-\bar{\varphi} ^{a,i}\lpar {\delta^{a,i},l^{a,i}} \rpar $$
where  $\bar{\varphi} ^{a,i} = \delta ^{a,i}\varphi ^{L,i}\lpar {l^{a,i}} \rpar + \varphi ^{P,i}\lpar {\delta^{a,i}} \rpar $ is a convex increasing function in all its arguments, φL,i capturing the disutility of working hours and φP,i the disutility of participation.
Lifetime utility is maximized subject to three budgetary laws of motion, one for households' savings, one for the pay-as-you-go pension pillar and one for the capital-funded pension pillar. The laws of motion for pension pillars will be presented below. The law of motion for households' savings is the following budget constraint, which takes the Blanchard (Reference Blanchard1985) reverse-life insurance into account:
 $$G\gamma ^{a,i}A_{t + 1}^{a,i} = R\lpar {A_t^{a,i} + y_t^{a,i} -\lpar {1 + \tau_t^C} \rpar C_t^{a,i}} \rpar $$
where A a,i represent assets (households' savings), y a,i net income flows, τ C the consumption tax rate and R = 1 + r the gross interest rate. Because a small open economy assumption will be made and a constant interest rate will be used (see below), the time index on the interest rate is ignored.
The assumption that households are fully rational with perfect foresight is standard in overlapping-generations analyses. It can however be disputed, based on empirical evidence on households' saving in countries with pay-as-you-go pensions (Feldstein, Reference Feldstein1974). The debate is still on-going (for overviews, see Feldstein and Liebman, Reference Feldstein, Liebman, Auerbach and Feldstein2002; or Boersch-Supan et al., Reference Boersch-Supan, Bucher-Koenen, Coppola and Lamla2015) but its resolution could affect some of my simulation results. If households are to some extent myopic, they may for instance reduce private savings to a larger extent than fully rational households after the introduction of mandatory capital-funded pensions. However, the saving behavior, and thus the impact on current account balances, may be close to the fully rational case in the main simulation scenario, where capital-funded pensions replace part of pay-as-you-go pensions.
2.4 Pension system
The pension system can have up to three pillars. The first pillar is a flat payment from the government, unrelated to previous income and designed to protect against old-age poverty. The second pillar is also part of the public pensions but related to earnings' history. Both pillars are financed from social security contributions (and tax revenue, if needed) in a pay-as-you-go fashion. The third pillar is a mandatory private pension fund where households contribute a part of their earnings and which delivers, at retirement, a permanent annuity in an actuarially fair fashion which depends on life expectancy. Since assets from the pension fund can be invested and deliver a return, the third pillar represents capital-funded pensions.
The first pillar simply consists in an exogenously defined flat payment P 0, received each period after retirement. The second pillar delivers earnings-related benefits. During their working life, households build up pay-as-you-go pension rights  $P_t^{E,a,i} $ with labor market income
 $y_{lab,t}^{a,i} $, according to the law of motion:
 $$GP_{t + 1}^{E,a,i} = R^E\lcub {\delta_t^{a,i} y_{lab,t}^{a,i} + P_t^{E,a,i}} \rcub $$
where R E is a policy parameter which implies either price indexation of pensions (R E = 1), wage indexation (R E = G) or a mixture. After retirement, households receive a payment ν aP E,a,i in each period, where ν a is a conversion factor between pension rights and pension payments. Note that neither the first nor the second pillar payments are related to the social security contribution rate or to life expectancy. Without reforms of the pension system, population aging leads over the long run to a financial deficit of the pay-as-you-go pillars.
In contrast, the third pillar is always financially balanced, because the annuity payment depends on expected life expectancy. Concretely, households are mandated to pay a part of their labor income into a pension fund  $A_t^{F,a,i} $ at the contribution rate τ F,H,i . Firms also contribute to the fund at the rate τ F,F,i . The fund is made available on the capital market and earns a return. Administration costs ρ F however reduce the net returns, equal to R F = R − ρ F. In the event of death before retirement, assets are distributed to surviving households by the Blanchard (Reference Blanchard1985) reverse-life insurance. The pension fund thus accumulates assets according to the following law of motion:
 $$G\gamma ^{a,i}A_{t + 1}^{F,a,i} = R^F\lcub {\lpar {\tau^{F,H,i} + \tau^{F,F,i}} \rpar \delta_t^{a,i} y_{lab,t}^{a,i} + A_t^{F,a,i}} \rcub $$
After retirement, households receive an annuity payment μ aA F,a,i from the pension fund in each period, where μ a is an annuitization factor which depends on expected remaining life expectancy and is set so that the individual pension fund is, on average, exhausted exactly at the time of death. The third pillar thus always remains financially balanced, even when the population is aging.
Parameters of the pension system influence not only saving decisions, but also labor supply decisions. Because of its redistributive properties, the first pillar creates distortions and reduces labor supply incentives. The second pillar, thanks to its earnings-related component, generates in general fewer distortions. The third pillar generates even less distortions, because the beneficiaries are the same households as the contributors. For a more formal discussion, see Keuschnigg et al. (Reference Keuschnigg, Keuschnigg and Jaag2011).
As Section 4 will discuss, these labor supply distortions play a role in simulation outcomes. In reality, the type of the pension system may also influence retirement decisions. Because the link between contributions and benefits is tight in the third pillar, this pillar does not generate incentives to either anticipate or postpone retirement, ceteris paribus. In other pillars, the link is not as tight, influencing retirement decisions. Reforms which modify the pillar composition of the pension system may thus influence the average retirement age. For simplicity and clarity of results however, I ignore incentives on retirement decisions and treat these decisions in an exogenous fashion in the model.
In many countries, the third pillar is compulsory: households have to contribute to the capital-funded pension pillar, at a mandated rate. In a few other countries, the third pillar is voluntary.Footnote 11 In that case, there usually are tax incentives for households to initiate and save into a private fund for the purpose of supporting income after retirement, as well as restrictions on the usage of the fund. In this study, I only consider compulsory capital-funded pension pillars, for the sake of simplicity. Whether or not voluntary capital-funded pensions reach the same size as compulsory capital-funded pensions depends on the exact parameters of the pillar. If voluntary capital-funded pensions reach the same size through time, I expect my simulation results to extend to the voluntary pensions case, because of similar aggregate consequences.
2.5 Household income
If they do not participate on the labor market, households receive welfare benefits  $y_{nonpar}^a $. Adding up labor income taxes t a,i , social security contributions τ S,H,i and contributions to the pensions fund τ F,H,i into the variable τ a,i = t a,i + τ S,H,i + τ F,H,i , and assuming that each labor market state (i.e., non-participation and employment) is visited in each time period,Footnote 12 net household income amounts to:
 $$y^{a,i} = \left\{ {\matrix{ {\lpar {1-\tau^{a,i}} \rpar \lsqb {\delta^{a,i}y_{lab}^{a,i} + \lpar {1-\delta^{a,i}} \rpar y_{nonpar}^a} \rsqb } \hfill & {{\rm if\;} a \lt a^R} \hfill \cr {\lpar {1-\tau^{a,i}} \rpar \lsqb {\delta^{a,i}y_{lab}^{a,i} + \lpar {1-\delta^{a,i}} \rpar y_{\,pens}^{a,i}} \rsqb } \hfill & {{\rm if\;} a = a^R} \hfill \cr {\lpar {1-\tau^{a,i}} \rpar y_{\,pens}^{a,i}} \hfill & {{\rm if\;} a \gt a^R} \hfill \cr}} \right.$$
where the pension payment sums up proceeds from the first, second and third pillars:
 $$y_{\,pens}^{a,i} = P_0 + \nu ^aP^{E,a,i} + \mu ^aA^{F,a,i}$$
2.6 Production
Production is made by a competitive representative firm taking input prices as given, namely wage rates, the interest rate and the price of the output good, which serves as numeraire. Changes in the production process are costly variations in the capital stock K t, thus subject to convex capital adjustment costs. The production function is linear homogeneous:
 $$Y_t = F^Y\lpar {K_t,L_t^{D,i = 1}, L_t^{D,i = 2}, L_t^{D,i = 3}} \rpar $$
The labor inputs  $L_t^{D,i} $ from different skill classes are not perfect substitutes: consistent with empirical evidence, we assume that high skill labor and capital are more complementary than low skill labor.
Firms make investment I t decisions to maximize the flow of dividends they can generate. Formally, the representative firm maximizes its end of period value V F, which equals the stream of discounted dividend payments χ:
 $$\eqalign{V_t^F \lpar {K_t} \rpar = &\mathop {\max} \limits_{I_t} \left[ {\chi_t + \displaystyle{{GV^F\lpar {K_{t + 1}} \rpar } \over R}} \right] \cr s.t.\quad \chi _t = &Y_t-I_t-J\lpar {I_t,K_t} \rpar -\mathop {\mathop \sum \nolimits^} \limits_i \lpar {1 + \tau^{S,F,i} + \tau^{F,F,i}} \rpar w_t^i L_t^{D,i} -T_t^F \cr GK_{t + 1} = &\lpar {1-\delta^K} \rpar K_t + I_t} $$
where the function J represents the adjustment costs, τ S,F,i the firms' social security contribution rate and  $T_t^F $ the total tax bill of firms, net of subsidies they receive. Given an interest rate, investment is defined so that the return on financial investments (the interest rate) equals the marginal cost of investment (Tobin's q). As in Hayashi (Reference Hayashi1982), one can show that the value of the representative firm is directly related to the capital stock, V F = q · K.
2.7 Government
Government provides welfare benefits, pay-as-you-go pensions and investment subsidies. State expenditures also include public consumption, long-term care and health expenditures, all defined exogenously in per capita terms and generating no utility.
To finance expenditures, the government collects consumption taxes, labor income taxes, profit taxes, firm and worker social security contributions. The government can borrow on the capital market to finance public debt D G, which is kept constant in simulations. Ruling out arbitrage, the borrowing costs equal the interest rate r. The resulting government budget constraint is:
 $$GD_{t + 1}^G = R\lpar {D_t^G -PB_t} \rpar,$$
where the government primary balance PB subtracts government expenditures from government revenue:
 $$PB_t = \tau ^CC_t + T_t^L + T_t^F + T_t^S -G_t-SS_t,$$
C t representing aggregate consumption,  $T_t^L $ the total revenue from labor income taxes,
 $T_t^S $ the total revenue from social security contributions, G t summing up government expenditures and SS t representing all social security payments, made up of welfare benefits and public pensions.Footnote 13
2.8 Equilibrium
To isolate the current account impact of pensions from impacts arising from cross-country differentials, I use a small open economy assumption with exogenous and constant interest rate R.
The labor market clears by design. By Walras Law, the goods market clears when the two other markets, for asset and labor, clear. All assets are assumed to be perfect substitutes with no arbitrage possibilities, so that total private household assets (A) and pension funds (A F) are invested in the domestic representative firm (V F), government debt (D G) and foreign assets (D F), the last variable being expressed in net terms. The asset market clearing condition is thus:
 $$A_t + A_t^F = V_t^F + D_t^G + D_t^F $$
By the no arbitrage assumption, all financial assets earn the same return r. Given the small open economy assumption, net foreign assets simply adjust to clear the asset market and earn the return r, which, through the foreign assets law of motion, defines the current account balance (CA):
 $$D_{t + 1}^F = R\lpar {D_t^F + CA_t} \rpar $$
As a consequence of Walras Law, the goods market clearing condition then holds:
 $$Y_t = C_t + I_t + G_t + CA_t$$
Asset markets clearing plays a key role in the results of this paper. A demographic shock or pension reform can influence foreign assets and thus the current account in three ways: (a) by changing the saving behavior of the households, through A, (b) by changing savings rules into the mandatory pension fund, through A F or (c) by changing the domestic investment opportunities, through V F.
Taking the small open economy assumption and the result V F = q · K into account, this discussion also shows the benefit one derives from modeling labor supply decisions precisely. Firms indeed make investment decisions to equate the marginal product of capital with the given interest rate. If firms invest little but households increase their savings much, these need to be invested abroad, which impacts the current account balance; and vice-versa. Effective variations in labor supply thus influence the marginal product of capital, firms' investments and the current account balance. In general equilibrium, firms' decisions also impact households' income and thus labor supply decisions. As noted earlier, pension systems impact labor supply decisions, which impacts investment. Conversely, investment decisions also impact labor supply decisions in general equilibrium.
Throughout the analysis, it is assumed that the pension system type does not influence the efficiency of capital markets. Yet, some argue that capital-funded pensions can improve the functioning of domestic capital markets, as they increase their size (for a more complete and critical discussion, see Lindbeck and Persson, Reference Lindbeck and Persson2003). Capital-funded pensions may thus ease domestic investments, beyond their influence through the labor supply channel. For simplicity, I neglect that possibility. If indeed capital-funded pensions improve the functioning of domestic capital markets, I expect my simulations to underestimate domestic investment in scenarios which include capital-funded pillars, and thus overestimate their positive impact on the current account balance. Quantifying the size of any such bias is left for future research.
2.9 Full scale model
The Keuschnigg et al. (Reference Keuschnigg, Davoine and Schuster2015) model that I use for simulations has additional features which are not directly related to capital-funded pensions, and thus not essential for understanding the results, but improve quantitative predictions. I summarize here these features.
First, labor markets are imperfect, households being exposed to unemployment risk. Unemployed workers search for a job and receive unemployment insurance benefits, while firms post vacancies in a static search-and-matching framework. Wages are bargained by firms and workers to split the surplus which search-and-matching frictions generate. Second, the model incorporates inter-vivo transfers to match the observed distribution of consumption over the life-cycle. Third, as the pathway to retirement via the disability pension system is quantitatively important in Austria, disability shocks and insurance are included but kept isolated from reforms considered in this paper.
2.10 Calibration
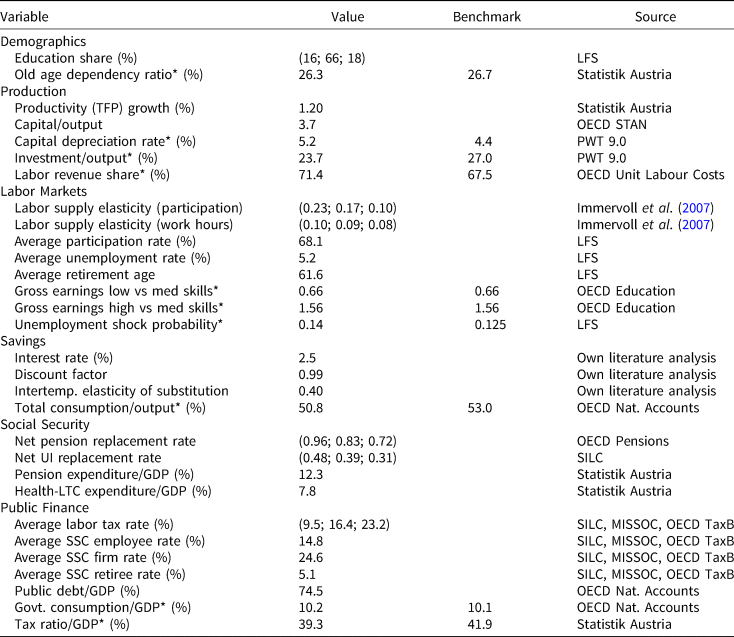
The full scale model is large but its calibration standard. Where available, consensual empirical estimates from the literature are taken. I present the most relevant parts of the calibration.Footnote 14
Interest rate r and discount factor β influence saving behavior directly. I take the baseline values r = 0.025 and β = 0.99 from Keuschnigg et al. (Reference Keuschnigg, Davoine and Schuster2015), which are consistent with the literature. The benefit parameters for pay-as-you-go pensions are chosen to match the pension replacement rate and aggregate pension expenditures. Social security contribution rates are derived from the SILC dataset. Austria does not have capital-funded pensions so the contribution rate into the capital-funded pillar will be defined in hypothetical reform scenarios. The only parameter from the capital-funded pillar that is calibrated are the administrative costs, which I assume amounts to 10% of the real return (ρ F = 0.1 · r). Contributions to the literature on capital-funded pensions which assume a high return for pension funds generate some debates. In comparison, the modeling and calibration choices that I make are conservative. Sensitivity analysis will show that results are similar when other values are considered. To model population aging, I set fertility and age-dependent mortality rates to replicate the age distribution from demographic projections by the Austrian Statistical Office (Statistik Austria).Footnote 15
Production function parameters are chosen to match the observed income shares of each production input, following Jaag (Reference Jaag2009). Conservative values for labor supply elasticities are taken from the empirical literature. Productivity profiles are obtained from Mincer wage regressions on SILC microdata. Average participation rates, unemployment rates and working hours per age and skill classes are computed from LFS and SILC datasets. Further parameters for institutions are derived using the European Commission MISSOC database and OECD's Tax-Benefit model.
Appendix A contains an overview of the resulting calibration values and data sources. It also provides model evaluation information, which follows the approach of other general equilibrium studies in similar contexts.Footnote 16
3. Elementary analysis
To fix ideas and develop intuition, this section provides an elementary analysis of the impact of pension systems on the current account balance. The analysis will also help to explain the simulation results presented in the next section.
Assume that a country has a pure pay-as-you-go system with two pillars and decides to introduce a third, capital-funded pillar. The question is whether the reform increases or decreases the current account balance. I show that the impact is ambiguous in general and provide cases where the reform leads to an increase in total household assets and the current account balance, because a reduction in pay-as-you-go benefits leads to an increase in households' savings.
To avoid notational burden, I assume that there is no public debt, a constant population, no bequest motives, no uncertainty and capital-funded pensions which can be operated without any administrative cost. Post-reform variables are denoted with a star, while skill and life-cycle indices are dropped.
In steady-states of this small open economy, the law of motion (14) for net foreign assets D F = R(D F + CA) gives the current account variation,
 $$\Delta CA = CA^{\ast}-CA = -\displaystyle{r \over {1 + r}}\Delta D^F.$$
By asset market clearing (13) and absence of government debt,
 $$\Delta D^F = \Delta A + \Delta A^F-\Delta V^F.$$
This equation will be key for the analysis of simulation results. It states that net foreign assets will increase if total savings, summing up households' savings and pension fund assets, increase more than domestic firms' value, and vice-versa. The intuition follows from asset market clearing: total savings need to be invested and will be put in foreign firms if domestic firms are too small. In general, the impact of the reform on net foreign assets and the current account balance is ambiguous.
Consider now the following set of reforms. Workers contribute at an arbitrary rate τ F,H, * > 0 to the capital-funded pensions. Their social security contributions rate might or might not be reduced, τ S,H, * ≤ τ S,H , as well as the payouts that pay-as-you-go pensions generate,  $P_0^* + \nu ^*P^{E,*} \le P_0 + \nu P^E$. A reduction in the pay-as-you-go pension benefits may either be the direct result of policy (reducing the contribution and replacement rates) or an indirect general equilibrium outcome. For instance, general equilibrium effects can lead to a drop in wages, which reduces the earnings-related component of pay-as-you-go pensions. The reason for the reduction in benefits is not important for the discussion presented here. Firms also contribute to the capital-funded pensions at a small rate τ F,F,* > 0, and reduce their social security contributions τ S,F, * < τ S,F . An annuity μ*A F,* is perceived by households at retirement after introduction of the third pillar.
Changes in the pension fund contribution rates and in the social security contribution rates have opposite effects on firms' operating surpluses. Given the change in the pension fund rate and to fix ideas in a convenient case, let us consider a reduction in the firms' social security contribution rate τ S,F,* such that firms' dividends in the post-reform equilibrium equal dividends in the pre-reform equilibrium. By the law of motion for firms' value in (10), its steady-state value is V F = χ/(1 − G/(1 + r)). By design of the pension reform, there is no variation in the firms' dividend χ, thus ΔV F = 0. In this specific case, changes in net foreign assets are entirely defined by the changes in total household assets ΔA + ΔA F. The same conclusions will hold if firms' dividends and thus firms' value change to a small extent.
The reform leads to two cases: either it leaves pay-as-you-go pension benefits untouched  $(P_0^* + \nu ^*P^{E,*} = P_0 + \nu P^E)$, or they are reduced
 $(P_0^* + \nu ^*P^{E,*} \lt P_0 + \nu P^E)$. In both cases, the introduction of the third, capital-funded pillar leads to an increase in pension funds, ΔA F > 0. I show that the variation of total financial assets ΔA + ΔA F differs across the two cases. In the first case, the increase in pension fund assets is entirely compensated by a decrease in households' savings:
 $$\Delta A + \Delta A^F = 0.$$
In the second case, the drop in pay-as-you-go pension benefits leads to an increase of total financial assets,
 $$\Delta A + \Delta A^F \gt 0.$$
As a consequence, the set of reforms considered here either leaves net foreign assets and thus the current account balance untouched, or leads to an increase in net foreign assets and thus in the current account balance.
Consider indeed a household J of retirement age a R with life expectancy T. Denote its consumption plan after retirement by {C j,a|a = a R, a R + 1, …, T}. The introduction of the capital-funded pensions leaves the consumption plan untouched,  $C_{j,a}^* = C_{j,a}$. The household indeed only takes consumption decisions and can use variations in savings to maximize its remaining expected lifetime utility, which only depends on consumption; furthermore, the small open economy assumption with a constant interest rate ensures that returns to savings are unchanged. In order to finance its after-retirement consumption, the household needs savings at the start of retirement equal to:
 $$A_j = \mathop {\mathop \sum \nolimits^} \limits_{a = a^R}^T \left( {\displaystyle{1 \over {1 + r}}} \right)^{a-a^R}\lpar {C_{\,j,a}-\lpar {P_0 + \nu P^E} \rpar } \rpar,$$
before the introduction of capital-funded pensions, as there are no bequest motives and no uncertainty. The same household would on the other hand require savings which equal
 $$A_j^{\ast} = \mathop {\mathop \sum \nolimits^} \limits_{a = a^R}^T \left( {\displaystyle{1 \over {1 + r}}} \right)^{a-a^R}\lpar {C_{\,j,a}-\lpar {P_0^{\ast} + \nu^{\ast}P^{E,{\ast}} + \mu^{\ast}A^{F,{\ast}}} \rpar } \rpar,$$
with capital-funded pensions. The need to save for consumption after retirement is simply reduced by the cumulated, net present value of future annuities from the capital-funded pillar. In this case and recalling the absence of administrative costs to operate capital-funded pensions, the pension fund assets for that household equal
 $$A_j^{F,{\ast}} = \mathop {\mathop \sum \nolimits^} \limits_{a = a^R}^T \left( {\displaystyle{1 \over {1 + r}}} \right)^{a-a^R}\mu ^{\ast}A^{F,{\ast}}.$$
Total financial assets after the introduction of the capital-funded pensions thus equal
 $$\eqalign{A_j^{\ast} + A_j^{F,{\ast}} = &\mathop {\mathop \sum \nolimits^} \limits_{a = a^R}^T \left( {\displaystyle{1 \over {1 + r}}} \right)^{a-a^R}\lpar {C_{\,j,a}-\lpar {P_0^{\ast} + \nu^{\ast}P^{E,{\ast}} + \mu^{\ast}A^{F,{\ast}}} \rpar } \rpar + \mathop {\mathop \sum \nolimits^} \limits_{a = a^R}^T \left( {\displaystyle{1 \over {1 + r}}} \right)^{a-a^R}\mu ^{\ast}A^{F,{\ast}} \cr = &\mathop {\mathop \sum \nolimits^} \limits_{a = a^R}^T \left( {\displaystyle{1 \over {1 + r}}} \right)^{a-a^R}\lpar {C_{\,j,a}-\lpar {P_0^{\ast} + \nu^{\ast}P^{E,{\ast}}} \rpar } \rpar.} $$
In the first case, earnings-related pensions remain constant  $(P_0 + \nu P^E = P_0^* + \nu ^*P^{E,*})$, so there is no variation in total financial assets for that household:
 $$\eqalign{A_j^{\ast} + A_j^{F,{\ast}} = &\mathop {\mathop \sum \nolimits^} \limits_{a = a^R}^T \left( {\displaystyle{1 \over {1 + r}}} \right)^{a-a^R}\lpar {C_{\,j,a}-\lpar {P_0^{\ast} + \nu^{\ast}P^{E,{\ast}}} \rpar } \rpar \cr = &\mathop {\mathop \sum \nolimits^} \limits_{a = a^R}^T \left( {\displaystyle{1 \over {1 + r}}} \right)^{a-a^R}\lpar {C_{\,j,a}-\lpar {P_0 + \nu P^E} \rpar } \rpar = A_j} $$
In the second case, total financial assets for that household increase, as earnings-related pensions drop  $(P_0 + \nu P^E \gt P_0^* + \nu ^*P^{E,*})$:
 $$\eqalign{A_j^{\ast} + A_j^{F,{\ast}} = &\mathop {\mathop \sum \nolimits^} \limits_{a = a^R}^T \left( {\displaystyle{1 \over {1 + r}}} \right)^{a-a^R}\lpar {C_{\,j,a}-\lpar {P_0^{\ast} + \nu^{\ast}P^{E,{\ast}}} \rpar } \rpar \cr \gt &\mathop {\mathop \sum \nolimits^} \limits_{a = a^R}^T \left( {\displaystyle{1 \over {1 + r}}} \right)^{a-a^R}\lpar {C_{\,j,a}-\lpar {P_0 + \nu P^E} \rpar } \rpar = A_j} $$
The same takes place for all households, establishing the result at the aggregate level. Intuitively, households simply reduce their own savings by the net present value of annuities when capital-funded pensions leave earnings-related pension payments untouched, to reach the same intertemporal consumption smoothing equilibrium. When capital-funded pensions reduce earnings-related pension payments, households need to compensate for this loss with an additional saving effort, which will impact positively the current account balance.
As the discussion shows, the net impact of a pension reform on foreign assets and the current account balance is, in general, ambiguous. The section however provided realistic cases where the increase of a capital-funded pillar at the expense of pay-as-you-go pillars leads to an increase in net foreign assets, because households need to increase savings to compensate for the reduction in pay-as-you-go pension benefits. That reduction may either be due to policy reforms or to general equilibrium effects, such as a reduction in wages and thus earnings-related pension payouts. Quantitative analyses, in the next section, will consider other realistic cases with fewer parameter restrictions and illustrate the savings effect discussed here.
4. Simulations evidence
To investigate the influence of pension types on current account balances, four scenarios are compared with an aging population. Outcomes over the long run and during the transition are reported and discussed. Sensitivity analyses close the section.
4.1 Scenarios
In the first scenario (labeled PAYG), the current Austrian pension system is left untouched. It is a pure pay-as-you-go system with two pillars. The first pillar, designed to protect from poverty in old age, pays flat benefits unrelated to the working history. The second pillar pays earnings-related benefits. This status quo scenario serves as comparison point.
In the second scenario (labeled CF Small), a third, capital-funded pension pillar is introduced. The existing pay-as-you-go pension pillars remain untouched. For comparison purposes, the contribution rate into the third pillar is identical to the contribution rate in the third scenario, described in the continuation. This scenario allows us to investigate the effect of the capital-funded pillar alone.
In the third scenario (labeled MP Small), the current pension system is reformed and transformed into a full multi-pillar system where the second pillar is shrunk and a third, capital-funded pillar is introduced to deliver identical average benefits. Specifically, the social security contribution rate and benefits from the second pillar are cut 25% and the contribution rate into the third pillar fund is set so that the average total pension benefits per retiree remains the same over the long run. Compared to the first scenario, this scenario shrinks the second pillar and introduces a third pillar. Compared to the second scenario, it only shrinks the second pillar. This scenario corresponds to a realistic transformation of the pension system to include capital-funded components, and will be useful to derive policy implications. Because average pension benefits are identical over the long run, outcomes of this scenario can also be compared in a fair way with the first, status quo scenario.
The fourth scenario (labeled MP Mid) is the same as the third scenario, except that the transformation is larger. Specifically, the contribution rate and benefits from the second pillar are cut 50% and the contribution rate into the third pillar set to keep the average total pension benefits per retiree constant over the long run.
In all these scenarios, the population is aging and age-related social security expenditures vary. Health and long-term care expenditures are kept constant per capita within each age class, and are identical across scenarios. Public pension expenditures vary endogenously, depending on the parameters of the pension system. These expenditures thus differ across scenarios. For instance, reductions in the size of the second, pay-as-you-go pension pillar in the third and fourth scenarios will lead to lower aggregate pay-as-you-go pension expenditures than in the status quo scenario. Furthermore, population aging and pension reforms lead to variations in factor prices in general equilibrium, which impacts revenues from taxation and social security contributions. Consistent with existing macroeconomic analyses, health, long-term care and pay-as-you-go pension expenditures will rise faster than public finance revenue as population ages, generating a social security deficit. In the simulations, I assume that the government reduces its own expenditures through efficiency improvements or scope reduction, in order to finance the social security deficit and keep public debt constant.Footnote 17
4.2 Long run outcomes
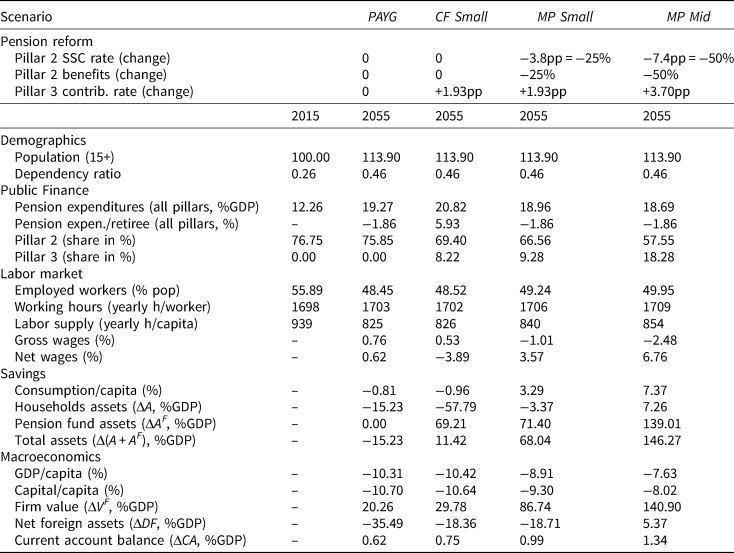
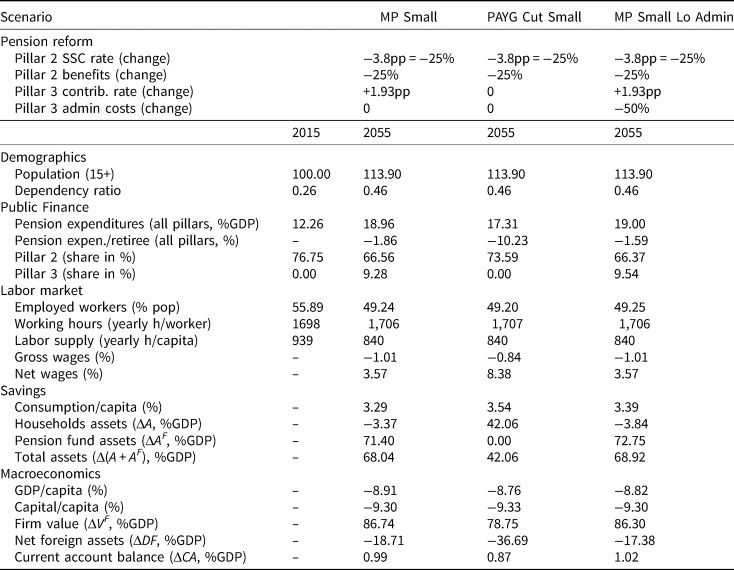
Long run results are provided in Table 1. The table shows the public finance, labor market and macroeconomic impacts for the four scenarios in 2055, four decades after the demographic aging shock has been initiated in the simulations.Footnote 18 The implementation of capital-funded pensions is initially associated with welfare challenges, as current generations may have to pay for currently living retirees and for themselves, as future retirees. As my simulations do not imply new welfare outcomes, I refer to the literature for welfare analyses (see for instance Kotlikoff et al., Reference Kotlikoff, Smetters and Walliser1999; Lassila and Valkonen, Reference Lassila and Valkonen2001; or Makarski et al., Reference Makarski, Hagemejer and Tyrowicz2017).
Long run simulation outcomes, four scenarios

PAYG = current pay-as-you-go pension system; CF Small = introduction of capital-funded pillar 3, same size as MP Small; MP Small = smaller pay-as-you go pillar 2, introduction of capital-funded pillar 3, for same average pension expenditure per retiree; MP Mid = as MP Small, but bigger change; GDP and consumption numbers are deviations from the productivity growth trend.
I start the discussion with overall impacts and then move on to impacts on net foreign assets and the current account balance. Because effects in the scenario with a larger multi-pillar system (MP Mid) are qualitatively the same as in the scenario with the smaller multi-pillar system (MP Small), I focus on the latter scenario and only discuss the former scenario when interesting.
The large drop of the working age population (shown by the increase of the dependency ratio from 0.26 to 0.46) reduces labor supply per capita (from 939 yearly worked hours to 840 or less) and thus production, income and GDP per capita (between −8.9% and −10.4%). This finding is typical in macroeconomic analyses of population aging. Given the earnings-related nature of the second pension pillar, the average pension benefit per retiree drops in the current pure pay-as-you-go system (−1.9%) and, by design of the third scenario, in reformed multi-pillar pensions. As a result of the pension reforms, the third, capital-funded pillars account for 8%, respectively 9% and 18% of pension expenditures in the three scenarios with capital-funded pensions (CF Small, respectively MP Small and MP Mid).Footnote 19
Labor markets impacts depend on the pension system, and will ultimately play a critical role in current account variations. As Section 2 mentions, capital-funded pensions have smaller distortive effects on labor supply than pay-as-you-go pensions, which explains why labor supply per capita is similar to the baseline case after a capital-funded pillar is introduced (826 worked hours per capita in CF Small compared to 825 in PAYG). Differences in distortions also explain why labor supply per capita is higher in the multi-pillar cases (840 worked hours per capita in MP Small instead of 825 in PAYG). Production and GDP per capita thus drop to a similar extent with the introduction of a capital-funded pension pillar (respectively −10.4% in CF Small and −10.3% in PAYG) and less in the multi-pillar case (−8.9% in MP Small instead of −10.3% in PAYG). Wage impacts differ across all three cases. Because labor supply per capita drops over time and social security contribution rates are unchanged in the status quo case, gross and net wages increase to a similar extent (respectively +0.76% and +0.62% in PAYG). Contributions for capital-funded pensions from both firms and workers still lead to an increase in gross wages when capital-funded pensions are introduced, but to a smaller extent, because the newly introduced firms' contributions reduce the value of a job match for the firm (+0.53% in CF Small, instead of +0.76% in PAYG). The new workers' contributions to the third pillar further lead to a drop in net wages (−3.89% in CF Small, instead of +0.62% in PAYG). Effects are different in the multi-pillar reform. The social security contributions which finance the pay-as-you-go pillars are dropped to a large extent and the workers' contributions to the capital-funded pensions are increased to a smaller extent (respectively −3.8 percentage points and +1.9 percentage points in MP Small), because the returns on the third pillar pensions fund are sufficient to lead to the same average pension benefits. This allows firms to lower gross wages, while net wages increase (respectively −1.0% and +3.6% in MP Small).
The relatively large decrease in labor supply per capita leads to a reduction of income and consumption per capita in the status quo case (−0.8% in PAYG), in spite of the (small) increase in net wages. Income and consumption per capita also drop when capital-funded pensions are introduced (−1.0% in CF Small), as the additional income generated by the returns on capital-funded pension savings is insufficient to compensate for the drop in labor supply per capita and net wages. By contrast, income and consumption per capita increase in the multi-pillar case (+3.3% in MP Small), thanks to the large increase in net wages and the positive labor supply incentives that the reduction in social security contributions generates.
Given such large differences in the labor market, it is not a surprise that there are differences in households' savings. The savings effect identified by the elementary analysis in Section 3 plays an important role. Adding up own savings and pension funds, total financial assets change in much different ways across scenarios: while they decline by 15% of GDP in the pure pay-as-you-go case (PAYG), they increase by 11% of GDP when capital-funded pensions are introduced (CF Small) and by 68% of GDP in the small multi-pillar case (MP Small), an outcome which will influence ownership of foreign assets. Labor market impacts drive the differences between the first and the second scenarios. In the second scenario, the introduction of capital-funded pensions leads by design to an increase of pension fund assets (+69% of GDP in CF Small). This allows households to reduce their own savings (−58% of GDP in CF Small). However and as seen above, the introduction of the third pillar also leads to a drop in net wages (−3.9% in CF Small, compared to +0.6% in PAYG). As seen in Section 3, households need to compensate for the loss of net wages, and the concomitant loss of payments from the pay-as-you-go earnings-related pension pillar, by increasing their savings. Households thus reduce their net savings by a smaller extent than the growth of the pension funds (−58% respectively +69% of GDP in CF Small). Total financial assets then increase, relative to the status quo case (+11% of GDP in CF Small, −15% of GDP in PAYG). General equilibrium and labor market effects thus explain why households' own savings in a country without capital-funded pensions are not the same as pension assets in a country with capital-funded pensions. In the multi-pillar case, the need for saving is higher, given the reduction in the second pillar (−3% of GDP in MP Small, compared to −15% of GDP in PAYG). Taking the introduction of the third pillar into account, total financial assets increase most in the multi-pillar case (+68% of GDP in MP Small).
In a small open economy, agents take the constant interest rate as given. Firms therefore adjust their investment decisions to maintain the marginal product of capital. Variations of labor supply, which impact the marginal product of capital, influence variations in investment, production, dividends and thus firms' value. Given the mild increase in labor supply per worker in the pure pay-as-you-go scenario (from 1698 yearly hours to 1703), firms' value only increases mildly (+20% of GDP in PAYG). The increase in labor supply per worker is similar when capital-funded pensions are introduced (1702 yearly hours), but gross wages increase less (+0.53% in CF Small instead of +0.76% in PAYG), which leads to a larger increase in firms' value (+30% of GDP in CF Small). The increase in labor supply per worker is somewhat larger in the multi-pillar scenarios (1706 yearly hours in MP Small), but the cut in social security contributions is sufficient to drop gross wages (−1.0%), both combining to increase dividends and thus firms' value more (+87% of GDP in MP Small).
The variations of total financial assets and firms' value have different consequences for foreign assets and the current account, depending on the pension system. With pure pay-as-you-go pensions, total financial assets drop while the domestic firms' values increase (−15% versus +20% of GDP). The economy thus needs to borrow on international capital markets, which decreases the net holding of foreign assets (by 35% of GDP in PAYG). The need to borrow is smaller with capital-funded pensions and small multi-pillar pensions (net foreign assets decrease by 19% of GDP both in CF Small and in MP Small). When the capital-funded pillar is larger, there is no longer any need to borrow on international capital markets, quite the contrary. In that case, total financial assets increase more than the domestic firms' value (+146% versus +141% of GDP in the MP Mid case), such that households need to invest abroad, increasing net holdings of foreign assets (by 5% of GDP). Variations of the current account balances are consistent, being smaller under pure pay-as-you-go (+0.6% of GDP in PAYG) than with capital-funded and multi-pillar pensions (respectively +0.8% of GDP in CF Small, +1.0% of GDP in MP Small and +1.3% of GDP in MP Mid).
The following summarizes the discussion:
Finding 1: The impact of population aging on foreign assets depends on the pension system. Net holdings of foreign assets after four decades: decrease by 35% of GDP with a pure pay-as-you-go pension system; decrease by 19% of GDP with the implementation of a capital-funded pension pillar which accounts for 8% of total pension expenditures; decrease by 19% of GDP with the implementation of a multi-pillar pension system which reduces pay-as-you-go pensions, delivers the same average pension benefits as the pure pay-as-you-go pensions and where capital-funded pensions account for 9% of pension expenditures; increase by 5% of GDP with the implementation of a multi-pillar pension system which reduces pay-as-you-go pensions, delivers the same average pension benefits as the pure pay-as-you-go pensions and where capital-funded pensions account for 18% of pension expenditures.
Note first that the foreign assets differentials are driven by the introduction of the capital-funded pension pillar, not by the reduction in the size of pay-as-you-go pension pillars. Indeed, there is a differential even when pay-as-you-go pillars are left untouched (CF Small versus PAYG scenarios). Note then that the foreign assets differential between the MP Small and PAYG scenario is 16 percentage points of GDP, while it is 40 percentage points of GDP between the MP Mid and PAYG scenario. As the capital-funded pillar is twice as large in the MP Mid case as in the MP Small case, effects on net foreign assets are thus slightly more than proportionate. Note finally that the simulations illustrate the difference between households' own savings and capital-funded pensions (PAYG versus CF Small scenarios). Because of labor market and general equilibrium effects, one cannot interpret households' savings as capital-funded pensions, motivating the use of a model with explicit modeling of capital-funded pensions.
4.3 Transition path outcomes
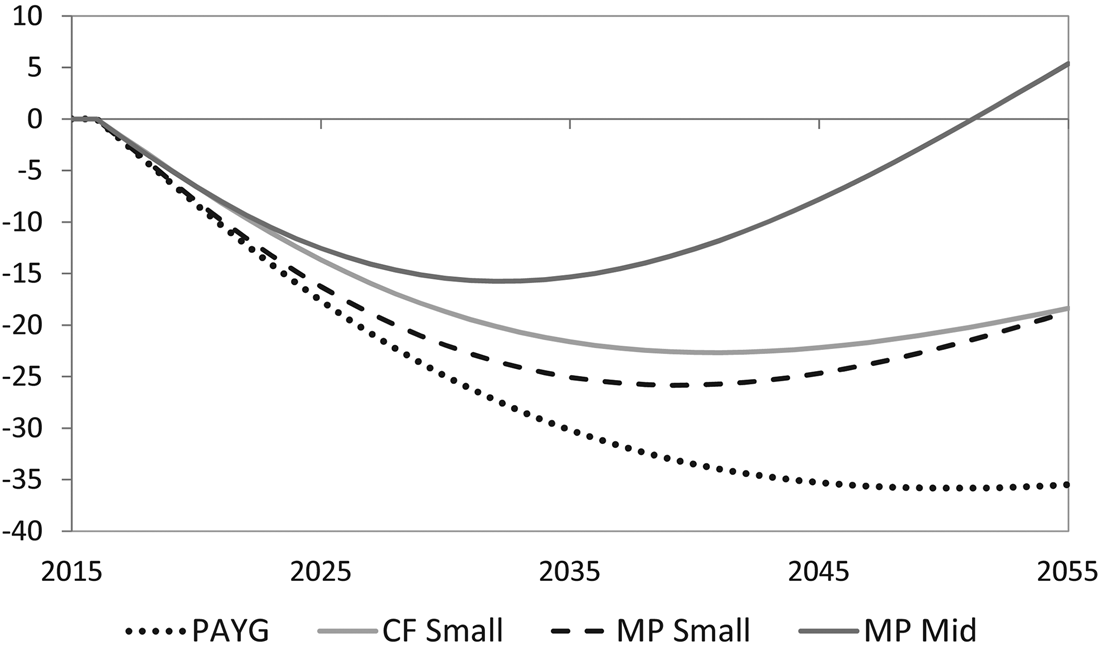
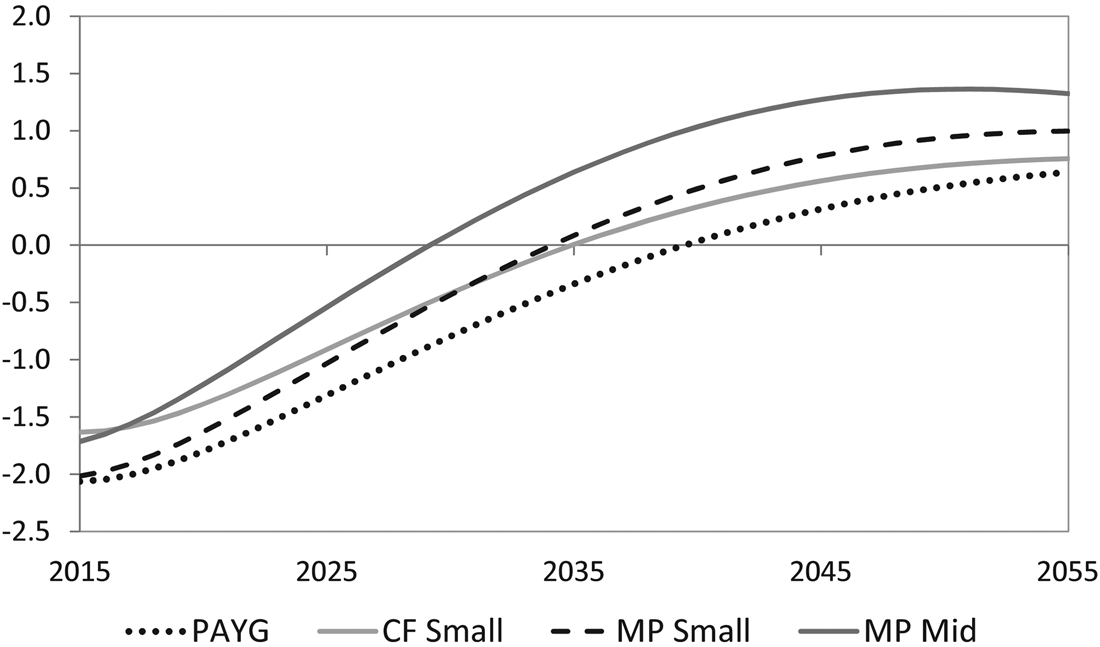
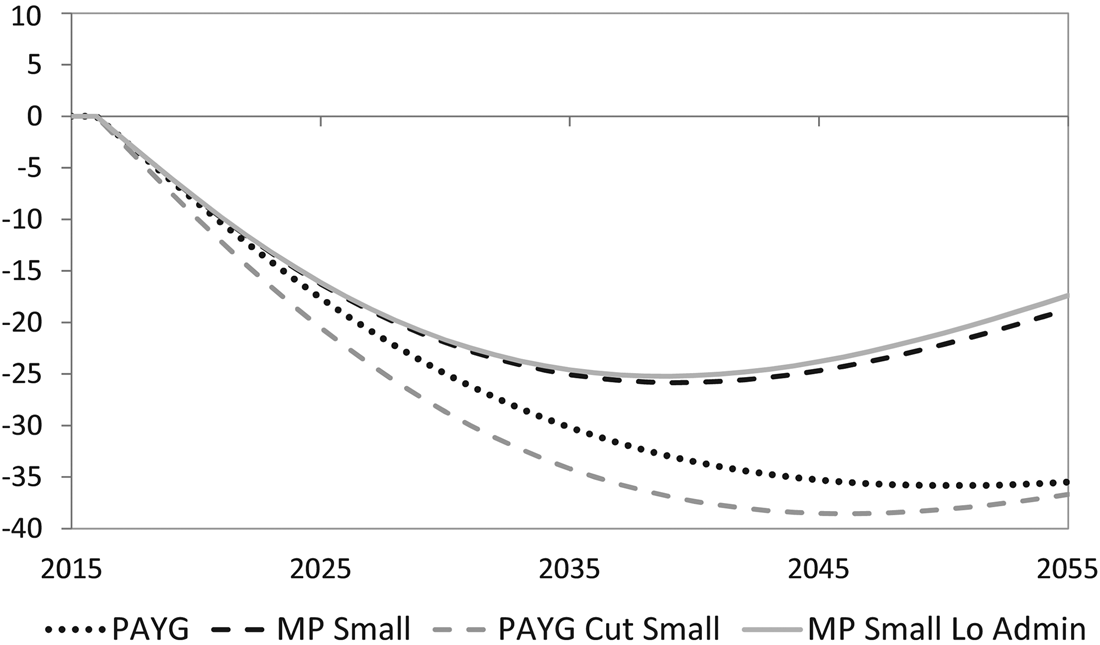
Figure 2 provides the simulated transition paths for net foreign assets in the four scenarios and Figure 3 the simulated paths for the current account balance.
Simulated changes in net foreign assets (% points of GDP), four scenarios.

Simulated changes in the current account balance (% points of GDP), four scenarios.

As discussed above and summarized in finding 1, the long run holdings of net foreign assets depend on the characteristics of the pension system. In general, the larger the capital-funded pillar, the larger the net foreign assets holdings. Figure 2 shows how changes in net foreign assets evolve over time.
To have comparable economies with households and firms having the same behavior in the same circumstances, all four scenarios start from the same initial steady state (2015), where the pension system has only pay-as-you-go components. The three scenarios with capital-funded pensions (CF Small, MP Small and MP Mid) correspond to reforms initiated in the initial steady state, which create a third, capital-funded pillar. The pension fund for this pillar is thus initially empty and builds up over time, as contributions accumulate. This explains why net foreign assets initially follow similar paths, driven by population aging. As the third pillar pension fund grows, net foreign assets diverge across scenarios, following the mechanism behind finding 1.
The paths for the current account balances, displayed in Figure 3, follow a more monotonic development than the paths for net foreign assets over the first four decades. Net foreign assets differences between pure pay-as-you-go pensions and systems with capital-funded pensions indeed grow regularly over time, while current account differences remain stable over the first four decades. The only exception is the current account balance in the scenario where capital-funded pensions are introduced without reforming pay-as-you-go pillars (CF Small), which is initially higher. This effect comes from the smaller impact on labor supply incentives, requiring less initial borrowing on international capital markets. As net foreign assets is a stock variable and the current account balance is a flow variable, the paths in Figure 2 start from the origin but not those in Figure 3. Again the mechanism which explains finding 1 drives outcomes in Figure 3.
As expected, current account differences between pure pay-as-you-go and multi-pillar pensions increase with the size of the third, capital-funded pensions. Over the first three decades, differences are slightly overproportional. Indeed, the current account difference after 20 years is 0.4 percentage points of GDP between the pay-as-you-go scenario and the multi-pillar scenario where capital-funded pensions account for 9% of pension expenditures (MP Small versus PAYG scenarios). That difference reaches 1.0 percentage point of GDP between pay-as-you-go pensions and multi-pillars with 18% of expenditures in the capital-funded part (MP Mid versus PAYG scenarios).
Summing up:
Finding 2: The evolution of current account balances depends on the pension system. Relative to the case of pure pay-as-you-go pensions, the current account balance in 20 years is: 0.4 percentage points of GDP larger if a capital-funded pension component is introduced and accounts for 8% of pension expenditures; 0.4 percentage points of GDP larger with a multi-pillar pension system which reduces pay-as-you-go pensions while delivering the same average pension benefits and where capital-funded pensions account for 9% of pension expenditures; 1.0 percentage points of GDP larger with a multi-pillar pension system which reduces pay-as-you-go pensions while delivering the same average pension benefits and where capital-funded pensions account for 18% of pension expenditures.
4.4 Sensitivity analysis
Two cases are considered and summarized here, to confirm the robustness of the findings and the methodological approach. Appendix B contains the details.
In the first case, lower administration costs are considered for capital-funded pensions, increasing the net returns on pension funds. Bikker and De Dreu (Reference Bikker and De Dreu2009) note large differences in administration costs across pension fund operators and across countries. As expected, pension fund assets are slightly larger, and the domestic firms' values nearly identical. Overall, the impact on net foreign assets and current account balances is almost identical to the baseline case.
The second case is an intermediate case between the pure pay-as-you-go and the multi-pillar cases: the size of the second, pay-as-you-go pillar is shrunk so that it has the same size as in the multi-pillar case; however and unlike the multi-pillar case, that shrunk pillar is not replaced by a capital-funded pillar. Specifically, the social security contribution rate and benefits from the second pillar are cut 25%, as in the MP Small case, but there is still no contribution to a third pillar. Overall, this new case simply implements a smaller, pure pay-as-you-go pension system. One thus expects households to compensate with an increase of their own savings.
As expected, average pension benefits are drastically reduced (−10.2% instead of −1.9%). To finance consumption after retirement, households increase savings (+42% of GDP instead of −15% of GDP in the pay-as-you-go case and −3% of GDP in the multi-pillar case). Taking pension fund assets into account however, total financial assets increase less than in the multi-pillar case (+42% instead of +68% of GDP). The need to invest abroad is thus smaller. Net holdings of foreign assets are thus visibly smaller than in the multi-pillar case (−37% instead of −19% of GDP), and the impact on the current account balance slightly different (+0.9% instead of +1.0% of GDP).
5. Cross-country evidence
This section confronts theoretical outcomes from the previous section with empirical evidence. It builds on the illustration provided in Figure 1 and the empirical analysis performed by Eugeni (Reference Eugeni2015). As pension systems are more complete in rich countries and I consider various types of pension systems, I focus the analysis on rich countries. To be able to compare outcomes and to apply her analysis to subsamples, I follow Eugeni (Reference Eugeni2015) as closely as possible.Footnote 20 The section also illustrates the benefit of separating pension systems by types. I show indeed that current account differences across rich countries cannot be empirically explained by the presence of public pensions alone. A partial empirical explanation is however provided when one differentiates by pension types.
Eugeni (Reference Eugeni2015) provides cross-section evidence using a worldwide sample of 98 countries with pay-as-you-go pensions and shows that the current account balance is negatively impacted by the pay-as-you-go coverage rate.Footnote 21 Intuitively, the larger the fraction of the population which receives transfers from younger generations after retirement, the lower the need for the population to save for consumption after retirement, the lower the national savings and the current account balance.
As I show below however, this finding no longer holds when restricting the sample to rich countries, which begs the question of the influence of pension systems on current accounts in rich countries. Figure 1 and the results from Section 4 offer a hint: the impact depends on the type of the pension system. Ceteris paribus, private capital-funded pensions indeed increase national savings and the current account balance, while public pay-as-you-go pensions do the opposite.
I thus perform the same empirical analysis as Eugeni (Reference Eugeni2015) but change the pension variables and focus on a subsample of rich countries. Because of data availability, my analysis is restricted to OECD countries. A country is considered rich (or high income) if its GDP per capita is no smaller than the lowest GDP per capita among OECD European countries.
Because I rely on several dimensions of the pension system and to define explicitly key concepts of the empirical analysis, I start with definitions. As Eugeni (Reference Eugeni2015), I rely on the absorption approach of the current account balance, which is defined as the difference between national savings and domestic investments.Footnote 22 As pension systems are multidimensional, they are characterized by several measures. The coverage rate and the replacement rate are the two most important in this study.Footnote 23 The coverage rate can either be measured as the fraction of active contributors to the pension system over the labor force, or as fraction of active contributors over the working age population. The replacement rate is measured as the ratio of the gross pension payments over the gross pre-retirement earnings.
The main change I perform, compared to Eugeni (Reference Eugeni2015), is a replacement of the public pension coverage rate variable by two pension variables, the product of the private pension coverage rate with the private pension replacement rate and the product of the public pension coverage rate with the public pension replacement rate. The reasons for such products are first that coverage rates vary little across OECD countries and second that the need to save for retirement is larger if the pension replacement rate is low.Footnote 24 Given differences in saving behavior across income classes, I also add two variables which compare replacement rates for average earners and for low earners, namely the ratio of the replacement rate for average earners over the replacement rate for low earners, once for private pensions and once for public pensions. To ease interpretation and allow for a comparison with the simulation findings of Section 4, I assume that private pensions are capital-funded and that public pensions are pay-as-you-go. Alternative specifications are considered in Appendix C and lead to similar outcomes, but lose statistical significance.
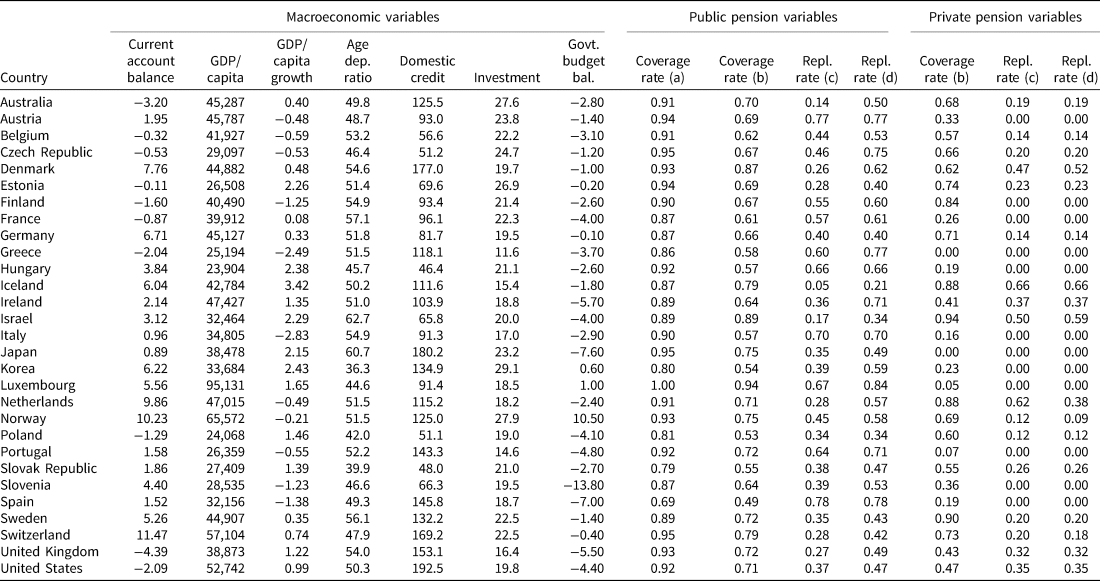
The same data definitions and data sources are used as Eugeni (Reference Eugeni2015) for all common variables. For new variables, data come from the OECD. The base year for the analysis is 2013. Details on data definitions and sources are provided in Appendix D.
The empirical analysis of Eugeni (Reference Eugeni2015) is an ordinary least squares (OLS) regression of the form
 $${\rm current\; accoun}{\rm t}_i = \alpha + \beta {\rm \; public\; coverage\; rat}{\rm e}_i + \gamma \cdot X_i + \varepsilon _i$$
where X is a vector of control variables, which consists of GDP per capita, GDP per capita growth, the age dependency ratio, domestic credit, investment and the government budget balance. GDP per capita and GDP per capita growth are included because one expects richer or faster developing countries to have a more comprehensive public pension system. Omitting these two variables can bias the results. One also controls for the age dependency ratio, because the proportion of older households can influence the need to save for retirement, and thus national savings and the current account balance. Domestic credit and investment are included as a proxy for financial market development, which the literature has shown can influence international capital flows. The empirical literature has also provided some support for the twin deficit hypothesis, a causal link between government budget deficits and trade deficits, which motivates the inclusion of the government budget balance among control variables.
The modification I perform consist in an OLS regression of the form
 $$\matrix{ {{\rm current\; accoun}{\rm t}_i = & \alpha + \beta _1{\rm \; private\; coverage\; rat}{\rm e}_i \times {\rm private\; replacement\; rat}{\rm e}_i} & \cr {\qquad \qquad\qquad\;\, + \,\beta _2{\rm \; public\; coverage\; rat}{\rm e}_i \times {\rm public\; replacement\; rat}{\rm e}_i} \cr {& \!\quad+ \,\beta _3{\rm \; private\; replacement\; rate\; avg/lo}{\rm w}_i} \cr {&\!\!\!\quad +\, \beta _4{\rm \; public\; replacement\; rate\; avg/lo}{\rm w}_i} \cr {& \hskip -8.2pc + \, \gamma \cdot X_i + \varepsilon _i} } $$
where the vector of controls X is identical to the one in (16).
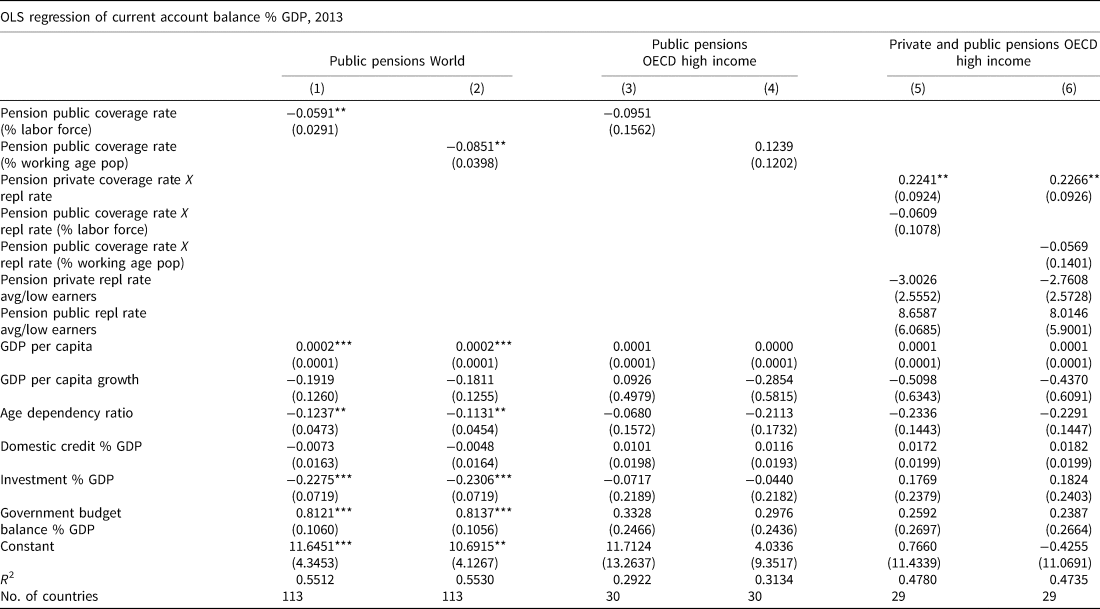
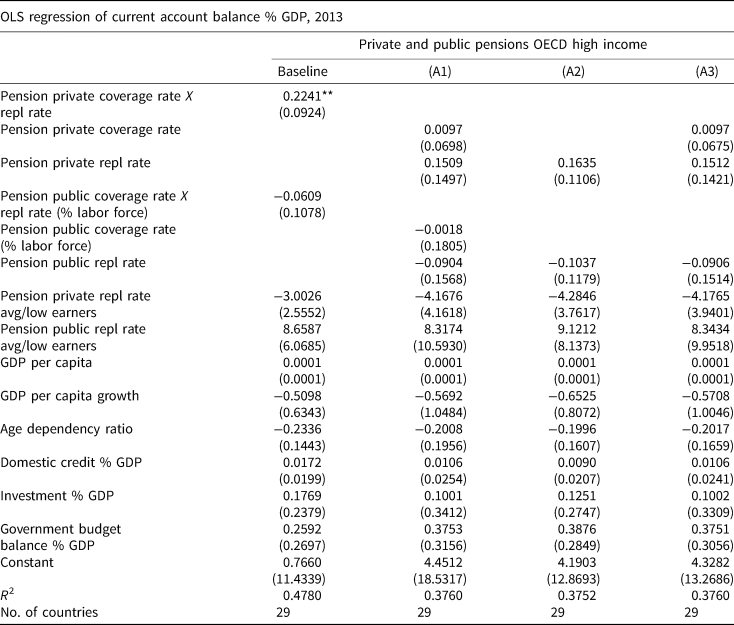
Table 2 provides the results for the various regressions. The first two columns provide the estimates for the regression defined by (16) and replicate the analysis of Eugeni (Reference Eugeni2015). Because the World Bank provides two measures of public pension coverage rates (total number of active contributors as a percentage of the labor force or as a percentage of the working age population), one regression is performed for each measure. Columns (3) and (4) restrict these regressions to the subsample of OECD high-income countries. Columns (5) and (6) provide the results for the modified regression defined by (17), again for each measure of the public pension coverage rate.
Cross-section evidence on current account determinants

Notes: Standard errors are reported in parenthesis; *** indicates significance at the 1% level, ** at the 5% level and * at the 10% level. Columns (1) and (2) replicate the Eugeni (Reference Eugeni2015) analysis for the year 2013 (‘PAYGO’ cases, Tables 4 and 5). ‘OECD High Income’ includes OECD countries with GDP/capita at least as high as the smallest value for OECD European countries. Latvia is included in columns (3) and (4) but not (5) and (6) because replacement rate data are missing.
Outcomes in columns (1) and (2) are very close to those from Eugeni (Reference Eugeni2015). The small differences can be explained by sample sizes and reference years.Footnote 25
Outcomes in columns (3) and (4) show that the empirical finding from Eugeni (Reference Eugeni2015) no longer holds when the regression is restricted to OECD high-income countries: none of the coefficients, in particular pension variables, are statistically significant anymore; in one case, the sign of the pension variable changes.
Outcomes in columns (5) and (6) provide the main novel empirical results of this paper. Unlike the restriction of the Eugeni (Reference Eugeni2015) analysis to rich countries, they show that pension arrangements can explain part of the current account differences. In particular, the regressions show that countries with higher coverage and replacement rates of private pensions have a larger current account balance, ceteris paribus. The corresponding coefficients are statistically significant at the 5% level. This outcome confirms the positive slope observation made on the left part of Figure 1. The signs of the coefficients for the coverage and replacement rates of public pensions are consistent with the negative slope observation applicable to the right part of Figure 1, but the coefficients are not statistically significant.
Summing up:
Finding 3: Differences in pay-as-you-go pension coverage rates explain part of the current account differences between countries from all around the world (the higher the coverage rate, the lower the current account balance), except when the sample is restricted to OECD high-income countries. Differences in the product of the coverage rate with the average replacement rate of private pensions, on the other hand, explain part of the current account differences between OECD high-income countries (the higher the private coverage and replacement rates, the higher the current account balance). All outcomes hold at the 5% statistical significance level.
These new regression results are qualitatively consistent with the empirical illustration provided in Figure 1 as well as simulation results from Section 4, under the assumption that private pensions are capital-funded and public pensions are pay-as-you-go. As noted in finding 2 indeed, capital-funded pension pillars lead to higher current account balances in the first four decades, with larger capital-funded pillars leading to higher current account balances. This theoretical prediction is qualitatively consistent with the empirical finding 3. Quantitative outcomes from the simulations (finding 2) and from the empirical analysis (finding 3) are discussed in the continuation.
6. Discussion
I compare first simulation and empirical results. I then discuss the economic significance of the results and derive policy implications. A comparison with results from the related literature closes the section.Footnote 26
6.1 Comparison of simulation and empirical results
I compare quantitative outcomes of the simulations, as summarized in finding 2, and those of the empirical analysis, as summarized in finding 3. The simulation generates counterfactual outcomes for the same country, while the empirical analysis uses actual outcomes for several countries. Quantitatively, the simulation findings and the empirical findings can thus not be compared directly. To relate the findings nonetheless, I discuss the particular cases of Austria and Germany, two countries similar in many respects: language, history, labor markets, political and economic institutions. I then extend the discussion to Switzerland, as first robustness test. I finish with another robustness test.
The Austrian and German pension systems were similar until the start of the millennium, both public pay-as-you-go systems providing generous benefits. Through reforms in 2001 and 2004, Germany then reduced the size of its public system and introduced a private capital-funded pillar. As shown in Table 7 of Appendix D, the public pension replacement rate is now almost 50% smaller in Germany than in Austria, at 40% compared to 77%. One can thus interpret the actual German reform as the simulation reform MP Mid, which reduces the public pension benefits by 50% (see Table 1). If Austria had implemented the same pension reform at the same time, 15 years ago, the simulation would predict a current account balance which would be 1.0 percentage point of GDP higher (see Figure 3). Turning to empirical estimates, the coverage rate of the private capital-funded pillar in Germany is 71% and the average replacement rate 14%, as shown in Table 7. If Austria had implemented a similar pension pillar, it may have the same private coverage and replacement rate values today. Multiplied by the 0.2241 coefficient from Table 2, the empirical analysis predicts an impact of such a counterfactual private pension pillar of 2.2 percentage points of GDP on the current account balance.Footnote 27 This figure is more than twice the value predicted by the simulation but shows that simulation and empirical estimates are of comparable magnitude, at least in the special case discussed here.
The Swiss pension system, in contrast to the Austrian and German systems, has a multi-pillar nature with a significant capital-funded component. As noted during the simulations, a multi-pillar of the MP Mid type remains of moderate size, two to three times smaller than in countries like Switzerland (see footnote 19). The simulation in the MP Mid case predicts an increase of the current account balance of 1.0 percentage point of GDP over the medium run. Given linear effects, simulations thus suggest that the introduction of a Swiss-like multi-pillar system in Austria would increase the current account balance by 2.0 to 3.0 percentage points of GDP. Using empirical estimates with private coverage and replacement rate values from Switzerland (respectively 73% and 20%), the empirical analysis predicts that the introduction of a private pension pillar with Swiss-like characteristics would increase the Austrian current account balance by 3.3 percentage points of GDP. Simulation and empirical estimates are again comparable.
Ideally, empirical and simulation results should be compared in independent ceteris paribus circumstances, where only one pension parameter is changed. Because Austria does not have capital-funded pensions however, there is no data on private capital-funded pension coverage and replacement rates. Independent estimates of the impact of capital-funded pensions in Austria can thus not be produced from the empirical analysis. As a final robustness test, I use coverage and replacement rates from simulations and compare the resulting empirical estimates with simulation results. Over the long run, the replacement rate for capital-funded pensions averages 7% in the ceteris paribus simulation scenario CF Small, which introduces capital-funded pensions but leaves pay-as-you-go pensions untouched. As capital-funded pensions are mandatory in my model, the coverage rate would correspond to the labor market participation rate, equal to 67%. Using these two rates and the 0.2241 coefficient from Table 2, the empirical analysis predicts an increase of 1.0 percentage point of GDP of the current account balance, ceteris paribus. By comparison, the simulations predict an increase of the current account balance of 0.4 percentage points of GDP, 20 years after the introduction of the capital-funded pensions (see CF Small case in Figure 3). The relative difference between these simulation and empirical estimates is similar to the relative difference mentioned above, which I take as evidence of robustness.
6.2 Economic significance
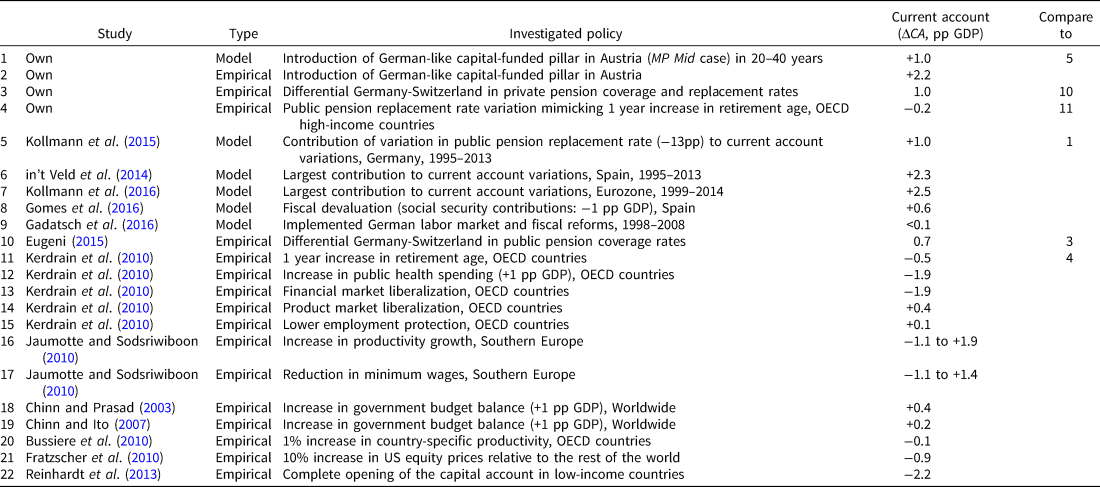
According to my simulations, introducing capital-funded pensions comparable to Germany into the Austrian pay-as-you-go system would increase the Austrian current account balance by 1.0 percentage point of GDP 15 years later (MP Mid reform, as noted above). By comparison, the Austrian current account balance averaged 1.8% of GDP between 2011 and 2016. The impact of capital-funded pensions on the current account can thus be significant.
Because Austria does not have capital-funded pensions, the comparison does not allow quantification of the contribution of capital-funded pensions to actual current account imbalances. Germany, on the other hand, implemented capital-funded pensions 15 years ago. As discussed above, similarities between Austria and Germany suggest that my simulation findings, produced with a model calibrated for Austria, also apply to Germany. Specifically, the introduction of a medium-sized capital-funded pillar (MP Mid reform case) in the model appears similar to the actual implementation of capital-funded pensions in Germany since 2001. Between 2011 and 2016, the German current account surplus averaged 7.4% of GDP. My simulations suggest that, from these 7.4% of GDP, 1.0% of GDP is due to the introduction of capital-funded pensions, a limited but notable contribution.
6.3 Policy implications
Even if a current account imbalance is not a problem per se, it can still signal current problems or future risks; the current account balance thus constitutes a useful policy indicator (Milesi-Ferretti and Blanchard, Reference Milesi-Ferretti and Blanchard2009; Obstfeld, Reference Obstfeld2012). Understanding influences on the current account helps to interpret its balance and to define corrective measures. It can also help to define monitoring indicators, as I discuss in the continuation.
As noted by Obstfeld (Reference Obstfeld2012) and others, extreme current account balance values can serve as indicator of upcoming economic crises. Figure 4 provides an illustration for the Eurozone. Prior to the 2007 subprime crisis, the cumulated current account deficit of the three largest importers from the Eurozone at that time, Greece, Portugal and Spain, was growing steadily. After the crisis broke, their combined GDP per capita dropped by 12% until 2013, while their combined public debt more than doubled, rising from 58% to 121% of GDP. By comparison, GDP per capita grew at a smaller but sustained rate after the crisis in the three largest exporters of the Eurozone, Austria, Germany and the Netherlands, and their public debt increased to a smaller extent.
Macroeconomic indicators, three largest exporters and importers, Eurozone.

Taking note of the scientific and policy debates, economic policy has been adjusted to use current account information. In the European Union for instance, the Macroeconomic Imbalance Procedure (MIP) gives the European Commission a mandate for monitoring national macroeconomic developments and, when needed, making policy recommendations. The MIP relies on a set of 14 macroeconomic indicators. One of these indicators is the current account balance. Averaged over the past 3 years, the current account measure can further be corrected for intra-EU government transfers (so-called Structural Funds). A warning signal is issued when the balance is either above 6% or below −4% of GDP (European Commission, 2012).
Short-run stability is the target of such macroeconomic prudential policy. Long-run trends can however affect the current account, and thus blur the signal that the current account balance sends for stabilization purposes. Past research has shown that cross-country differences in population aging impact the current account balance (e.g., Boersch-Supan et al., Reference Boersch-Supan, Ludwig and Winter2006; Chinn and Ito, Reference Chinn and Ito2007). So do differences in the coverage of pay-as-you-go pension systems (Eugeni, Reference Eugeni2015). My results show that the size of capital-funded pension pillars also influence the current account balance. Specifically, growing capital-funded pensions lead to higher current account balances. Ceteris paribus, policy makers should thus worry less about a growing trade deficit if the country has a pure pay-as-you-go pension system than if the country has growing capital-funded pensions.
The MIP, as an application, should not only be adjusted for intra-EU government transfers but also for the size of capital-funded pensions. According to the MIP, a warning signal should have been issued for Germany every year since the launch of the MIP, in 2011, as its current account surpluses exceeded the 6% of GDP threshold. Even before the introduction of the MIP, a number of policy makers have been requesting policy actions from Germany, in order for German domestic demand and thus German imports to be strengthened (for a presentation of the colorful debate, see Kollmann et al., Reference Kollmann, Ratto, Roeger, in't Veld and Vogel2015). My analysis shows that part of the rise in the German current account surplus can be attributed to its pension system. Germany indeed reformed its system 15 years ago, reducing the size of its pay-as-you-go pillar and promoting capital-funded pensions. As noted earlier, my simulations suggest that this reform increased the German current account balance by 1 percentage point of GDP, as of today. With the pension correction that I recommend for the MIP, no signal would have been issued in 2011, 2012 and 2013.Footnote 28
6.4 Comparison with literature results
To further assess the plausibility of my simulation and empirical results, I compare them with the related macroeconomic and empirical literature.
Table 3 provides an overview of the comparison. The upper part of the table contains my simulation and empirical results in a format fit for comparisons, the middle part has results from published model-based analyses and the bottom part results from the empirical literature.
Comparison with relevant literature results

Notes: pp GDP = percentage points of GDP; the last column indicates to which study the result can be directly compared (when it exists).
As the table shows, there are only a few studies which investigate the impact of pensions on the current account. These are however easiest to compare to my analysis, which focuses on pension impacts. The correspondence between these comparable studies is provided in the last column of the table. The other cases offer perspective and assessment information.
I discuss here the cases which focus on pensions and refer to Appendix E for details and the other cases.
As mentioned earlier in Section 6, similarities between Austria and Germany suggest that simulation findings for Austria would also apply for Germany (MP Mid reform). My simulations predict a 1.0 percentage point of GDP increase of the current account balance decades after the introduction of a capital-funded pension pillar, as was done by Germany in 2001 (case 1 in Table 3). Kollmann et al. (Reference Kollmann, Ratto, Roeger, in't Veld and Vogel2015) find that the drop in the public pension replacement rate (−13 percentage points) accounts for a 1.0 percentage point of GDP increase of the German current account surplus between 1995 and 2013 (case 5). Numbers coincide.
The analysis by Eugeni (Reference Eugeni2015) implies that the public coverage rate differential between Germany and Switzerland would generate a current account differential of 0.7 percentage points of GDP (case 10 in Table 3). According to my empirical analysis, the private coverage and replacement rate differential between these two countries would generate a current account differential of 1.0 percentage point of GDP (case 3). Figures are comparable.
Kerdrain et al. (Reference Kerdrain, Koske and Wanner2010) find that an increase of the retirement age by 1 year reduces on average the current account by 0.5 percentage points of GDP in OECD countries (case 11). I use a simple ceteris paribus translation between retirement and replacement rates in my framework to allow for a comparison. My empirical analysis then predicts a decrease of the current account of 0.2 percentage points of GDP (case 4). Although my estimates are not statistically significant in this case, current account impacts have comparable magnitudes.
Overall, my quantitative estimates fall in line with existing literature estimates, in spite of differences in methodologies and geographical coverages.
7. Concluding remarks
The current account balance is a frequently used indicator in the policy debate. Cross-country differences remain however difficult to explain. Previous research showed that the coverage rate of pay-as-you-go pension systems influences the current account balance: the larger the rate, the lower the current account. This finding does however not apply to rich OECD countries. For these countries, I empirically show that the coverage and replacement rates of capital-funded pensions influence the current account balance: the larger the rates, the larger the current account.
Simulations for Austria with a large-scale overlapping-generations model further show that the introduction of a multi-pillar system where the capital-funded part accounts for 18% of pension expenditures would lead in 20 years to a current account balance which is 1 percentage point of GDP higher than with the current pure pay-as-you-go system. The average current account balance of Austria, reaching 1.8% of GDP between 2011 and 2016, puts this finding in perspective.
Policy implications are in line with conclusions from previous research on institutional influences of the current account. The nature of the pension system can alone change the balance of the current account. Ceteris paribus, policy makers should worry less about a growing trade deficit if the country has a pure pay-as-you-go pension system than if the country has growing capital-funded pensions.
There are for instance current account differences even among countries as similar as European countries. These differences have been thoroughly debated as the Eurozone crisis unfolded and taken sometimes as evidence that some countries have lost their competitive edge. Pension arrangements however differ. Beyond competitiveness factors and domestic demand, pension systems may partially explain such phenomenon as the large current account surpluses from exporting champions Germany and the Netherlands, who have sizable capital-funded pensions. The current account balance indicator from the EU MIP should not only be corrected for intra-EU government transfers, but also for the size of capital-funded pensions. Based on my simulation estimates, no warning signal should have been emitted for Germany in 2011, 2012 and 2013 and no signal for the Netherlands in 2015.
The focus of the empirical analysis presented here are OECD high-income countries. It would be interesting to extend this analysis to a larger sample of countries in future research, once data on pension replacement rates is provided for a larger set of countries.
Acknowledgements
I thank Helmut Hofer, Iain Paterson, Philip Schuster, two anonymous referees and the editor for comments. Partial funding by the Oesterreichische Nationalbank (Anniversary Fund Project Number 15480) is gratefully acknowledged.
Appendix A
Calibration values, sources and outcomes
Table 4 provides calibration values for the main parameters, as well as data sources and calibration outcomes. Variables whose values are not calibrated but an outcome of the calibration process are indicated with a star. These variables are compared with benchmark values, which allows evaluation of the model and calibration performance.
Calibration values and outcomes

The table also provides the sources for the calibrated variables as well as the benchmarking information. The model is calibrated and benchmarked to values averaged between 2010 and 2015, to remove business cycle fluctuations. Data sources consist of national statistics, results from empirical analyses, household-level surveys, outcomes of tax-benefit models and standardized descriptions of social security systems.
National statistics are taken from the Austrian statistical office (Statistik Austria), the OECD (Annual National Accounts) and the Penn World Table (Version 9.0).
Results from empirical analyses include scientific estimates of labor supply elasticities (summarized in Immervoll et al., Reference Immervoll, Kleven, Kreiner and Saez2007), estimates of capital stocks (from the OECD Structural Analysis database, or STAN), estimates of labor income shares (from the OECD Unit Labour Costs database), estimates of relative earnings by education group (from the OECD Education at a Glance publication) and estimates of pension replacement rates (from the OECD Pensions at a Glance publication).
Household-level surveys consist of the European Union Labour Force Survey (LFS) and the European Union Statistics on Income and Living Conditions (SILC). The LFS consolidates standardized information collected by national statistical offices on labor market activity for representative households. The model is calibrated to match average labor market activity by life-cycle and skill group, as well as the skill distribution. The SILC also consolidates information collected by national statistical offices, but on income, poverty, social exclusion and living conditions. In combination with the OECD Tax-Benefit model and the MISSOC database (see below), it is used to calibrate social security benefits and tax rates in the model. Specifically, social security benefits, labor taxes and social security contributions are defined to match averages by life-cycle and skill groups computed from the SILC, the OECD tax-benefit model and the MISSOC database. The SILC data also enable the computation of productivity profiles in the model, using Mincer regressions.
The OECD Tax-Benefit model, which provides tax and social security information for representative family circumstances in OECD countries, is used to impute missing benefits and tax information from the SILC. Finally, the Mutual Information System on Social Protection, or MISSOC database, is co-administrated by the European Commission and consolidates information on social protection in the European Union.
Appendix B
Sensitivity analysis for simulations
This appendix provides additional details on the simulation results for the sensitivity analysis cases defined in Section 4, all compared to the multi-pillar MP Small case. The first case (labeled MP Small Lo Admin) is the same except for administration costs of the capital-funded pillar. These costs are assumed to be 50% smaller than in the MP Small case, which increases the net returns from the pension fund. The second case (labeled PAYG Cut Small) applies the reduction of the second, pay-as-you-go pillar from the MP Small case but not its introduction of a third, capital-funded pillar.
Table 5 provides the long-run outcomes for the two new cases and, for ease of comparison, the benchmark multi-pillar scenario. Figure 5 provides the simulated transition path for net foreign assets in the three cases. Values for the current pure pay-as-you-go pension system are also included to ease the discussion (PAYG label).
Long run simulation outcomes, sensitivity analysis

Simulated changes in net foreign assets (% points of GDP), sensitivity analysis.

Both the table and figure show that outcomes with smaller administration costs (MP Small Lo Admin) are very close to the benchmark multi-pillar case (MP Small). The higher net returns on pension funds lead to a slightly higher value of pension assets, but not enough to change the need for investing abroad and thus net foreign assets and current account balances. One reason is that the higher returns on the pension funds increase the average pension benefit, so households reduce their own savings. Total financial assets and the need to invest abroad are thus barely changed.
The table and figure also show that net foreign assets outcomes for the shrunk, pure pay-as-you-go case (PAYG Cut Small) are much closer to those of the current pay-as-you-go case (PAYG) than the benchmark multi-pillar case (MP Small). In the shrunk pay-as-you-go case, households compensate for the pension benefits loss with higher savings. Accumulated total financial assets are however larger in the multi-pillar case, leading to a larger need to invest abroad and thus to larger net foreign assets holdings. These outcomes thus also show that one cannot interpret households' savings as capital-funded pensions. The reason for such an outcome is the same as in the introduction of capital-funded pensions (see Section 4): the gross wages drop more in the multi-pillar case than in the shrunk pay-as-you-go case, reducing earnings-related pay-as-you-go pension payments more, and thus generating a need to compensate with additional savings.
Appendix C
Empirical analysis with other specifications
The main part of the empirical analysis from Section 5 is repeated with alternative specifications, to gauge the robustness of the results. Because households' saving is influenced by the pension replacement rate conditional on being covered, the pension variables in the modified regressions consist of the product of the private (respectively public) pension coverage rate with the private (respectively public) pension replacement rate. In this appendix, I consider three other options.
In the first case, I use each rate separately, rather than multiplying coverage and replacement rates. In the second case, I consider the private (respectively public) replacement rates only. In the third case, I use the product of the private pension coverage rate with the private replacement rate, and the public replacement rate alone. This case is motivated by the small variation in the public coverage rates among developed countries, while the variation of the private coverage rates is notable. In the interest of space, I restrict the analysis to one of the two measures of the public coverage rate, namely that presented as percentage of the labor force.
Table 6 provides the results for the baseline regression, which are taken from the fifth column of Table 2, and for the three alternative specifications, reported in columns (A1) to (A3).
Cross-section evidence on current account determinants, robustness analysis

Outcomes for the three alternative specifications are qualitatively consistent with the baseline result. As expected, the larger the private coverage rate and the larger the private replacement rate, the higher the current account balance, ceteris paribus. Conversely, the larger the public coverage rate and the larger the public replacement rate, the lower the current account balance. However, none of the coefficients for the pension variations is statistically significant at the 10% level. By contrast, one of the two pension coefficients is statistically significant at the 5% level in the baseline specification. These outcomes support the definition and use of the baseline specification.
Appendix D
Data and samples
This appendix provides details on the samples and data used for the empirical analysis presented in Figure 1 and Section 5. Because the empirical analysis realized in Section 5 is the smallest possible adjustment of Eugeni (Reference Eugeni2015), I re-use its definitions and data sources as much as possible. The samples however differ, as I compare two different kinds of pension systems which are usually only in place in highly developed (high-income) countries. Because the latest information on pension coverage from the World Bank is for 2013, I perform the analysis for this year. The resulting data for my main sample are displayed in Table 7.
Data, OECD high-income sample

Data: Identical to Eugeni (Reference Eugeni2015) are the following data: the current account balance (% of GDP), GDP per capita (current prices PPP), government budget balance (general government net lending/borrowing, % of GDP) and investment (total, % of GDP) which come from the IMF (World Economic Outlook). The domestic credit (to private sector, % of GDP), the age dependency ratio (ratio of younger than 15 plus older than 64 to the working-age population, aged 15–64) come from the World Bank (World Development Indicators). GDP per capita growth is computed from real GDP growth data from the IMF (World Economic Outlook) and population growth data from the World Bank (World Development Indicators).
Other than for replication purposes, pension variables differ from Eugeni (Reference Eugeni2015). For ease of interpretation, I assume throughout that public pensions are all of a pay-as-you-go nature and that private pensions are all of a capital-funded pensions nature. I also assume that the pension coverage rate provided by the World Bank (Pensions Database) is equal to the coverage rate of public pensions.
The public pensions coverage data come from the World Bank (Pensions Database), using both of the two definitions it provides (namely, total number of active contributors as percentage of the labor force, or as percentage of the working age population). The private pensions coverage data come from the OECD (Pensions at a Glance), taking the maximum between the private mandatory value and the private voluntary value provided for each country. Both the public pensions replacement rate and the private pensions replacement rate come from the OECD (Pensions at a Glance), taking the gross rates to eliminate the influence of taxation (gross pensions replacement rates, percentage of individual earnings). Except when otherwise mentioned, I use the replacement rate for the average earner.
Samples: I use two samples in the main analysis.
For the replication of Eugeni (Reference Eugeni2015), I use its worldwide sample, namely all countries of the world for which the World Bank provides pension coverage information. Because the World Bank added some countries in the list after the analysis of Eugeni (Reference Eugeni2015) was made, my sample is slightly bigger (113 countries instead of 98).
For the rest of the empirical analysis, I restrict to OECD high-income countries, where a country is considered to be high-income if its GDP per capita is at least as high as the lowest value for OECD European countries. The reason for focusing on OECD countries is data availability: OECD is the only source providing pension replacement rates. Canada, Latvia and New Zealand are removed because data are missing, leaving a sample of 29.
Robustness checks have been performed for a slightly extended OECD sample (38 countries), adding so-called collaborating countries for which there is pension replacement rate information.
Appendix E
Details on the comparison with literature results
This appendix provides details and comments on Table 3. As cases 1, 2, 5 and 11 have been presented in a comprehensive fashion in Section 6, I do not consider them again.
Figures for cases 3 and 10 are computed as follows. Taking the public coverage rate differential as fraction of the labor force (8 percentage points, as per Table 7), the analysis by Eugeni (Reference Eugeni2015) implies a current account differential of 0.7 percentage points of GDP. In my analysis, the private coverage and replacement rate differentials (4.7 percentage points, as per Table 7 and multiplying coverage and replacement rates) would lead to a current account differential of 1 percentage point of GDP (using the 0.0241 coefficient from column 4 in Table 2).
As I do not consider retirement age variations, I use in case 4 a simple translation for a comparison with case 11. After retirement, Austrians live on average 23 years. Ceteris paribus, I assume that entering retirement 1 year later leaves lifetime public pension payments untouched, corresponding to a 1/23 = 4.4% increase of the average public replacement rate. According to my empirical estimates (using a constant coverage rate of 94% and an increase of the replacement rate of 77% by 4.4%, as per Table 7), such a differential of the replacement rate would lead to a reduction of the Austrian current account balance of 0.2 percentage points of GDP (using the 0.0609 coefficient from column 5 in Table 2).
in't Veld et al. (Reference in't Veld, Kollmann, Pataracchia, Ratto and Roeger2014), Kollmann et al. (Reference Kollmann, Pataracchia, Raciborski, Ratto, Roeger and Vogel2016), Gomes et al. (Reference Gomes, Jacquinot and Pisani2016) and Gadatsch et al. (Reference Gadatsch, Staehler and Weigert2016) are analyses using multi-country DSGE models similar to Kollmann et al. (Reference Kollmann, Ratto, Roeger, in't Veld and Vogel2015) but investigate different countries and reforms. Key results, which are reported in cases 6 to 9, are similar in magnitude to my simulation and empirical results.
In addition to retirement age variations, Kerdrain et al. (Reference Kerdrain, Koske and Wanner2010) investigate the impact of other structural reforms (cases 12 to 15). Jaumotte and Sodsriwiboon (Reference Jaumotte and Sodsriwiboon2010) use a comparable method but consider other regions and reforms (cases 16 and 17). All their outcomes are quantitatively comparable to my empirical results.
My analysis further relates to the vast empirical literature on current account determinants. A summary of outcomes for representative studies is provided in cases 18 to 22. These outcomes and my results have a similar magnitude.