INTRODUCTION
Research on language proficiency in bilingual children has revealed a significant impact of language exposure, socioeconomic status (SES), and memory, although the interplay of all these factors has seldom been explored. Many studies tend to focus on predicting vocabulary, and until recently most research was based on relatively homogeneous home-language groups (although see Floccia et al., Reference Floccia, Sambrook, Delle Luche, Kwok, Goslin, White, Cattani, Sullivan, Abbot-Smith, Krott, Mills, Rowland, Gervain and Plunkett2018 and Paradis, Rusk, Duncan, & Govindarajan, Reference Paradis, Rusk, Duncan and Govindarajan2017).
While the impact of language exposure on language proficiency is uncontroversial, many questions remain about the relationship between the two. What aspects of language experience need to be taken into account? Is exposure alone a sufficient indicator? Does language use have a significant impact? Does past language experience matter (e.g., an initial monolingual period)? Is it possible to predict when bilingual children’s proficiency in the school language (SL) can be expected to fall within the monolingual range, assuming the absence of developmental disorder?
SES is also well established as an important environmental predictor, but how to interpret its effect (e.g., in relation to variations in quantity and/or quality of input) remains unclear.
This study offers an investigation of environmental predictors of language proficiency in bilingual children, informed by an in-depth review of the relevant literature and the use of advanced quantitative methods. As explained in the next section, the novelty of our approach lies in (a) the deliberate choice of a highly heterogeneous participant group, (b) the breadth of proficiency aspects measured, (c) the comparison of alternative estimates of language experience as predictors of language proficiency, (d) the investigation of interactions between environmental predictors, and (e) the investigation of language exposure thresholds to inform comparisons between bilingual and monolingual groups. As such, our focus is both methodological and descriptive, so as to inform future research with a more theoretical focus.
THE STATE OF THE ART
KEY ASPECTS OF BILINGUAL LANGUAGE EXPERIENCE
Language development requires language input, that is, direct evidence relevant to the acquisition of particular aspects of language. Language acquisition theories differ in what constitutes necessary input, and modeling the availability of usable input in the language environment is not straightforward (see Carroll, Reference Carroll2017 for discussion). It is, however, reasonable to assume that language exposure is a reliable proxy for language input. Indeed, variation in language exposure has been shown to affect many aspects of language development in bilingual children (see e.g., Grüter & Paradis, Reference Grüter and Paradis2014; Hoff et al., Reference Hoff, Core, Place, Rumiche, Señor and Parra2012; Paradis, Reference Paradis2011; Paradis et al., Reference Paradis, Rusk, Duncan and Govindarajan2017; Place & Hoff, Reference Place and Hoff2011; Thordardottir, Reference Thordardottir2011; Thordardottir, Rothenberg, Rivard, & Naves, Reference Thordardottir, Rothenberg, Rivard and Naves2006; Unsworth, Reference Unsworth2013b, Reference Unsworth, Nicoladis and Montanari2017; Unsworth, Persson, Prins, & De Bot, Reference Unsworth, Persson, Prins and De Bot2014).
Bilingual children’s language exposure is by its very nature extremely varied in terms of relative quantity and context (De Houwer, Reference De Houwer2007). Some children are exposed to both languages at birth or thereafter, others are exposed to a second language later in childhood (De Houwer, Reference De Houwer2011; Meisel, Reference Meisel2009). Relative exposure to the two languages may also vary over time, leading to different amounts of cumulative exposure to each over the course of their lives (Gutiérrez-Clellen & Kreiter, Reference Gutiérrez-Clellen and Kreiter2003; Thordardottir, Reference Thordardottir2011; Unsworth, Reference Unsworth2013b). Given the heterogeneity of the bilingual language experience, it is now recognized that bilingualism should be conceptualized as a continuous variable rather than a categorical one (Kaushanskaya & Prior, Reference Kaushanskaya and Prior2015; Luk, Reference Luk2015).
Studies that have investigated the relationship between language exposure and language proficiency in bilingual children have typically focused on a snapshot of the child’s language experience at the time of assessment (De Houwer, Reference De Houwer2009; Jia & Aaronson, Reference Jia and Aaronson2003; Paradis, Reference Paradis2011). Recently, the notion of cumulative exposure has gained traction in the context of a more holistic approach to the child’s language history (Gutiérrez-Clellen & Kreiter, Reference Gutiérrez-Clellen and Kreiter2003; Unsworth, Reference Unsworth2013b). Indeed, proficiency at time x, however it is measured, is the result of the child’s language experience over time and not just at time x. This is particularly relevant in the case of sequential bilingual children who may experience rather abrupt changes in the relative exposure to their two languages when they start formal childcare placements or school.
The impact of bilingual children’s language use on proficiency has hitherto received comparatively less attention (but see Bohman, Bedore, Peña, Mendez-Perez, & Gillam, Reference Bohman, Bedore, Peña, Mendez-Perez and Gillam2010; Ribot, Hoff, & Burridge, Reference Ribot, Hoff and Burridge2017; Unsworth, Reference Unsworth, Silva-Corvalán and Treffers-Daller2015). Research with adult bilinguals has shown that the opportunity to use the language is an important factor in determining the degree of bilingualism (Jia, Aaronson, & Wu, Reference Jia, Aaronson and Wu2002). There is reason to believe that, for children too, the extent to which they use a language will be a determinant of the proficiency attained in that language. Some studies with child bilinguals explicitly include a measure of language use, based on children’s experience at the time of testing (Bedore et al., Reference Bedore, Peña, Summers, Boerger, Resendiz, Greene, Bohman and Gillam2012; Bohman et al., Reference Bohman, Bedore, Peña, Mendez-Perez and Gillam2010; Goldstein, Bunta, Lange, Rodriguez, & Burrows, Reference Goldstein, Bunta, Lange, Rodriguez and Burrows2010; Gutiérrez-Clellen & Kreiter, Reference Gutiérrez-Clellen and Kreiter2003). Similarly to language exposure, language use is likely to change over time as children’s circumstances and their opportunities to use their two languages vary.
This study investigates how to best predict language proficiency based on language experience, by comparing different ways of operationalizing language experience as a continuous measure. First, we ask if a combined measure of cumulative language exposure and use predicts (various aspects of) proficiency in the school/societal language. Then we compare that measure to alternative measures (cumulative exposure only, and current measures of exposure and use) to ascertain which is the most informative predictor in the population of interest.
COGNITIVE AND SOCIAL DETERMINANTS OF LANGUAGE PROFICIENCY
Memory skills, both short-term memory (STM) and working memory (WM) have been shown to be positively associated with language skills in monolingual children (Baddeley, Gathercole, & Papagno, Reference Baddeley, Gathercole and Papagno1998). STM is strongly associated with word learning skills (Avons, Wragg, Cupples Wragg, & Lovegrove, Reference Avons, Wragg, Cupples Wragg and Lovegrove1998; Majerus, Poncelet, Greffe, & Van der Linden, Reference Majerus, Poncelet, Greffe and Van der Linden2006), but the extent to which it is predictive of other language skills is less clear. Some studies have found a positive relationship between STM and the comprehension of syntactically complex sentences in adults (Lauro, Reis, Cohen, Cecchetto, & Papagno, Reference Lauro, Reis, Cohen, Cecchetto and Papagno2010; Papagno, Cecchetto, Reati, & Bello, Reference Papagno, Cecchetto, Reati and Bello2007), others have failed to find such a direct link in children, in spite of a strong effect of STM on sentence repetition (SRep) abilities (Willis & Gathercole, Reference Willis and Gathercole2001). WM, however, is more clearly associated with metalinguistic abilities (McDonald, Reference McDonald2008) and sentence comprehension (Montgomery, Reference Montgomery1995; Montgomery, Magimairaj, & O’Malley, Reference Montgomery, Magimairaj and O’Malley2008), particularly the comprehension of structurally complex sentences (see Kidd, Reference Kidd2013) for a recent review of the role of WM in children’s sentence comprehension.
As for children who are exposed to more than one language, Thorn and Gathercole (Reference Thorn and Gathercole1999) have shown a positive relationship between the ability to recall digits and nonwords in two STM tasks and the receptive and expressive vocabulary skills of English-French bilingual between the ages of 4 and 8 in their two languages. STM as measured by nonword repetition has been shown to be more weakly associated with amount of exposure than vocabulary skills are (Thordardottir & Brandeker, Reference Thordardottir and Brandeker2013). To date very few studies have simultaneously investigated STM and WM in bilingual school-age children, and their relationship with lexical and grammatical skills. Engel de Abreu, Gathercole, and Martin (Reference Engel de Abreu, Gathercole and Martin2011) explored this relationship in a group of Luxembourgish-German bilinguals between 5 and 6 years of age. STM was found to be predictive of vocabulary knowledge independently of WM, suggesting a highly specific association. WM and fluid intelligence (jointly interpreted as the capacity for controlled processing) were found to predict higher-order language processing (e.g., the understanding of syntactic contrasts). Compatible results were obtained by Verhagen and Leseman (Reference Verhagen and Leseman2016), based on the comparison between a group of monolingual Dutch 5 year olds and an age-matched group of Turkish-Dutch bilingual children exposed to both languages naturalistically. The results of a confirmatory factor analysis showed that verbal STM predicted receptive vocabulary skills in Dutch, and that both verbal STM and verbal WM were predictive of grammar skills after controlling for vocabulary and SES.
While STM and WM can be considered child-internal determinants of language acquisition, a child-external factor that has been shown to be of great significance is the SES of the child, indirectly measured using parental information. SES has been variously conceptualized in the literature in terms of household income, parental occupation, or parental (often maternal) education. Given the typically high correlation between these variables, studies have often used them interchangeably.
The relative contribution of SES to bilingual children’s language skills is not easy to identify. As highlighted by Hoff (Reference Hoff2013), both bilingualism and SES have an impact on language development, and not enough research has yet considered the relative contribution of amount of language exposure and SES to disentangle these two factors. However, those studies that have included bilingual children from different SES backgrounds (see the following text) have typically found that SES can be an independent predictor of language proficiency.
To date, four studies have simultaneously evaluated the effect of SES and bilingualism on children’s different linguistic and cognitive domains. Calvo and Bialystok (Reference Calvo and Bialystok2014) focused on receptive vocabulary, nonverbal intelligence, and executive function tasks in a linguistically heterogeneous group of 6 to 7 year olds in Canada with 26 different home languages (HLs). Gathercole, Kennedy, and Môn Thomas (Reference Gathercole, Kennedy and Môn Thomas2016) assessed vocabulary, grammar, and cognitive skills in Welsh-English bilinguals in Wales. Chiat and Polišenská (Reference Chiat and Polišenská2016) included Turkish-English and Spanish-English bilinguals in England and included measures of nonword repetition and vocabulary. Most recently Meir and Armon-Lotem (Reference Meir and Armon-Lotem2017) addressed the independent and combined effect of SES and bilingualism in Russian-Hebrew bilinguals in Israel on expressive vocabulary and verbal STM.
The results for vocabulary measures are consistent across the four studies showing significant effects of SES and bilingualism, with bilingual children and children from lower SES performing more poorly. A lack of interaction between the two factors indicates that SES affects monolingual and bilingual children similarly.
Performance on a test of nonverbal intelligence in the Calvo and Bialystok (Reference Calvo and Bialystok2014) study was not affected by either SES or bilingualism, while executive functioning was adversely affected by low SES, but positively affected by bilingualism. In the study by Gathercole et al. (Reference Gathercole, Kennedy and Môn Thomas2016), SES, but not bilingualism, was a significant predictor of performance on cognitive measures.
As for memory, Chiat and Polišenská (Reference Chiat and Polišenská2016) report that neither SES nor bilingualism affected children’s performance on their nonword repetition tasks. By contrast, Meir and Armon-Lotem (Reference Meir and Armon-Lotem2017) found that performance on a forward digit task was only affected by SES but not by bilingualism, even after controlling for vocabulary. For a nonword repetition task neither SES nor bilingualism had an effect, with the exception of a negative effect of bilingualism on a subset of nonwordlike stimuli that disappeared after controlling for vocabulary. In a SRep task, there was a significant effect both of SES and bilingualism, but the latter was nonsignificant after controlling for vocabulary.
The risk conferred by low SES is not induced by poverty, but by poverty of the child’s environment, which translates into lower quantity and quality of the language addressed to the child. Factors such as high lexical diversity, syntactic complexity, and the frequency of decontextualized language use are all features of good quality input that facilitate the acquisition process, and they tend to be less well represented in parents from lower SES backgrounds (Hoff, Reference Hoff2006; Huttenlocher, Waterfall, Vasilyeva, & Vevea, Reference Huttenlocher, Waterfall, Vasilyeva and Vevea2010; Rowe, Reference Rowe2012).
This study will probe the impact of SES on language proficiency in two ways. Assuming SES is a proxy for the richness of the language environment, we will investigate how it interacts with the amount of language exposure experienced by the child. Also, given that both SES and cognitive abilities are predictive of performance in language proficiency tasks, and that SES predicts many aspects of cognitive development, we will investigate the extent to which SES predicts language proficiency over and above the effect of cognitive predictors.
BILINGUALISM PROFILES
It is not uncommon to be faced with the question of “how bilingual” a child is. Parents of bilingual children who understand the home language but answer back in the societal language ask themselves if their child is “truly bilingual.” Teachers wonder which of the bilingual children in their care may need additional support with the school language. Researchers seeking to assess the impact of bilingualism on other aspects of a child’s development need to consider whether the children in their study are “bilingual enough” for an effect to be detectable—or may have as a primary question what the relevant threshold is.
Two questions are of particular interest. The first one relates to functional thresholds within the bilingualism continuum. The second one relates to language dominance more generally.
Functional Thresholds
From what amount of language experience in a “second” language should a child be considered bilingual? In their study of vocabulary development in bilingual children, Pearson, Fernández, Lewedeg, and Oller (Reference Pearson, Fernández, Lewedeg and Oller1997) report that children with less than 20% exposure to one of their languages tended “not to produce utterances in that language willingly or spontaneously” (p. 56). While they were very careful to note that children below this exposure threshold might “become bilingual” nonetheless (and that some children with more exposure might not), their recommendation that the children in their sample “whose exposure was less balanced than 75:25 not be considered for future bilingual studies” (ibid.) has been used as an exclusion criterion in many studies since (even if the use of that language was not under investigation, as in e.g., Laloi, de Jong, & Baker, Reference Laloi, de Jong and Baker2017). The assumption is that, below a certain critical threshold of experience in more than one language, a child should be considered functionally monolingual (Bedore et al., Reference Bedore, Peña, Summers, Boerger, Resendiz, Greene, Bohman and Gillam2012). What this means in practice is not clear. A functionally monolingual child may have a good level of comprehension in her “weak” language. Furthermore, while cross-linguistic interference during language comprehension (e.g., semantic priming) has been demonstrated in bilingual children as young as 30 months of age with at least 75:25 exposure balance (Jardak & Byers-Heinlein, Reference Jardak and Byers-Heinlein2018), we do not yet know from what amount of language exposure the effect of cross-linguistic interference is detectable.
A related question is that of how much experience a child needs to have of a language to be likely to perform within the monolingual range of their age group. Many rightly object to the evaluation of bilingual children’s performance in terms of deficiency in relation to monolingual norms, as language processing has been shown to be fundamentally different in monolinguals and bilinguals (Cook, Reference Cook and Odlin1994; Grosjean, Reference Grosjean1989; Romaine, Reference Romaine1989). However, assessing whether a bilingual child’s performance falls within the range of typically developing monolinguals (which features a considerable amount of variation) remains useful for education purposes, as bilingual children’s academic achievement is assessed only in the SL. For instance, poor academic performance might be due to a lag in language proficiency rather than a lack in academic abilities. In turn, a lag in language proficiency will in most cases be due to lower levels of exposure to the SL. As the academic demands are the same for bilingual and monolingual children, it is important to be able to take into account the likelihood of a disadvantage induced by reduced exposure to the SL.
Cattani et al. (Reference Cattani, Abbot-Smith, Farag, Krott, Arreckx, Dennis and Floccia2014) provide evidence suggesting that typically developing 2;6 year olds acquiring English and an additional language from birth will perform equivalently to their monolingual peers in terms of receptive and productive vocabulary if they are exposed to English 60% of the time.
What the threshold is for sequential bilinguals (who start out with a monolingual period) remains unknown. Also unknown is the threshold of language experience required for a child to perform within the monolingual range in other aspects of language proficiency. Our study will investigate these questions in 5 to 7 year olds, with respect to a range of proficiency measures.
Language Dominance
Variation in bilinguals’ language experience can result in an imbalance between their two languages. Children with superior proficiency in one language have been argued to be dominant in that language (following e.g., Genesee, Nicoladis, & Paradis, Reference Genesee, Nicoladis and Paradis1995), in contrast with “balanced” bilinguals, who are expected to enjoy a similar level of proficiency in both languages. The notion of language dominance has prompted much controversy in the literature. Changes in language dominance over the life span (De Houwer, Reference De Houwer2011) make it difficult to pin it down, and the distributed nature of bilingualism (where each language tends to be associated with different contexts—e.g., school vs. home) makes it difficult to assess language dominance across the board (Grosjean, Reference Grosjean, Silva-Corvalan and Treffers-Daller2016). There is also little agreement regarding how language dominance should be evaluated in the first place (see Silva-Corvalán & Treffers-Daller, Reference Silva-Corvalán and Treffers-Daller2015 for in-depth discussion).
However, there is a general consensus that language dominance is a useful construct, and that it can be estimated based on proficiency (Montrul, Reference Montrul, Silva-Corvalán and Treffers-Daller2015) or based on language experience (Unsworth, Reference Unsworth, Silva-Corvalán and Treffers-Daller2015). A number of studies have also shown that language dominance predicts the directionality of cross-language influence in bilinguals: the dominant language has repeatedly been found to influence the nondominant one (see e.g., Bernardini & Schlyter, Reference Bernardini and Schlyter2004; Kupisch, Reference Kupisch2007; Lanza, Reference Lanza2004).
While generally derived from continuous measures of language experience or proficiency, language dominance tends to be conceptualized in terms of discrete categories based on critical thresholds (e.g., Bedore et al., Reference Bedore, Peña, Summers, Boerger, Resendiz, Greene, Bohman and Gillam2012). Yet, as argued by Treffers-Daller (2015, p. 253), language dominance should be regarded as a continuum, given that bilingualism is not categorical.
Our study will compare cumulative language exposure and language dominance as measures to estimate whether a bilingual a child in monolingual education can be expected to perform within the monolingual range in terms of proficiency in the SL.
Summary
This review of the literature has brought to light a number of gaps that our study intends to address. These include (a) a systematic comparison of alternative measures of language experience (as predictor of a range of aspects of language proficiency) in bilinguals; (b) a better understanding of the impact of SES, in relation with the amount of language exposure experienced by the child, and, in relation with cognitive determinants of language proficiency; and (c) the objective identification of the amount of language exposure required for a bilingual child educated in monolingual settings to be expected to perform within the monolingual range in terms of language proficiency.
AIM AND QUESTIONS
Our overarching aim is to exploit advanced statistical methods to address the following three broad research questions, related to environmental predictors of language proficiency in bilingual children :
1. Does a gradient measure of bilingual language experience (combining exposure and use) and a gradient measure of SES (as a proxy for the richness of the child’s language environment) significantly predict the following aspects of school language proficiency: comprehension and production of complex sentences, lexical semantics, and discourse-semantics?
2. How does a combined measure of cumulative language experience (combining exposure and use over time) compare with simpler measures (i.e., cumulative exposure or cumulative use, current exposure or current use), as predictors of school language proficiency?
3. What is the critical amount of school language experience required for bilingual children to perform within the monolingual range? In other words: At what point can one expect the gap between bilinguals and monolinguals to be “closed” in the school language?
We focus on children educated monolingually in the societal language (English), between the ages of 5 and 7 (i.e., in the first two years of formal education in England), with a broad range of exposure to a different language at home and diverse socioeconomic backgrounds. Gender, age, and cognitive factors (i.e., memory, cognitive flexibility) will be included in the analyses as covariates, as they can be expected to have an impact but are not central to our research questions.
METHODOLOGY
PARTICIPANTS
We aimed to study a representative sample of the bilingual population in a geographical area that is characterized by a high degree of linguistic and cultural heterogeneity. We recruited 174 children (including 87 monolinguals) between the ages of 5 and 7 from schools throughout the North of England. Ethical approval was obtained from the University of Leeds (Ref. PVAR 12-007), and parental consent was obtained prior to data collection.
The SL was exclusively English for all the children. The bilingual children were also exposed to another language (henceforth the home language, or HL) in varying degrees (see the following text). There was a total of 28 HLs in our sample:Footnote 1 Arabic (9%); Bengali, Cantonese, Catalan, Dutch, Farsi, and French (8%); Greek, Hindi, Italian, Kurdish, Mandarin, Marathi, Mirpuri, Nepalese, Pashto, Polish, Portuguese, and Punjabi (21%); Shona, Somali, and Spanish (6%); and Swedish, Tamil, Telugu, Thai, Tigrinya, and Urdu (17%). Bilingual and monolingual children were recruited from the same schools for maximum comparability. None of the children were excluded from the study.
Table 1 summarizes the distribution of the two groups in gender and age. For ease of presentation, children with any amount of exposure to a language other than English are referred to as “bilinguals”; children who had no exposure to a language other than English are referred to as “monolinguals.” All children were reported by the school to be developing typically and did not have any known hearing deficit.
Participant distribution in gender and age (in years;months)

Socioeconomic Profiles
The schools targeted were in areas of varying degrees of affluence, so as to recruit children from as broad as possible a socioeconomic spectrum. The SES of the children’s families was estimated on the basis of information gathered through a parental questionnaire (see Supplementary Materials). Two measures were obtained: one for parental level of education and one for parental level of current occupation. The highest level was chosen in each case (on the assumption that the status of the household was determined by the best educated parent and the highest occupation among the parents).
(1) a. None
b. Primary school
c. Secondary school
d. Further education
e. University
The occupational data was scored using the reduced method of the National Statistics Socio-economic Classification (simplified NS-SEC, which is based on the Goldthorpe Scheme of sociological classification [Goldthorpe, Reference Goldthorpe1980]).Footnote 2 The score obtained was reversed for ease of interpretability (i.e., a positive correlation with educational level).
The two measures are significantly associated (χ Footnote 2 (4, N = 174) = 83.57, p < .0001 ), as shown in Figure 1. There is a weak but significant negative correlation between the cumulative amount of HL exposure and SES (based on the occupational classification): r = ‒.24, p = .0014.
SES by education and occupation.

Language Experience
Estimates of the amount of exposure and use for each child in English and in their HL were calculated on the basis of information gathered using parental questionnaires (see Online Supplement).
The information sheet, consent form, and questionnaires were translated into the three most common HL with a high risk of low English proficiency in the parents (Bengali, Punjabi, Urdu). Because some of the parents speaking these languages turned out to be illiterate, help was offered from the research assistants, the teachers, or other employees at the schools, or in some cases from other parents who were able to translate.
The language questionnaire asked parents about their own proficiency in English and any other languages,Footnote 3 and their child’s exposure and use of English and their other language in a range of contexts inside and outside the home. It was based on a simplified version of the BiLEC (Unsworth, Reference Unsworth2013b), to make them understandable by parents with limited levels of literacy, without one-to-one support for filling the questionnaire (as this was not feasible for our sample size, given our means and time frame). Parents were asked to list their child’s interlocutors at various periods during weekdays and during weekends in school term, as well as during holidays. The periods captured all the child’s waking hours. School hours corresponded to a single block and the rest of school days was broken down by hours. Weekends and holidays were broken down in time slots of two hours. Type of interlocutor was constrained as a choice between mother, father, siblings, school, or other. For each interlocutor (except “school”), we asked which language was used to address the child, and which language the child used with that interlocutor.Footnote 4 The language of interaction had to be specified as either English, home language, other home language (i.e., other than the main one identified at the outset of the questionnaire), 2 home languages, or both English and the home language. For each interlocutor (including the child), the proportion of interaction in English or the HL had to be specified (as always, usually, half of the time, rarely, or never, which we converted into a 5-point scale ranging from 100% to 0%). For mother, father, and any other significant carer in the home, their proficiency in English was rated by the parent filling the questionnaire (as speaking the language very well, quite well, not well, or not at all). Parents also reported the age of onset of exposure to English, the context of that first exposure (home, play group, nursery, school, or other) and whether their child was born in the United Kingdom. The total number of weeks spent in the HL country was also reported. Finally, parents were asked to indicate the types of activities their children engaged in, in each language (reading with an adult, using a computer, watching television, sports/club, playing with friends).
Current measures of language exposure and use were calculated as follows. The total number of hours of interaction with the child per year was calculated for each of the child’s interlocutors. The proportion of total exposure received by the child from each interlocutor in the HL was calculated as the total number of hours of interaction with that interlocutor, multiplied by the proportion of the time the HL was used with that interlocutor. By adding these proportions from all the child’s interlocutors and dividing the sum by the total number of hours of interaction, we obtained a measure of current exposure to the HL for that child, expressed as a proportion of their total interaction time (assumed to equate to waking hours). Current exposure to English was calculated in the same way. The sum of current exposure to the HL and in English came to 100%. We repeated the same procedure for language use.
Cumulative measures of exposure and use of the HL were calculated as the sum of (a) the number of months of monolingual exposure (i.e., prior to onset of exposure to English—this amounted to 0 for simultaneous bilingual children and for monolingual children) and (b) the number of months of bilingual exposure multiplied by the proportion of current exposure to (or use of) the HL. The cumulative measures thus correspond to the total number of months equivalent to full-time exposure to the HL.
The cumulative measures do not make a distinction between stages of linguistic development. One might object that, during the earliest months of life, the amount of exposure to each language might be of little consequence, given that the child is not yet able to produce use of a particular language. However, it has recently emerged that the first year of life constitutes a critical period for the development of syntax (Friedmann & Rusou, Reference Friedmann and Rusou2015). We therefore take the default assumption to be that exposure to a language has an impact from the earliest stages of exposure.
A limitation of our estimation methods is that the cumulative measures cannot take into account variability over time, except that induced by age of onset of exposure to the societal/school language.
Our sample ranges across an evenly distributed continuum of bilingual language experience. At the lower end, some children had a very limited experience in a language other than English. At the higher end, some children were late bilinguals, having only experienced the HL until their first significant exposure to English at primary school.
As shown in Figure 2, in the bilinguals, current exposure to the HL ranged from 9% to 89% of estimated waking hours (left panel) while cumulative exposure to the HL ranged from 6 to 69 full months equivalent (right panel). At the time of the study, 31 (36%) children used their HL to the same extent as they were exposed to it (as shown by the top diagonal line in the plot). The rest of the children were relatively more “passive” in their HL, with nine children totally “passive” over their lifetime (i.e., always answering in English when addressed in the SL).
Bilingual children’s current and cumulative experience in their HL.

It is worth noting that simultaneous bilinguals, who were exposed to the two languages from birth, are not necessarily less “passive” in the HL: out of the 41 simultaneous bilinguals in our sample, only 11 used their HL to the same extent that they were exposed to it at the time of the study. Furthermore, even if a child started out as monolingual in the HL, this is no guarantee that they will remain “active” in that language when they start school in English. For instance, out of the 18 children who had had very little exposure to English before the age of 3, 8 of them had become relatively “passive” in the HL at the time of the study.
Children who are bilingual from birth did not necessarily come from “one-parent one-language” households (see Table 2): only 51% (21/41) of simultaneous bilinguals did so in this study. English exposure started outside the home (in daycare) for 17% (7/41) of the simultaneous bilinguals. Given this variability, neither the language policy of the household nor the age of onset of bilingual exposure are sufficient to give the full picture of children’s patterns of language exposure over time.
Distribution of children according to onset of bilingual exposure (in years), by home-language policy categories

PROFICIENCY MEASURES
Several measures of English-language proficiency were collected from a battery of tests aiming to tap into a broad range of aspects of language competence. The tests included (a) a SRep task (the short version of the LITMUS Sentence Repetition test—Marinis & Armon-Lotem, Reference Marinis, Armon-Lotem, Armon-Lotem, de Jong and Meir2015; Marinis, Chiat, Armon-Lotem, Gibbons, & Gipps, Reference Marinis, Chiat, Armon-Lotem, Gibbons and Gipps2010), (b) the sentence structure subtest of the Clinical Evaluation of Language Fundamentals (CELF-4-UK—Semel, Wiig, & Secord, Reference Semel, Wiig and Secord2006), and (c) four subtests of the Diagnostic Evaluation of Language Variation: the verb and preposition contrasts, real verb mapping, novel verb mapping, and articles subtests (DELV—Seymour, Roeper, & de Villiers, Reference Seymour, Roeper and de Villiers2005). The aspects of proficiency probed by each test are outlined in the following text.
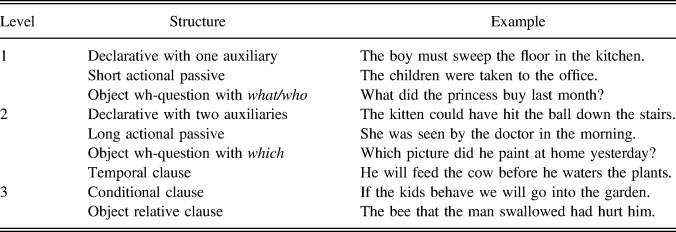
The SRep task was designed specifically for bilingual populations.Footnote 5 It taps into language processing at all levels of representation (phonological, morpho-syntactic, and semantic) in both comprehension and production, as successful comprehension is necessary for correct repetition (Marinis & Armon-Lotem, Reference Marinis, Armon-Lotem, Armon-Lotem, de Jong and Meir2015). We used the short version, which comprises 30 sentences with three levels of difficulty described in Table 3.
Sentence structures by level of difficulty in the SRep test

The Sentence Structure component of the CELF aims to “measure the acquisition of grammatical (structural) rules at the sentence level” (CELF manual, p. 88). In each trial of this comprehension test, the child is presented with four pictures and asked to point at the one that matches the prompt sentence. The test is designed for 5- to 8-year-old children.
The DELV is a dialect-neutral assessment for 4 to 9 year olds, aiming to limit the effects of language exposure differences in bicultural populations. We administered the following tasks to evaluate children’s semantic competence, and in particular lexical semantics, argument structure, and discourse semantics:
(2) a. Verb contrast and preposition contrast
b. Real verb and novel verb mapping
c. Articles
The contrast tasks tap into the organization of the child’s lexicon into contrastive words and levels of meaning. These tasks focus on action and location words, which relate to common aspects of children’s experience across cultural/social groups. They require the child to provide a word that contrasts appropriately with the one negated in a prompt sentence, based on the information provided by the accompanying picture. For instance, in the preposition contrast task, the child might be presented with a picture showing two children pulling angrily at the same train and with the prompt in (3). Adequate answers are illustrated in (a), and inadequate ones in (b).
(3) They’re not sharing the train, they’re…
a. E.g., fighting over it, arguing over it (adequate responses)
b. E.g., fighting, breaking it (inadequate responses)
The preposition contrast task comprises 6 items, and the verb contrast task comprises 10 items.
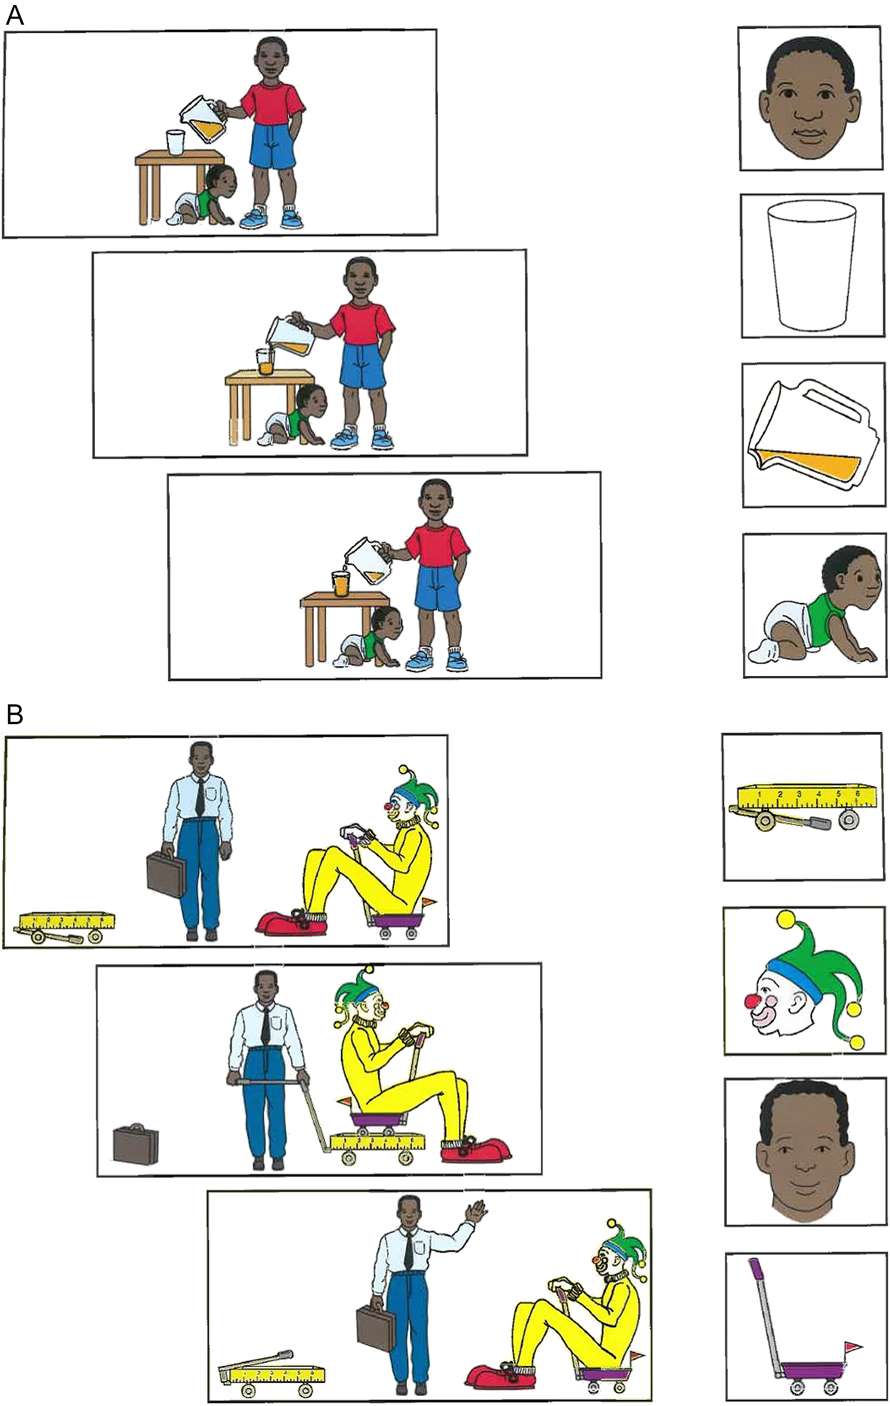
In the mapping tasks (2-b), the child is presented with a series of pictures representing an event, and a second series of side pictures representing the participants in the event (see Figure 3). The examiner describes the event (as in [4]) while pointing at the pictures in a continuous, flowing motion, and then asks the child a series of questions (4-a)‒(4-d).Footnote 6 The child answers by choosing one of the side pictures.
(4) The boy is pouring the juice.
a. Which one was the pourer? (boy)
b. Which one got poured? (pitcher of juice)
c. Which one did he pour the juice into? (glass)
d. Which one was pourable? (pitcher of juice)
Real verb mapping (top) and novel verb mapping (bottom).

The novel verb mapping task follows the same protocol, but with a nonce verb. The aim of this task is to assess children’s abilities to map new meanings from the linguistic context onto verb frames.
(5) The man is lelling the clown.
a. Which one was the leller? (man)
b. Which ones was lellable? (clown)
c. Which one was the clown holding on to? (distractor)
d. Which one got lelled? (clown)
e. Which one was lelling? (man)
The real verb and the novel verb mapping tasks comprise three verbs/scenarios each, about which the child is asked 10 and 15 questions, respectively.
Finally, the articles test of the DELV (2-c) aims to assess children’s understanding (and implementation) of the discourse-semantic differences in the English article system. Children were asked a series of 30 questions (each preceded by a minimal verbal context) requiring a noun phrase as their answer. Based on their assessment of what the interlocutor knows, the child has to choose between a definite (the) or an indefinite (a) article for that noun phrase (Schafer & de Villiers, Reference Schafer, de Villiers, Howell, Fish and Keith-Lucas2000). This depends on how the object is defined and what is known or assumed about the object by the listener. The test was preceded by practice trials until it was clear that the child understood the task.
(6) George bought a shirt and a bag. He’s wearing one of them. Guess which.
a. The + appropriate noun (e.g., the bag or the shirt) (Correct)
b. A + appropriate noun (Incorrect)
c. Bare noun; inappropriate noun; no response (Incorrect)
COGNITIVE MEASURES
Language proficiency tests require children to process and remember language prompts but also, when based on pictorial stimuli, to compute inferences (e.g., to choose the correct picture from a set). We therefore collected several cognitive measures to use as covariates in the analyses.
Measures of STM and WM were obtained from the Digit Span tasks (Wechsler Intelligence Scale for Children III—Wechsler, Reference Wechsler1991). The use of numerical memoranda has been shown to be relatively independent of test language and cultural status (Engel de Abreu, Baldassi, Puglisi, & Befi-Lopes, Reference Engel de Abreu, Baldassi, Puglisi and Befi-Lopes2013). In those tasks, the examiner verbally presents digits that the child has to repeat in the same order (in the Forward Digit Recall task) or in reversed order (in the Backward Digit Recall task). The number of digits increases by one until the child consecutively fails two trials of the same digit span length. There is a maximum of four trials per digit span length.
The Forward Digit Span measure was used as a proxy for children’s STM capacity, a key component in Baddeley’s (Reference Baddeley2000) Multicomponent Working Memory Model, which has been argued to represent a constraint in language processing (Boyle, Lindell, & Kidd, Reference Boyle, Lindell and Kidd2013). The Backward Digit Span measure was used as a proxy for children’s WM capacity, which has been shown to correlate with spoken sentence comprehension (Magimairaj & Montgomery, Reference Magimairaj and Montgomery2012; Montgomery et al., Reference Montgomery, Magimairaj and O’Malley2008). The raw results on the memory tests are summarized in Tables 4 and 5.Footnote 7
Forward Digit Recall (number of digits correctly recalled)

Backward Digit Recall (number of digits correctly reversed)

To assess children’s cognitive flexibility, we administered the Dimensional Change Card Sort task (henceforth DCCS). The protocol was as described in Zelazo (Reference Zelazo2006). The child was presented in each trial with a picture representing either a rabbit or a boat, that was either blue or red, and asked to place the card in one of two boxes according to a sorting rule (by shape or by color). The boxes were identified by either a blue rabbit or a red boat. The first block trials (N = 6) required using the shape criterion, and the second block (N = 6) required using the color criterion. As the children in our sample were older than 5, we also administered a more advanced block of trials (N = 12) in which a star appeared on some of the cards. Cards without a star had to be sorted according to the shape dimension, and cards with a star had to be sorted according to the color dimension. The repetition of instructions on every trial (in all blocks) ruled out the possibility that difficulty could be attributed to hypothesis testing or memory of the relevant rules. The test session was preceded by a demonstration and two practice trials. The test trials were presented in two counterbalanced orders.
We adopted the method recommended by Zelazo (Reference Zelazo2006) to score the DCCS data. This is based on a pass-fail criterion on each trial block. Passing the first two blocks requires sorting at least five out of six cards correctly (on each block). Passing the third block requires sorting at least 9 out of 12 cards correctly. A child is assigned a score of 0 if they fail the preswitch block, a score of 1 if they pass the preswitch block only, a score of 2 if they also pass the postswitch block, and a score of 3 if they pass all three blocks. Little variability is observed, as shown in Table 6, as many children performed at ceiling. Only one (bilingual) child did not pass the first block.
Distribution of overall DCCS scores (based on block pass-fail)

DESCRIPTIVE RESULTS FOR THE PROFICIENCY TESTS
Results for each proficiency test are first reported descriptively, showing the range of performance of bilinguals compared with that of monolinguals. Unsurprisingly, as a group, the bilinguals’ performance is below that of monolinguals in each test.
SENTENCE REPETITION
The SRep test can be analyzed in different ways, depending on the criterion against which the children’s utterances are evaluated (Marinis & Armon-Lotem, Reference Marinis, Armon-Lotem, Armon-Lotem, de Jong and Meir2015):
(7) a. Exact repetition of the target sentence (Full Accuracy)
b. Grammatical production of the targeted structure (Target Accuracy)
c. Grammaticality of the sentence produced (whether or not it fully matches the target) (Grammaticality)
d. Types of mismatches (i.e., omissions, substitutions or additions) compared with the target sentence) in the following categories:
(i) Lexical
(ii) Inflectional
(iii) Functional
The distribution of raw scores according to the first three types of analysis is plotted in Figure 4. Utterances containing unintelligible material were excluded (total: 208, i.e., 4% of the data).
Pirate plots showing the distribution of the raw SRep test scores (according to three different scoring methods). Each plot shows group mean (thick line), confidence intervals (lighter area around the mean), 10% and 90% quantiles (whiskers), and individual scores.

SENTENCE COMPREHENSION
Although not designed for bilingual populations, the CELF is frequently used to evaluate the proficiency of bilingual children (e.g., Barac & Bialystok, Reference Barac and Bialystok2012; Paradis, Crago, Genesee, & Rice, Reference Paradis, Crago, Genesee and Rice2003).
The distribution of mean scores in the CELF Sentence Structure task is shown in Figure 5.
Pirate plot showing individual mean CELF scores, showing group mean (thick line), confidence intervals (lighter area around the mean), and 10% and 90% quantiles (whiskers).

LEXICAL-SEMANTICS
We analyze the lexical-semantic tests of the DELV separately from the discourse-semantic test, as they tap into different domains of language competence: the lexical-semantic tests tap into the organization of the lexicon, and the discourse-semantic tests taps into the child’s ability to express contrasts in information status through the appropriate use of determiners.
The distribution of raw scores on the lexical-semantic tests is plotted in Figure 6.
Distribution of the scores on the DELV subtests, in bilingual and monolingual children (showing mean, 95% CI, and full range).

DISCOURSE-SEMANTICS
The distribution of the mean scores for the articles test of the DELV are plotted in Figure 7.
Pirate plots for individual mean scores in the articles test, showing mean (thick line), confidence intervals (lighter area around the mean), and 10% and 90% quantiles (whiskers).

METHODS OF ANALYSIS
To model the relationship between English proficiency (as indexed by the response variables from each test) and the potential predictors of proficiency we aimed to investigate, we performed linear regression analyses. For each predictor, the model effectively fits a single line through the scatterplot of individual scores, showing how the mean response changes with the predictor variable. The model can also account for the interaction of two (or more) predictor variables. An advantage of regression analyses is that they can model variance due to continuous as well as categorical predictors.
Linear models assume that the observations (of the response variable) are independent. However, in each proficiency test, multiple observations were collected from each individual, resulting in a nested data structure (rather than truly independent observations). To account for this, and to control for sampling effects (due for instance to lexical properties of the test items), we included Participant and Test Item as random effects in each model, alongside the fixed effects (the predictor variables). The resulting analysis is a mixed-effect model, as it combines random and fixed effects in a single analysis (Baayen, Reference Baayen2008).
We fitted linear mixed models to the data from each proficiency test, using the “lme4” package (version 1.1.21) in R (version 3.6.0). The models were built by adding predictors incrementally, starting from a null hypothesis model including only random effects for Participant and Item. A predictor was retained only if it improved the fit of the model, yielding a significant reduction in Akaike Information Criterion (AIC)Footnote 8 and a significant R-squared value for the model.Footnote 9 Random slopes lead to model nonconvergence and were therefore not included in the final models. In each case the final model was checked against the null hypothesis model, and its residuals (i.e., the observations not accounted for by the model) were checked for normality of distribution, as a further test of the quality of the model.
In all analyses, we tested whether the following variables were significant predictors: age, HL experience, SES, STM, WM, and gender (treating the latter three as covariates). All continuous variables were standardized so that the impact of the predictors can be compared within each model.Footnote 10
For each analysis, we report the optimal model in a table. The statistics for nonsignificant factors will be given in the text where relevant. In the first instance, we present models identifying the predictors of proficiency in bilingual children only. Subsequently, we include monolingual children in the models and identify the threshold of HL experience below which the performance of “bilinguals” does not differ significantly from that of monolinguals in the language of schooling.
QUESTION 1: PREDICTING LANGUAGE PROFICIENCY FROM BILINGUAL CHILDREN’S LANGUAGE EXPERIENCE AND SES
Before reporting on the analyses carried out to address this question, we explain how language experience was apprehended as a variable.
We saw that children’s experience of their HL changed over time, and that many tended to become more “passive” in their usage (even if they spoke only the HL before the age of 3 or 4). Cumulative measures of language experience are therefore likely to be more accurate than current measures, as they can reflect these changes over time. Consequently, we based the first set of analyses on cumulative measures (and then subsequently compared them with analyses based on current measures, to see which fared better).
As all the children in our sample were exposed to two languages only, the amount of experience obtained in one language was inversely correlated with that obtained in the other language (e.g., cumulative exposure to HL vs. English: r = ‒.955, p < .0001). In terms of statistical modeling, it should therefore not make a difference whether exposure to one or the other language is used as a predictor. For practical reasons, we chose to base our language experience measure on the HL measure, so as to make it more easily interpretable: monolingual children would naturally get a bilingual score of 0 whatever their age, as they had no exposure to a HL other than English; for bilingual children, the higher the score, the greater the child’s experience in their HL (and the lesser their experience in English). Another advantage of basing our combined measure on the HL is that, given the substantial variation in HL experience in the group under investigation, the resulting measure is not correlated with age. This makes it possible to tease apart the respective effect of language exposure and age within a single model.
To take “passivity” into account (on the assumption that a bilingual who is relatively passive in a language is likely to be more proficient in their other language), language use has to be taken into account in relation with language exposure. Regression analysis can deal with the effect of continuous predictor variables, but is not able to handle severe collinearity between predictors—as is the case with our language exposure and use measures.Footnote 11 We therefore combined the cumulative measures of HL exposure and use into a single measure, as explained below.
To address the first part of our first research question (i.e., whether a gradient measure of language experience [combining exposure and use] significantly predicts SL proficiency), we created a new language experience measure combining the cumulative estimates of language exposure and use. Because English is the language of schooling, we assumed it was actively used by all children. Greater variability was expected in the exposure to and use of the HL, which, for many children, was (or would become) the weaker language. We therefore used HL estimates to derive our combined language experience measure.
As will be shown in the following text, this combined measure aligns very closely to the amount of cumulative HL exposure, with a “correction” if the HL is productively used by the child to a lesser extent than they are exposed to it (i.e., if cumulative use is lower than cumulative exposure). It can therefore be conceived as a measure of cumulative HL exposure, adjusted for relative “passivity” in that language. We will refer to this combined measure as the Bilingualism Profile Index (BPI).
The BPI was derived by a standard measure of dimensionality reduction: a Principal Component Analysis (PCA) of the two scores.Footnote 12 The choice of this method to combine the two scores is justified as follows. The apparently simpler alternative, that is, linear combination of exposure and use measures, would require arbitrary manipulation, as a particular mathematical operation (e.g., multiplication, division) is required. The choice of operation should be justifiable on conceptual grounds, such that the resulting measure is clearly interpretable. Multiplying exposure and use or dividing one by the other would not result in scores that could be meaningfully interpreted. By contrast, dimension reduction (here by PCA) does not encounter these conceptual difficulties: the combination of the two measures is entirely determined by their distributional properties and exempt of (arbitrary) intervention from the researcher. The resulting score simply combines the information contained in the original two scores. The BPI can thus confidently be interpreted as a score for HL exposure “corrected” downward in the case of comparatively lower use of the HL (see the following text for illustrations).
The PCA of cumulative HL exposure and use yields two principal components, the first of which accounted for most (98%) of the variability in our dataset (due to the strength of the correlation between the two cumulative measures). The first component thus contains almost all the information from the two original measures. The BPI scores correspond to the reversed loadings of that first component.Footnote 13 The monolingual children obtain a BPI score of 0, as their score was 0 for both cumulative measures of HL experience. The bilinguals’ BPI scores ranged from 4 to 96.
Figure 8 shows the correlation of the BPI with current and cumulative measures of exposure and use of the HL.Footnote 14 The dispersion from the linear relationship between the BPI and each of the cumulative measures shows that it is not reducible to any of these measures.Footnote 15
The BPI and its relationship with exposure and use measures in the HL. Each dot represents one bilingual child. Monolingual children would score 0 on both axes.

The BPI is very strongly associated with the age of onset of exposure to English (χ Footnote 2 = 6876.01 p < .0001), but simultaneous bilinguals do not necessarily have less HL experience than sequential bilinguals (who experienced an initial monolingual period in that language). This is shown in the left pane of Figure 9.
The relationship between the BPI and coarser estimates of bilingual experience: Age of Onset and Language Environment in the Home.

The BPI is also associated with the type of HL environment, which we operationalize as follows:
(8) Home language policy categories:
HS (“home split”): one-parent one-language
HOL (“home only, low”): both parents speak the home language; siblings tend to speak English
HOH (“home only, high”): the whole household speaks the home language
While Bilingualism Onset and Home Environment are significantly correlated or associated with the BPI score, neither of them is able to capture the variability in HL experience as precisely as the BPI. For instance, Figure 9 shows that there was a substantial amount of variability in the amount of HL experience obtained by children who were bilingual from birth.
The BPI has two methodological advantages. As a single measure capturing cumulative exposure and use, the BPI makes it possible to use the combined impact of these two highly correlated measures as a predictor in regression analyses.
To answer to our first research question, we investigate the impact of the BPI and SES as predictors of children’s proficiency in English (the SL) in the age group under consideration. The proficiency measures we consider in turn are SRep, sentence comprehension, lexical semantics, and discourse-semantics.
SENTENCE REPETITION
Using the methodology described in the preceding text, we fitted a mixed-effect model to bilingual children’s accuracy data. The response variable was the correct repetition of the target structure on each it the SRep test items (see [7-b]). It indexes children’s ability to produce structures of increasing grammatical complexity (listed in Table 3) independently of their ability to remember exactly all the words in the sentence.Footnote 16
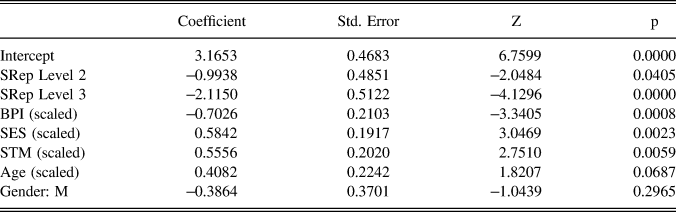
Table 7 summarizes the effect of the significant predictors of accuracy of the production of the target structure by the bilingual children (expressed in our model as the probability of reproducing that structure correctly), as per the optimal model. The estimates in the model summary report the likelihood of a correct responseFootnote 17 for each predictor, compared with the likelihood observed at the intercept. As all the continuous predictors were transformed into z-scores, the intercept is based on the combination of the mean values: the average score for SES, memory, age, and BPI characterizing the bilingual group. In terms of categorical variables, the intercept is calibrated for SRep Level 1 and Gender: Female.
Fixed effects of the optimal Generalized Linear Mixed Model of accurate repetition of target structures in the SRep test by bilingual children. Random effects: participant, item

As seen in the model summary, the BPI is the strongest child-related predictor (β = ‒.7026, p = .0008). Children’s ability to reproduce the target structure is negatively correlated with the amount of experience in their HL: a higher BPI score decreases the probability of a correct response significantly. Children’s performance was also predicted by their SES (β = .5842, p = .002) and their STM (β = .5556, p = .006). The effect of age (over and above that of STM) also approached significance (β = .4082, p = .069). Structural complexity (SRep Level) had a significant impact on performance. The more complex the targeted structure, the poorer the performance: even Level 2 yielded significantly poorer results than Level 1 (β = ‒.9938, p = .041).
There was no interaction between structural complexity level and children’s amount of bilingual experience (β = .13, p = .45). WM had no significant effect β = ‒.05, p = .77). The random effects for participant and item had a variance of 2.55 and 1.12, respectively.
The same predictors were found to be significant in the other overall accuracy analyses of the bilingual children’s performance in the SRep test (not reported here). The proportion of variance captured by STM compared with the other predictors is greater in the Full Accuracy analysis. In the Grammaticality analysis, the level of difficulty (SRep Level) is a lower-ranking predictor (which is to be expected as this analysis does not penalize avoidance strategies), with no significant difference between complexity levels 1 and 2. The relative ranking of predictors by decreasing order of importance in each model are listed in (9) (where SRep Level stands for the items’ level of difficulty):
(9) a. Full Accuracy (7-a):
STM > SRep Level > SES > BPI
b. Grammaticality (7-c):
STM > SES > BPI > SRep Level
Error analysis was performed according to the domain affected (functional, inflectional, lexical). Errors are illustrated in the following text for the functional domain (10), the inflectional domain (11), and the lexical domain (12), respectively.
(10) Target: He will feed the cow before he waters the plants.
He will feed the cow when he waters the plants. (Functional error)
(11) Target: The children were taken to the office.
The children taked to the office. (Inflectional error)
(12) Target: The mum bakes the meal that the children are eating.
The mum makes food for the children. (Lexical errors)
Three accuracy scores were obtained for each sentence by dividing the number of errors of each type from the total number of relevant words (Marinis et al., Reference Marinis, Chiat, Armon-Lotem, Gibbons and Gipps2010).
We tested the significance of the same predictors as in the preceding analyses. The full models are reported in the Online Supplement. The relative importance of predictors (and their statistical significance) differs across error types, as shown in (13) (nonsignificant predictors are omitted).
(13) Functional: SRep Level > BPI > STM > SES
Inflectional: SRep Level > STM
Lexical: SRep Level = STM > SES > BPI
Neither the BPI nor SES turn out to be significant predictors of inflectional errors. The relative importance of the BPI is highest in the model predicting functional errors. The relative importance of STM is highest in the model predicting lexical errors.
SENTENCE COMPREHENSION
A linear regression analysis of the CELF Sentence Structure data reveals that bilingual children’s scaled scores were not predicted by children’s BPI (β = ‒.18, p = .58), nor their SES (β = .51, p = .09), or their STM (β = .14, p = .67). Instead, the strongest predictors were WM (β = .58, p = .03) and cognitive flexibility, (β = 1.36, p = .00001).
In De Cat (2019), I argue that the CELF Sentence Structure test does not probe children’s ability to deal with linguistic aspects of structural complexity, as these are confounded with cognitive complexity in the task. The lack of significance of English exposure (as the counterpart of HL exposure) as a predictor is most likely due to that confound. It is unclear whether the CELF Sentence Structure scores can be interpreted as a reliable index of language proficiency. We will therefore not consider them any further in this article.
LEXICAL-SEMANTICS
Given the different distribution of scores across tests in the bilingual group (Welch’s F (3, 190.795) = 31.0695, p < .0001), we did not use a composite score in the first instance. We carried out a MANOVA to identify the significant predictors of performance in the four DELV subtests (in one go) without inflating the Type 1 error rate.
Using Pillai’s trace, a statistically significant MANOVA effect on the performance of bilingual children was observed for the BPI (V = .2, F(4, 77) = 4.7, p = .002), SES (V = .18, F(4, 77) = 4.23, p = .004), STM (V = .18, F(4, 77) = 4.36, p = .003), and cognitive flexibility (V = .23, F(4, 77) = 5.77, p = .0004). Age approached significance (V = .11, F(4, 77) = 2.38, p = .0586), and WM was not significant (V = .063, F(4, 76) = 1.28, p = .28).
After the MANOVA had identified the significant predictors, linear regression models were fitted to predict the accuracy score on each of the DELV subtests. The BPI was a significant predictor of poorer performance in the Preposition Contrast task (t (82) = -2.63, p = .01) and the Real Verb Mapping task (t (82) = -2.39, p = .02), and approached significance in the Verb Contrast task (t (82) = -1.80, p = .07). It was not significant in the Novel Verb Mapping task (t (82) = -0.81, p = .42). SES significantly predicted performance in the Verb Contrast task (t (82) = 2.57, p = .01), and approached significance in the Real Verb Mapping task (t (82) = 1.96, p = .05). It was not significant in the Preposition Contrast task (t (82) = 1.47, p = .14) nor in the Novel Verb Mapping task (t (82) = 1.37, p = .17). STM significantly predicted performance in the Real Verb Mapping task (t (82) = 4.26, p < 0.0001) and the Novel Verb Mapping task (t (82) = 3.32, p = .001). It approached significance in the Verb Contrast task (t (82) = 2.56, p = .1), and was not a significant predictor in the Preposition Contrast task (t (82) = 1.47, p = .14). This is summarized in Table 8.
Predictor significance in the DELV lexical-semantic tests (* indicates significance; . indicates a trend)

If the four scores are combined into a composite score, the following factors are found to predict bilingual children’s performance (in order of importance), as summarized in Table 9: STM, BPI, and WM. SES and Age are not significant.
Coefficients of the optimal linear regression model fitted to bilingual children composite score in the DELV lexical-semantic tests

DISCOURSE-SEMANTICS
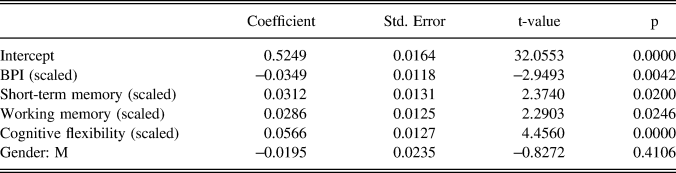
Analysis was performed by fitting a linear regression model to the children’s overall score. Performance was negatively correlated with the BPI (β = ‒.0485, p = .012). This was more than compensated by SES, which was a stronger predictor of performance in the bilingual children (β = .0549, p = .0074). The following factors proved nonsignificant predictors of the bilingual children’s performance: age (β = .0306, p = .12), STM (β = .0125, p = .53), and WM (β = .029, p = .14). Table 10 reports the summary of the optimal model.
Coefficients of the optimal Linear Regression Model predicting bilingual children’s accuracy score in the discourse semantics task

SUMMARY
In answer to our first research question, we have demonstrated that the BPI, as a gradient measure of language experience combining language exposure and use, is a significant predictor of several aspects of SL proficiency in the population under study. The BPI is the strongest child-related predictor in the SRep test (if scored based on the correct repetition of the target structure rather than full accuracy). It is also a strong predictor in the lexical semantic tests (the strongest predictor after cognitive flexibility) and in the discourse semantic test. Although the BPI indexes cumulative HL exposure and use in our models, the interpretation of its effect should not be that HL experience has a detrimental effect. The BPI was used as an indirect estimate of the amount of experience in the SL (as it is the inverse picture of HL experience in bilinguals). Therefore, our findings are in line with much previous research showing a positive association between amount of language input and use to performance on tests in the SL.
Furthermore, bilingual children’s SES is a significant predictor of performance in the SRep task and in the Discourse-Semantics tasks. It was found not to be a robust predictor in the Lexical Semantics tasks.
Children’s cognitive abilities were included as a covariates, and found to have an impact in all tasks (memory in most tests, and cognitive flexibility in those tests relying on inferencing abilities). Performance in the sentence comprehension task (the Sentence Structure task from the CELF) was correlated with cognitive predictors only, which we interpret as a problematic confound (see De Cat, 2019).
QUESTION 2: COMPARING ALTERNATIVE MEASURES OF LANGUAGE EXPERIENCE
Having demonstrated that a gradient, composite measure of language experience significantly predicts several aspects of bilinguals’ proficiency in the SL, we now turn to our second research question, which seeks to identify the optimal way of modelling language experience as a predictor of SL proficiency. We break it down into the following two questions, which we address in turn:
1. How does a combined measure of language experience (combining exposure and use) compare with simpler measures (i.e., exposure or use), as predictors of school language proficiency? Are cumulative measures more accurate than current measures, in predicting school language proficiency?
2. What is the specific impact of language use as a predictor of school language proficiency?
QUESTION 2.1: COST-BENEFIT ANALYSIS: WHICH LANGUAGE EXPERIENCE MEASURE TO USE AS A PREDICTOR?
The BPI indexes the cumulative amount of exposure and use of the HL, and it is strongly correlated with alternative measures of language exposure (see Figure 8). Our rationale in choosing the BPI as predictor over these alternative measures was based on a number of considerations: (a) calibrating language experience on the HL makes it possible to include monolinguals in the continuum “naturally” (as they have had zero experience of a HL different to English); (b) encompassing language use (as well as exposure) yields a more precise measure, which in turn should increase the power of our analyses; and (c) focusing on cumulative experience further increases the accuracy of the measure, as it reflects the quantitative effect of sequential bilingualism.Footnote 18 It is, however, possible that the higher level of precision of the BPI does not afford a substantial benefit over a simpler measure. In this section, we compare the BPI with simpler, alternative measures of language experience: cumulative exposure, cumulative use, current exposure, and current use.
To determine the optimal language experience measure predicting SL proficiency, we exploited the method described in Burnham and Anderson (Reference Burnham and Anderson2003): an information-theoretic approach to inform model selection and multimodel inference. Choosing between alternative statistical models requires estimating which of them best approximates the “true” process underlying the phenomenon under study. If several models compete closely, the “true” process should be inferred by combining the information from these models. In this approach, both processes are informed by the Akaike weight associated with statistical models.
The Akaike weight of a model is based on the AIC, which was defined previously as an indicator of the trade-off between the accuracy and the complexity of a given model (i.e., a measure of the relative goodness of fit of the model to reality). When considering two nested alternative models (i.e., models that differ only in the presence or absence of one or more variables), the model with the lowest AIC should be chosen as the best model.
By contrast, when several models need to be compared, AIC weights are used—under the assumption that one of the models in the set is the optimal model. These models can be nested or nonnested (i.e., including alternative predictors). AIC weights, therefore, indicate the strength of the evidence in favor of a model in a particular set of competing models (Burnham and Anderson, Reference Burnham and Anderson2003). The model with the highest AIC weight is taken as the one that best approximates the “true” process underlying the phenomenon under study, and the other models are evaluated in relation to that optimal model. This evaluation is based on Delta values, which correspond to the difference in AIC between the best model in the set and a particular competitor model. The following rules of thumb are usually applied to decide which models need to be considered along with the best model:
(14) AIC weights interpretation Burnham and Anderson (Reference Burnham and Anderson2003)
a. A model with a Delta value within 1‒2 of the best model has substantial support in the data, and should be considered along with the best model.
b. A Delta value within only 4‒7 units of the best model has considerably less support.
c. A Delta value > 10 indicates that the worse model has virtually no support and can be omitted from further consideration.
This method can be used for variable selection, that is, to determine which predictor variable has the greatest influence, among a set of competitors (Burnham and Anderson, Reference Burnham and Anderson2003). In our case, it can be used to compare the BPI with alternative language experience predictors. This is done by summing the Akaike weights of variables across all the models where the variables occur. The competing variables are then ranked using these sums. The larger this sum of weights, the more important the variable.
Following the method explained in the preceding text, we created a set of alternative models with the following alternative measures of language experience:
(15) a. The BPI
b. Cumulative exposure the school language (English)
c. Current exposure to the school language (English)
d. Cumulative use the school language (English)
e. Current use of the school language (English)
As all the children in this sample were exposed to two languages only, SL measures and HL measures are equivalent from a statistical modeling perspective (albeit yielding opposite coefficients). Here we report on the measures calibrated on the SL (English).
Using the optimal model for the bilingual children’s SRep data (reported in Table 7), we replaced the BPI with each of the preceding predictors in turn (i.e., refitting the model four times, once per predictor other than the BPI). As the models differed only with respect to the language experience measure, the one with the best fit can be considered the one with the most reliable predictor of language proficiency. The results of the comparison are summarized in Table 11, ordered by model weight.
Model selection for the effect of alternative measures of language experience (listed in column 1) on bilingual children’s language proficiency (indexed by the SRep score) fit to 2,477 observations (i.e., total 2,468 degrees of freedom) with 3,105 null deviance. The weight indicates the probability that the model is the best one in the set. Delta is the AIC difference of a model compared with the best one.

There is a 37% probability that the model using Cumulative English Exposure as a predictor is the best in the set. When the difference in AIC between two models (dAIC or Delta) is < 2, it is reasonably safe to consider that both models have approximately equal weight in the data (Burnham and Anderson, Reference Burnham and Anderson2003). There is strong evidence (Delta = 1.30) for the need to take Cumulative English Use into account alongside Cumulative English Exposure—which is in effect what the BPI does. With a Delta value of .30, the BPI can be considered to be roughly as good a predictor of English-language proficiency as Cumulative Exposure.Footnote 19 It has a 32% likelihood of being the best model in the set—which is not far off the 37% likelihood of the model based on Cumulative English Exposure.
The answer to first part of Research Question 2 (as to whether a simpler measure of language experience might fare better than a complex measure) is that the BPI, as a combined measure of cumulative language exposure and use, is not more informative as a predictor of SL proficiency, compared with a simple measure of cumulative language exposure. As explained in the preceding text, the BPI can be interpreted as a measure of cumulative exposure to the HL, adjusted for HL use: two children with the same amount of Cumulative HL Exposure will have a different BPI if one of them is relatively passive in the HL (i.e., if s/he tends to answer back in English when addressed in the HL). However, the additional information encapsulated in the BPI (compared with a simple measure of cumulative language exposure) does not improve its predictive potential. This could be because language use does not have much of an effect over and above that of language exposure.
With respect to the cumulative-current comparison, cumulative measures are indeed more informative than current measures, as predictors of SL proficiency.
We now turn to the second part of Research Question 2, regarding the specific impact of language use as predictor of SL proficiency.
QUESTION 2.2: TEASING APART THE EFFECT OF EXPOSURE AND USE
If the amount of language use (estimated from the parental questionnaires) was perfectly correlated to the amount of language exposure, it would not be possible to disentangle their effect statistically as predictors of language proficiency. In the group under study, however, an imbalance between language use and exposure is observed: many children tended to be relatively “passive” in their HL, as shown in Figure 10. Passivity reflects the extent to which the child used their HL in relation to the extent they were exposed to it, and it can be calculated by dividing Cumulative HL Use by Cumulative HL Exposure. Children with the highest score (100%) are as active in their HL as they are exposed to it. Lower scores indicate relative passivity in the HL: the child uses that language less than they are exposed to it (0% indicating no output in the HL at all, which was the case for nine children). Importantly, a high score does not necessarily correlate with a high amount of HL exposure in our population sample: high usage is observed across the whole range of HL exposure.
(Im)balance between cumulative use and cumulative exposure of the HL, ranging from an equal amount of both (100% active usage) to no use (total “passivity”).

Children who are relatively passive in their HL are (by implication) more active in their SL, as they answer back in English in some or all the contexts in which they are addressed in the HL. It is possible that this “extra” amount of English use confers a proficiency advantage in that language. This is what we investigate in the text that follows.
As explained in the “Methods of Analysis” section, it is not possible to include strongly correlated predictors in the same regression model, as is the case for our exposure and use measures. To remedy this problem, we derived a measure of the difference between Cumulative SL Exposure versus use (by subtracting Cumulative SL Exposure from Cumulative SL Use). This new measure, which we will call SL Difference, is significantly but only marginally correlated with Cumulative SL Exposure (r = ‒.19, p < .0001), which makes it possible to consider the two together in the same regression model.
We refitted the optimal model of the SRep accuracy data (by item), with Cumulative SL Exposure and SL Difference as language experience predictors. The effect of SL Difference was not significant (β = ‒.005, p = .84), and allowing for an interaction between Cumulative SL Exposure and SL Difference led to nonconvergence.
Given the lack of convergence with linear regression, we turned to a more powerful algorithm to investigate the relationship between SL exposure and use as predictors of SL proficiency.
The data was reanalyzed with a generalized additive mixed model (GAMM— Baayen, Vasishth, Kliegl, & Bates, Reference Baayen, Vasishth, Kliegl and Bates2017; Wood, Reference Wood2006) using the R-package “mgcv” (version 1.8-28). GAMMs are a variant of the linear models introduced in the preceding text. Nonlinear regression models operate according to the same broad principles as their linear variants, except that the regression line fitted through the scatterplot of observations can feature a certain amount of “wiggliness” instead of a straight line. The linear effects are included as parametric terms in the model (as previously mentioned), and the nonlinear effects are included as smooths.Footnote 20 The model has an in-built optimizer to avoid overfitting by allowing too much “wiggliness” in the smooths. In the model reported in the following text, the random effects were modeled as smooths. To probe the relationship (or lack thereof) between SL cumulative exposure and SL Difference, we allowed a nonlinear interaction of the two HL measures (Cumulative Exposure and HL Difference).
Allowing the nonlinear interaction of Cumulative SL Exposure and SL Difference did yield a significant improvement in model fit, compared with a nonlinear model without that interaction. The interaction between Cumulative SL Exposure and SL Difference reached a statistical significance (χ Footnote 2 = 10.45, edf = 3, p = .015), suggesting a crossover effect of exposure and use affecting mainly children with a high amount of cumulative exposure to the SL.
To test the robustness of the modest significance level of the interaction between language exposure and use, we fitted an alternative model allowing our other main environmental predictor of interest (i.e., SES) to interact nonlinearly with language exposure.
This alternative model revealed a much more important nonlinear interaction at play in the SRep data, which renders the impact of SL passivity nonsignificant (even in interaction with cumulative SL exposure): the nonlinear interaction between SES and cumulative SL exposure turns out to be the strongest predictor of accuracy in the SRep test (χ Footnote 2 = 30.69, edf = 3, p = .000001). Figure 11 shows that, at relatively low levels of cumulative exposure to the SL, SES does not confer an advantage in the SRep test; but at medium-to-high levels of cumulative SL exposure, accuracy in the SRep test is strongly correlated with SES.
Nonlinear interaction between Cumulative SL Exposure and SES as predictors of bilingual children’s accuracy in the SRep task estimated through a GAMM. Average SRep performance corresponds to 0 on the color gradient.

SUMMARY
In answer to Research Question 2, we have demonstrated that cumulative exposure to the SL is the best predictor of proficiency in that language, both compared with current measures and compared with a combined measure of cumulative exposure and use. In attempting to tease apart the impact of language exposure and language use, we discovered that language use was not a robust predictor of SL proficiency. The marginally significant nonlinear interaction between language exposure and use was trumped by a very strong nonlinear interaction between language exposure and SES. Children with below-average exposure to the SL did not benefit from an SES advantage (in terms of proficiency score). But in children with above-average exposure to the SL, performance improved exponentially as the levels of language exposure and SES increased.
We now turn to the “catch up” question (Research Question 3): From what amount of cumulative exposure to the SL do bilingual children perform within the monolingual range?
QUESTION 3: CRITICAL THRESHOLDS OF LANGUAGE EXPERIENCE
Even within the same age group, monolingual children vary in terms of language proficiency (see Kidd, Donnelly, & Christiansen, Reference Kidd, Donnelly and Christiansen2018 for a recent review). Identifying what counts as monolingual-like performance needs to take that variability into account. One approach in the literature has been to rely on a threshold of 1.25 standard deviation below the mean to identify monolingual children at risk of a Developmental Language Disorder (Conti-Ramsden, Reference Conti-Ramsden2003; Tomblin, Records, & Zhang, Reference Tomblin, Records and Zhang1996). Any proficiency score above that threshold is considered “normal,” which suggests a substantial amount of variation within the “normal” range. Our purpose here is not to identify Developmental Language Disorder among bilinguals, but to identify bilinguals who have caught up with their monolingual peers in the SL. One might suggest that this would require them to score above the ‒1.25 SD threshold (defined in relation to the mean achieved by their monolingual peers).
Instead of relying on an arbitrary threshold on raw scores (such as ‒1.25 SD), we propose to use an objective, data-driven method to identify the threshold in language experience beyond which bilingual children can be expected to perform within the monolingual range in terms of proficiency in the SL. This method will allow us to control for the other factors that we know have a significant impact on language proficiency, such as SES and cognitive factors.
In the following text, we carry out the threshold analysis based on cumulative exposure to the SL (i.e., an additive measure) and on language dominance (i.e., a proportion measure) in turn, to address the role of cumulative exposure and language dominance.
CUMULATIVE EXPOSURE THRESHOLDS
Our starting point is the optimal (nonlinear, mixed-effect) model for the SRep data, which had been fitted to the target accuracy data for the bilingual children only. We rely on cumulative exposure as our reference measure for bilingual language experience, as this proved the best predictor in the population under study. We first refit this model to the entire cohort of children (including monolinguals)—using exposure to English as a predictor. When the model is fitted to the entire cohort using that predictor, age no longer accounts for any unique variance. We therefore exclude it from the model. After confirming the significance of the nonlinear interaction between SES and Cumulative SL exposure in the whole-cohort model (not reported here), we perform the threshold analysis, as explained in the following text.
The procedure for the threshold analysis consists in replacing the continuous SL exposure predictor with a binary one, for which the cutoff point would be determined objectively, based on Information Theory. To identify the optimal cutoff point, we refit the model recursively, using each time a different SL exposure value as the binary cutoff point. As the cumulative SL experience measure features 70 different values in the group under study, the model needs to be fitted 70 times. Plotting the AIC values for all the models (shown in Figure 12) shows the fluctuations in model fit depending on SL exposure threshold. The lowest AIC value identifies the model with the best fit. The cutoff point for that model is interpreted as the amount of exposure beyond which a bilingual child can be expected to perform within the monolingual range.
Optimal threshold of cumulative SL exposure above which bilinguals perform within the monolingual range in the SRep task. The continuous line represents fluctuations in AIC (indicating model fit) depending on where the cutoff point is situated along the SL exposure continuum. The dashed line indicates the lowest AIC, corresponding to the best-fitting model, and hence the optimal cutoff point.

The optimal cutoff point on the continuum of SL cumulative exposure is at 33 months equivalent (where the dashed line falls in Figure 12). The model therefore predicts that a (5- to 7-year-old) bilingual child who has been exposed to the SL for the equivalent at least 33 months can be expected to perform within the monolingual range (after controlling for SES and memory abilities) in the SRep task.
The same procedure is then repeated for the other aspects of English proficiency we assessed in this study.Footnote 21 This results in the following thresholds of cumulative SL exposure: lexical semantics (composite DELV score): 44 months equivalent; discourse semantics: 32 months equivalent (see Figure 13).
Optimal threshold of cumulative SL exposure above which bilinguals perform within the monolingual range in the lexical semantics and discourse-semantics tasks. The continuous lines represent fluctuations in AIC (indicating model fit) depending on where the cutoff point is situated along the SL exposure continuum. The dashed lines indicate the lowest AIC, corresponding to the best-fitting models.

The overall picture, when combining the information from the three preceding analyses, is that from 32 or 33 months equivalent of cumulative exposure to the SL, bilingual children (between 5 and 7 years of age) perform within the range of monolingual children in some aspects of language proficiency (indexed by the lexical semantics and the SRep tasks). The discourse semantics results suggest a more conservative threshold of 44 months equivalent (with respect to lexical semantics).
In the next section, we compare our threshold analysis to a more traditional approach based on language dominance.
LANGUAGE DOMINANCE THRESHOLDS
In the literature on bilingualism, it is common practice to consider that, below 20% of current exposure to an additional language, children should be considered “functionally monolingual” in their dominant language (e.g., Bedore et al., Reference Bedore, Peña, Summers, Boerger, Resendiz, Greene, Bohman and Gillam2012; Gutiérrez-Clellen and Kreiter, Reference Gutiérrez-Clellen and Kreiter2003; Pearson et al., Reference Pearson, Fernández, Lewedeg and Oller1997). As its name indicates, functional monolingualism implies that the child should perform within the monolingual range in terms of language proficiency.
Assuming that cumulative language exposure is a reliable proxy for language dominance (as demonstrated by Unsworth, Reference Unsworth, Silva-Corvalán and Treffers-Daller2015), we operationalized language dominance as the proportion of cumulative exposure to the SL out of the child’s lifetime (in months). We then replicated the threshold analyses above using that estimate of language dominance as our predictor of interest.
The threshold analysis of the SRep data using language dominance as predictor of interest suggests a cutoff point of 57% dominance in the SL (in 5 to 7 year olds).
Figure 14 compares the threshold based on the additive measure (corresponding to the horizontal line) with the threshold based on the proportional measure (cf. the vertical line). A number of data points are found in the top left quadrant, corresponding to the children that are predicted to perform within the monolingual range according to the additive threshold, but not according to the proportional threshold. The threshold analysis based on language dominance is therefore more conservative than that based on the cumulative measure of language exposure.
Cumulative exposure to the SL expressed in months equivalent (y-axis) and as a proportion of total language exposure (x-axis). The lines indicate the threshold of exposure required for monolingual-like performance in the SRep test.

Figure 15 compares Bedore et al.’s categories with our objective threshold for monolingual-like performance.
Comparison of Bedore et al.’s language dominance categories and a continuous measure of language dominance based on cumulative exposure to the SL (in months equivalent). The horizontal line indicates the threshold of exposure required for monolingual-like performance in the SRep test.

SUMMARY AND DISCUSSION
The discussion is organized around our three research questions, which are repeated in the following text for clarity.
Research Question 1: Does a gradient measure of bilingual language experience (combining exposure and use) and a gradient measure of SES (as a proxy for the richness of the child’s language environment) significantly predict the following aspects of SL proficiency: comprehension and production of complex sentences, lexical semantics, and discourse-semantics? We proposed a gradient measure combining cumulative HL exposure and use (the BPI) and demonstrated that it significantly predicts 5- to 7-year-old bilingual children’s proficiency in the SL. This finding was replicated with respect to different aspects of English proficiency, including morpho-syntax (indexed by the LITMUS SRep test), lexical semantics (indexed by the DELV lexical tests), and discourse-semantics (indexed by the DELV articles test). Our results are in line with a substantial body of research demonstrating the impact of language exposure on language proficiency in bilinguals (see Paradis, Reference Paradis2017 for a recent review), and expand on the bulk of these studies by considering a range of proficiency measures.
Some aspects of language were found to be more sensitive than others to language exposure. Functional errors in the SRep task were predicted by language experience more strongly than lexical errors, while inflectional errors were not predicted by language experience at all, suggesting that a sufficient amount had already been received by most children in this study to acquire those aspects of English grammar. This is in line with studies showing that the nonuniform impact of language exposure on different aspects of grammar reflects their acquirability (Schulz & Grimm, Reference Schulz and Grimm2019; Tsimpli, Reference Tsimpli2014).
Children’s SES was a significant source of substantial individual differences, over and above the effect of the cognitive predictors (which are independently known to correlated with SES—see e.g., Gathercole et al., Reference Gathercole, Kennedy and Môn Thomas2016). Along with many others (e.g., Bohman et al., Reference Bohman, Bedore, Peña, Mendez-Perez and Gillam2010; Hoff, Reference Hoff2013; Meir and Armon-Lotem, Reference Meir and Armon-Lotem2017), we interpret SES as a proxy for the richness of the (linguistic) environment experienced by the child, which results in qualitative and quantitative differences in children’s language experience. Further research will be required to identify which of the correlates of SES genuinely explains the nature of its effect. One potentially important factor that we did not consider in the present study is the home literacy environment and the extent to which reading and writing in the HL and/or the SL correlates with SES and in turn affects children’s language skills. Brinchmann, Braeken, and Lyster (Reference Brinchmann, Braeken and Lyster2019), for instance, argue that the home literacy environment accounts for individual differences in vocabulary and grammar in preschool monolingual children. A hypothesis for future research is whether (and to what extent) the amount and diversity of literacy activities explain the relationship between SES and language proficiency in bilingual children.
SES was found to predict children’s performance in the SRep task and in the discourse semantics tasks, but not in the lexical semantics tasks. We speculate that this could be due to the very strong impact of cognitive predictors on the latter measures. SES is a strong predictor of performance on cognitive flexibility (as demonstrated by De Cat, Gusnanto, & Serratrice, Reference De Cat, Gusnanto and Serratrice2018 for this group of children), and might therefore have only an indirect impact on performance in the lexical semantics task.
An important finding of this study is that SES interacts with language experience in a complex way, which we modeled as the nonlinear interaction of SES and cumulative exposure to the SL: the extent to which SES confers an advantage in terms of SL proficiency depends on the amount exposure to that language. In our sample, children with below-average cumulative exposure to the SL hardly benefited from any SES advantage, whereas at higher levels of cumulative exposure to the SL, that advantage grew exponentially in relation to SL exposure. In other words, SES was only associated with a higher proficiency score in the children who had received a substantial amount of exposure to the SL over their lifetime. What our cross-sectional study was not able to investigate is the possibility that children from higher SES might be able to catch up faster with their monolingual peers. This will need to await future research based on longitudinal data.
Research question 2 sought to identify the optimal way of modeling language experience, as a predictor of SL proficiency. We investigated it in three steps.
How does a combined measure of language experience (combining exposure and use) compare with simpler measures (i.e., exposure or use), as predictors of SL proficiency? Adopting an information-theoretic approach, we found that a more precise measure of cumulative language experience (the BPI, which encompasses exposure and use) did not improve predictive accuracy compared with a simpler measure of cumulative HL exposure. This finding will be discussed in relation to the issue of language exposure versus use in the following text.
Are cumulative measures more accurate than current measures, in predicting SL proficiency? To our knowledge, this is the first study to systematically compare different measures of language experience as predictors of language proficiency in bilingual children (i.e., current exposure, current use, cumulative exposure, cumulative use, and a combined measure of cumulative exposure and use). Our information-theoretic comparison demonstrated that cumulative experience measures fare better as predictors of language proficiency than current experience measures. Future research will be needed to determine if this is the case in older age groups as well.
What is the specific impact of language use as a predictor of SL proficiency? Analyses using decorrelated measures confirmed that there was no robust evidence for an effect of language use over and above the effect of exposure to the SL. In other words, if a child uses the SL even in (some of) the contexts in which they are addressed in the HL, that “extra” use does not confer a tangible advantage in terms of SL proficiency. This is likely due to the leveling effect of schooling, and/or possibly to the fact that the children’s English utterances in HL contexts are not elaborated upon in English by their interlocutor. We hypothesize that language use will, however, be a significant predictor of proficiency in the HL (as many children were relatively “passive” in that language). The BPI might thus prove to be more accurate in predicting home language proficiency. This could not be investigated in this study, given the number of HLs represented in our sample.
Research question 3 focused on the identification of functional thresholds in bilingual language experience in relation to SL proficiency: What is the critical amount of SL experience required for bilingual children to perform within the monolingual range? In other words: At what point can one expect the gap between bilinguals and monolinguals to be “closed” in the SL? We exploited an objective, data-driven method to investigate this based on (a) an additive measure of language experience and (b) a language dominance measure.
Once SES and cognitive abilities have been taken into account, the threshold of exposure required for bilingual children to perform within the monolingual range was found to vary depending on the proficiency measure. The measures of discourse semantics (indexed by the mastery of definiteness distinctions) and complex morpho-syntax (indexed by the SRep task) showed that children performed within the monolingual range from 32 or 33 months-equivalent of exposure to the SL. A more conservative threshold of 44 months-equivalent was suggested by the lexical semantics measure. It is not surprising to find that different aspects of language proficiency show different levels of sensitivity to language exposure, as already alluded to previously. Jia and Paradis (Reference Jia and Paradis2017) show that morpho-syntactic structures encoding whether a referent is new or old information can be acquired by bilingual children even with limited language exposure. This is consistent with our finding that the lowest amount of exposure to English required for performance within the monolingual range was observed in the discourse-semantics task (which tested children’s knowledge of the a/the distinction in English). However, the higher threshold observed with respect to the lexical semantics measure needs to be interpreted with caution. That test proved the most challenging both for bilinguals and monolinguals (with a mean overall score of 63% in the monolinguals, compared with 81% in the SRep test, 83% in the sentence comprehension test, and 77% in the discourse-semantics test), and it is possible that the higher threshold might in fact be due to age as a latent variable (which in turn could be due in part to the cognitive demands of the task).
If expressed in terms of language dominance (rather than cumulative experience), our results indicate that, in this age group, children with at least 57% of exposure to the SL (averaged over their lifetime) are likely to perform within the monolingual range. This aligns closely with the 60% threshold suggested for toddlers by Cattani et al. (Reference Cattani, Abbot-Smith, Farag, Krott, Arreckx, Dennis and Floccia2014), but is more lenient than an 80% language exposure cutoff point commonly used for “functional monolingualism.”
The approach adopted by Bedore et al. (Reference Bedore, Peña, Summers, Boerger, Resendiz, Greene, Bohman and Gillam2012) is more lenient too, but for a different reason. For them, functional monolingualism obtains if there is at least 80% exposure to or use of a language (and 20% or less exposure or use of another language). This disjunctive criterion gives equal weight to exposure and use: if either falls below 20%, the child is categorized as functionally monolingual in their other language. According to the criteria proposed by Bedore et al. (Reference Bedore, Peña, Summers, Boerger, Resendiz, Greene, Bohman and Gillam2012), 41 of the 87 bilinguals in our sample would be classified as functionally monolingual in English. Yet, many children in that group perform below the monolingual range, as identified by our threshold analyses (see Figure 15).
One reason for this discrepancy could be that Bedore et al.’s classification of language dominance is based on current language experience, which we have seen is less informative a predictor of language proficiency than cumulative language experience in our sample. Another, likely more important, reason is that their classification assigns equal weight to language exposure and language use, as explained in the preceding text. While we agree it is important to take language use into account, it appears not to have much impact on proficiency in the SL, as pointed out above. Further research will be required to determine objectively the relative importance of language exposure and use as components of bilingual language experience. For instance, language use is likely to have a significant impact on proficiency in the HL, and possibly on executive functions in the cognitive domain. The investigation of phenomena that are sensitive to language use (over and above language experience) will provide fertile grounds to evaluate how it should be modeled. Should language use and exposure have equal weight, as proposed by Bedore et al. (Reference Bedore, Peña, Summers, Boerger, Resendiz, Greene, Bohman and Gillam2012)? Or should it have a weaker impact, as modeled in our BPI? We leave it to future research to evaluate the merit of each approach, including whether the language of the conversational partner has an impact.
Finally, three cautionary notes are in order, regarding the interpretation of our findings.
First, while critical thresholds can be useful for practical purposes (e.g., selection criteria for experimental studies, or the identification of children in need of support with their SL), we agree with Treffers-Daller (Reference Treffers-Daller, Silva-Corvalán and Treffers-Daller2015), Luk (Reference Luk2015), and many others that language dominance and bilingualism are best treated as continua rather than discrete categories.
Second, the functional thresholds identified need to be interpreted in light of other significant predictors, that is, SES and cognitive factors. For instance, a child with more than 60% exposure to the SL over her lifetime will not necessarily score within the monolingual range of proficiency if she comes from a deprived background. All the proficiency tests used in this study required a certain amount of cognitive effort, and this induced a significant amount of individual variation in the scores. STM had a significant impact on performance in the SRep testFootnote 22 and the lexical-semantic tests. WM had a significant impact on performance in the lexical semantic tasks, but not the SRep task nor the discourse semantic task. The Sentence Structure test of the CELF proved to be more sensitive to children’s cognitive abilities than to their mastery of complex syntax, due to an overwhelming confound caused by the cognitive demands of the task (see De Cat, 2019). It was therefore not discussed in this article.
Third, the children in this study were all in the early stages of formal education, and most bilinguals will have caught up with their monolingual peers by the end of primary school—except if part of an at-risk group (which we were not able to investigate here; see Strand & Demie, Reference Strand and Demie2005). Although bilingualism might result in an apparent delay in terms of SL proficiency in the early years of formal education, it tends to turn into an asset once the proficiency gap between monolinguals and bilinguals has narrowed sufficiently (or closed). If bilingual children are compared with monolinguals of similar levels of English proficiency, the bilingual group already shows an advantage in social, emotional, and behavioral functioning in Reception year (around 5 years of age), and a functional advantage in meeting curriculum targets at Year 2 (around 7 years of age)—see for example, Dowdy, Dever, DiStefano, and Chin (Reference Dowdy, Dever, DiStefano and Chin2011); Halle, Hair, Wandner, McNamara, and Chien (Reference Halle, Hair, Wandner, McNamara and Chien2012); and Whiteside, Gooch, and Norbury (Reference Whiteside, Gooch and Norbury2017).
Investigating language development in its linguistic and cognitive complexity in a heterogeneous population of children presents nontrivial challenges. The analytical approach taken here goes some way to propose a solution to dealing with complex data and to making sense of the multifaceted bilingual experience that is common in many schools today.
SUPPLEMENTARY MATERIAL
To view supplementary material for this article, please visit https://doi.org/10.1017/S0272263119000597