INTRODUCTION
Ample evidence suggests that many animal taxa have already been affected by changes in climate over the past half century (Walther et al., Reference Walther, Post, Convey, Menzel, Parmesan, Beebee, Fromentin, Hoegh-Guldberg and Bairlein2002; Parmesan and Yohe, Reference Parmesan and Yohe2003; Parmesan, Reference Parmesan2006; Chen et al., Reference Chen, Hill, Ohlemüller, Roy and Thomas2011). Most responses to anthropogenic climate change have included phenological changes (Parmesan, Reference Parmesan2006; Cook et al., Reference Cook, Wolkovich, Davies, Ault, Betancourt, Allen and Bolmgren2012), continued decreasing abundance for many populations (Ceballos et al., Reference Ceballos, Ehrlich, Barnosky, García, Pringle and Palmer2015), and range shifts (McLaughlin et al., Reference McLaughlin, Hellmann, Boggs and Ehrilch2002). The responses of animals to future climate change will probably include further changes in abundance or distribution (Jackson and Overpeck, Reference Jackson and Overpeck2000; Lyons, Reference Lyons2003, Reference Lyons2005; Williams and Jackson, Reference Williams and Jackson2007). However, estimates suggest that more than half of terrestrial ecosystems worldwide have been altered by humans (Ellis et al., Reference Ellis, Goldewijk, Siebert, Lightman and Ramankutty2010), restricting the ability of species to shift their geographic ranges or elevational limits to areas with more favorable conditions (Rowe and Terry, Reference Rowe and Terry2014; Selwood et al., Reference Selwood, McGeoch and MacNally2015).
Despite the general perception that adaptation operates at time scales too slow for populations to cope with anthropogenic climate change (e.g., Bradsahw and Holzapfel, Reference Bradsahw and Holzapfel2006; Huntley, Reference Huntley2007; Hoffmann and Sgro, Reference Hoffmann and Sgro2011; Hetem et al., Reference Hetem, Fuller, Maloney and Mitchell2014), several studies suggest that small vertebrate populations can adapt locally to increased temperature within a couple of decades (Haugen and Vøllestad, Reference Haugen and Vøllestad2000). These studies have prompted greater appreciation for the adaptive potential—specifically through morphological change—of species (Smith et al., Reference Smith, Betancourt and Brown1995; Smith and Betancourt, Reference Smith and Betancourt2006; Blois and Hadly, Reference Blois and Hadly2009; Bell and Gonzalez, Reference Bell and Gonzalez2011; Hoffmann and Sgro, Reference Hoffmann and Sgro2011; McCain and King, Reference McCain and King2014).
Body size is a heritable (>80% broad-sense heritability; Smith et al., Reference Smith, Brown, Haskell, Lyons, Alroy, Charnov and Dayan2004) and easily measured morphological trait that interacts with the thermal environment in mammals (Scholander et al., Reference Scholander, Hock, Walters and Irving1950). In fact, it has been observed that the majority of mammals (~70%) conform to an ecogeographic pattern known as Bergmann's rule (Millien et al. Reference Millien, Lyons, Olson, Smith, Wilson and Yom-Tov2006), wherein populations within species (or species within a genus) are smaller bodied in warmer habitats and larger bodied in cooler habitats (Bergmann, Reference Bergmann1847; Mayr, Reference Mayr1956). Bergmann's rule is thought to be driven by differential mortality of larger individuals during warmer periods and/or smaller individuals not surviving during cooler periods (Murray and Smith, Reference Murray and Smith2012). Given that macroevolutionary work for mammals suggests that evolutionary decreases in body size are easier to achieve than increases (Evans et al., Reference Evans, Jones, Boyer, Brown, Costa, Ernest and Fitzgerald2012), mammals may show an asymmetrical response to climate change in which populations decrease mean body size in response to warming more quickly and consistently than increasing mean population body size during cooling episodes.
Climatic changes of magnitude and rates comparable to those predicted for future climate change (2°C–4.5°C; Stocker et al. Reference Stocker, Qin, Plattner, Tignor, Allen, Boschung, Nauels, Xia, Bex and Midgley2013) scenarios have occurred in the recent past. For example, the late Quaternary (the past ~0.5 ka to 1.0 Ma) encompasses the last glacial maximum (~21.5 ka), the subsequent deglaciation and accompanying warming, and the generally cooler conditions during the Younger Dryas climate reversal (12.9–11.7 ka) (Alley et al. Reference Alley, Marotzke, Nordhaus, Ovepeck, Peteet, Pielke and Pierrehumbert2003), which was followed by abrupt warming at the beginning of the Holocene (last 11.7 ka). Virtually all extant taxa successfully coped with significant temperature shifts during the late Quaternary (Hof et al., Reference Hof, Levinsky, Araújo and Rahbek2011). In response to past climate change, populations both shifted their geographic ranges (Graham, Reference Graham, Diamond and Case1986; Jackson and Overpeck, Reference Jackson and Overpeck2000; Lenoir and Svenning, Reference Lenoir and Svenning2015) and/or appeared to have adapted, as in the case of woodrats (Neotoma) (Smith and Betancourt, Reference Smith and Betancourt2006).
The bushy-tailed woodrat (Neotoma cinerea) is a small rodent found throughout western North America during the late Quaternary. Populations of N. cinerea conform to Bergmann's rule both spatially and temporally (Brown and Lee, Reference Brown and Lee1969; Smith et al., Reference Smith, Betancourt and Brown1995). Previous work has shown that in response to a general warming trend over the late Quaternary, represented by paleomiddens, N. cinerea populations responded by expanding their geographic range northward and contracting in the south (Harris, Reference Harris1984b), and they adapted in the direction predicted by Bergmann's rule at many localities (Brown and Lee, Reference Brown and Lee1969; Smith and Betancourt, Reference Smith and Betancourt2006). Therefore, this group is ideal for testing whether populations respond more consistently and in pace with warmer or cooler environments.
Here, we refine the approach taken by Smith and Betancourt (Reference Smith and Betancourt2006) to further examine the adaptive capability of N. cinerea to late Quaternary climatic fluctuations. We use presence/absence of N. cinerea middens to test whether populations showed asymmetry in response to warm versus cold temperatures. Additionally, we use established methods for estimating population body size to characterize the potential asymmetry in the morphological response to warming versus cooling temperatures. Specifically, we ask: (Q1) Were populations able to cope equally well, as demonstrated by presence, during warmer or cooler temperatures and warming or cooling events over the late Quaternary? If temperatures exceed species’ ability to adapt in situ, then populations would be extirpated and fewer middens than expected would be recovered. (Q2) Did the ability of populations to remain extant (persist) vary with position within their modern geographic range? Populations at the periphery of the range, possibly already at their thermal limits, may not be able to cope with extreme cooling (e.g., northern populations) or warming (e.g., southern populations). (Q3) Was the direction, magnitude, or rate of climatic shifts ever too great or too rapid for populations to adapt via body size? Given the asymmetry in body-size macroevolution, we expect the pace of body-size change to be quickest during body-size decreases, which tend to be during warming periods. (Q4) Which of the strategies (body-size change, geographic range shift, elevational shift) for responding to future climate change is most likely for populations of N. cinerea? We expect that, given the pace and magnitude of future climate change, populations will not have time to move their geographic or elevational extent, but rather will first experience a shift in mean population body size.
MATERIALS AND METHODS
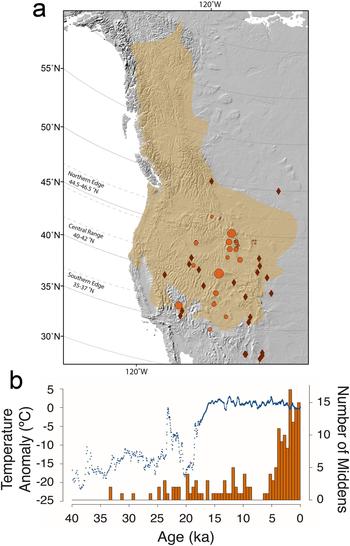
Our analysis employs the midden record created by N. cinerea, the largest and most cold-tolerant species of North American Neotoma species. Their current distribution ranges from the Canadian Arctic to the Colorado Plateau (Hall, Reference Hall1981; Betancourt et al., Reference Betancourt, Devender and Martin1990), but was shifted considerably southward during cold intervals (Harris, Reference Harris, Genoways and Dawson1984a, Reference Harris1993; Smith, Reference Smith1997) (Fig. 1a). All Neotoma species construct middens, or debris piles, that become indurated with crystallized urine or “amberat” and can be preserved for thousands of years in caves and rock shelters of arid and semiarid areas of the world (Betancourt et al., Reference Betancourt, Devender and Martin1990). A midden is typically occupied by a single individual at a time, but is successively used, and thus represents many consecutive generations (Betancourt et al., Reference Betancourt, Devender and Martin1990), which we refer to as a population. It is estimated that each midden is occupied for 10–50 years. However, we did not use middens that were clearly reworked or otherwise compromised (Betancourt et al., Reference Betancourt, Devender and Martin1990).
Location and spatiotemporal extent of middens included in the study. (a) Spatial distribution of Neotoma cinerea middens (orange circles) and fossil occurrences (brown diamonds) across the western United States. The sizes of the orange circles are scaled by number of middens recovered from each location, with the smallest being 1 and the largest >10. Tan area represents the current geographic range of N. cinerea. The dashed lines are the boundaries of the northern edge (44.5–46.5°N), central range (40–42°N), and southern edge (35–37°N). (b) Sampling of middens in 500-yr bins throughout the late Quaternary from 40 ka to modern (orange histogram) with the GISP2 ice-core temperature anomaly overlaid (blue). (For interpretation of the references to color in this figure legend, the reader is referred to the web version of this article.)

Hundreds of fecal pellets are preserved in each midden. Studies have shown that the width of fecal pellets is a robust proxy for body size (Smith, Reference Smith1995; Smith and Betancourt, Reference Smith and Betancourt2006).
Middens, covered in amberat, were soaked for several days (Smith and Betancourt, Reference Smith and Betancourt2006). The middens were then dried and sieved to separate the fecal pellets from the associated material in the midden (Betancourt et al., Reference Betancourt, Devender and Martin1990; Smith and Betancourt, Reference Smith and Betancourt2006). The 200 pellets with the largest width were used to estimate body mass (Smith et al., Reference Smith, Betancourt and Brown1995, Reference Smith, Browning and Shepherd1998; Smith and Betancourt, Reference Smith and Betancourt2003). Taking the largest pellets ensures that we are measuring adults and N. cinerea rather than other species. Still, the data only include middens with mass estimates greater than 325 g to ensure that no other contemporaneous Neotoma species (N. lepida or N. mexicana, both smaller than 250 g [Finley, Reference Finley1958; Verts and Carraway, Reference Verts and Carraway2002; Smith and Betancourt, Reference Smith and Betancourt2003]) were erroneously included in our analyses. Pellets from middens were independently radiocarbon dated. Radiocarbon dates were calibrated to calendar years (yr) following Fairbanks et al. (Reference Fairbanks, Mortlock, Chiu, Cao, Kaplan, Guilderson and Fairbanks2005). Our data set includes 189 radiocarbon-dated middens from 34 localities spanning the limits of N. cinerea’s modern geographic range and what would have been the central to northern limits of the species’ geographic range in the contiguous United States during the late Pleistocene (Smith, Reference Smith1997, Fig. 1a, Supplementary Table S3).
Midden presence is not evenly distributed across the last 25 ka (Fig. 1b). However, the decay function of midden preservation remains unknown. Partly, this is because decay rates may be site specific. Middens in caves and rock shelters that are more exposed would not be preserved. For example, middens at lower elevations in Titus Canyon in Death Valley, California, would have been erased by periodic flooding events, and we would therefore not be able to recover a record of those paleomiddens. Similarly, middens in the northern part of the geographic range may have been erased due to repeated freezing events. Further, older middens are rare in areas with higher effective moisture (cooler summers and, in some cases, more precipitation) such as northern and high-elevation sites (Betancourt et al., Reference Betancourt, Devender and Martin1990). Therefore, the midden record potentially has false absences at certain sites. To assess the validity of absences in the paleomidden record, we refer to fossil occurrences from the Neotoma Database (Williams et al., Reference Williams, Grimm, Blois and Charles2018, Fig. 1a, Supplementary Table S2) as a second line of evidence to check whether an absence of N. cinerea populations in the midden record is truly an absence. If both fossils and middens are absent during a particular interval in a region, then that bolsters the inference that N. cinerea populations were absent/extirpated.
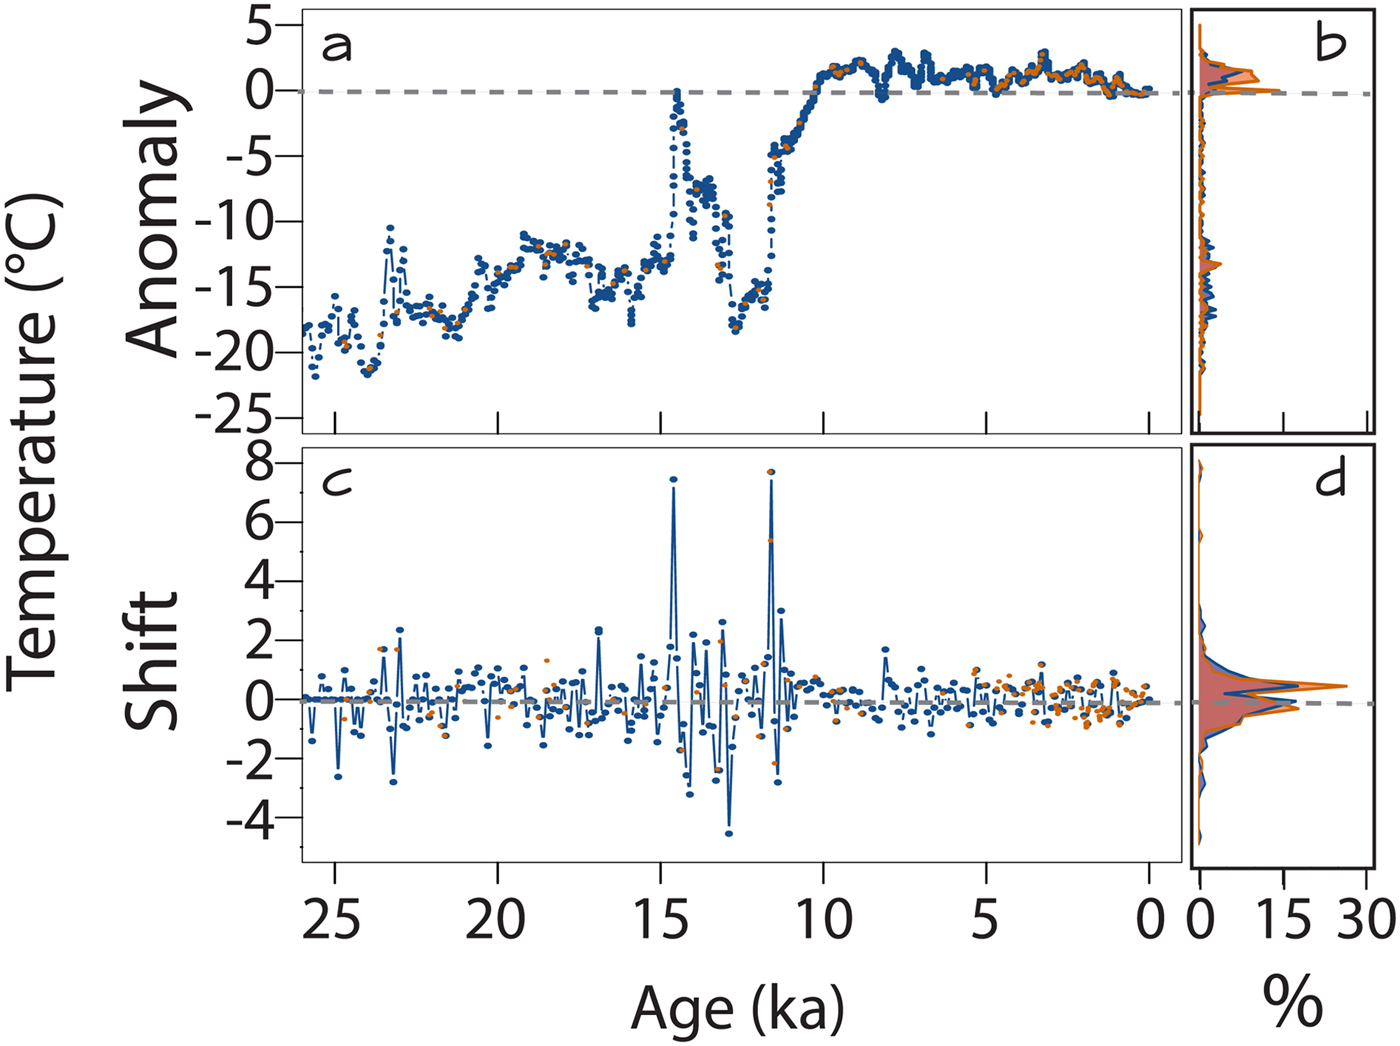
Most middens in our data were recovered from the middle to late Holocene (last 5 ka; n = 104/164) (Fig. 1b), an interval with generally warmer temperatures than temperatures from 25 ka to 5 ka. This phenomenon, in which younger fossils, or middens, are more likely to be recovered than older ones, which have a greater chance of degrading, is found in many paleontological studies and is termed the “pull of the recent” (Raup, Reference Raup1979). Both our study and previous studies find that younger middens are more common than older ones when examining the last 20 ka of the N. cinerea midden record (Betancourt et al., Reference Betancourt, Devender and Martin1990). For our study, not correcting for the pull of the recent may yield an erroneous signal of increased midden formation occurring during warmer climates (Fig. 2d). To ameliorate any bias caused by the high preponderance of middens recovered over the last 5 ka—when temperatures were warmer—we used a sliding window of 5-ka intervals and tested the distribution of temperatures and temperature shifts within each iterative window. Additionally, we binned midden occurrences into three different latitudinal bands containing ~30 middens that encompass regions in which animals may respond differently to climate—southern (35–37°N), central (40–42°N), and northern (44.5–46.5°N)—and assessed regional differences in the response to climate change (Fig. 1a).
Comparison of 100-yr binned temperatures and shifts and the midden-centered binned temperatures and shift: 100-yr binned GISP2 temperature anomalies (blue); estimated temperature when a midden was formed using 100-yr bins centered around the midden radiocarbon date (orange). (a) Comparison of binned temperature record in 100-yr binned temperatures and the midden-centered binned temperatures (i.e., presence of middens). Middens were recovered throughout the range of temperatures estimated using the GISP2 ice-core temperature data over the late Quaternary. (b) Frequency distribution of 100-yr binned temperatures and midden-centered binned temperatures for all temperatures experienced. (c) Comparison of 100-yr binned temperature shifts (blue) and midden-centered binned temperature shifts (orange). (d) Frequency distribution of 100-yr binned temperature shifts and midden-centered binned temperature shifts. (For interpretation of the references to color in this figure legend, the reader is referred to the web version of this article.)

Temperature records were obtained from the Greenland Ice Sheet Project 2 (GISP2), which provides the best well-resolved, continuous, empirical, global temperature proxy spanning the late Quaternary (Cuffey and Clow, Reference Cuffey and Clow1997; Alley, Reference Alley2000). Although climate change is not uniform across space (Sandel et al., Reference Sandel, Arge, Dalsgaard, Davies, Gaston, Sutherland and Svenning2011), the GISP2 record captures the major features of millennial-scale temperature variations across the Northern Hemisphere over this time interval (Viau et al., Reference Viau, Gajewski, Sawada and Fines2006; Clark et al., Reference Clark, Shakun, Baker, Bartlein, Brewer, Brook and Carlson2013). Finer-scale temperature reconstructions from pollen (century to millennial scale) or tree rings (annual to decadal scale) averaged for temperature across North America are available for some locations and provide more accurate representations of temperature at local scales (Porinchu et al., Reference Porinchu, MacDonald, Bloom and Moser2003; Salzer and Kipfmueller, Reference Salzer and Kipfmueller2005; Potito et al., Reference Potito, Porinchu, MacDonald and Moser2006; MacDonald et al., Reference MacDonald, Moser, Bloom, Porinchu, Potito, Wolfe, Edwards, Petel, Orme and Orme2008; Reinemann et al., Reference Reinemann, Porinchu, Bloom, Mark and Box2009, Reference Reinemann, Porinchu, MacDonald, Mark and DeGrand2014; Salzer et al., Reference Salzer, Bunn and Hughes2013), but they are extremely patchy in their temporal and spatial coverage (Viau et al., Reference Viau, Gajewski, Sawada and Fines2006). Because the interest is in whether paleomiddens are recovered more often during intervals with relatively warm- or cool-temperature regimes, the GISP2 temperature record is adequate. Given the generality of the GISP2 temperature record, if middens are not present during certain intervals with warmer or colder temperatures, then either taphonomic bias of the preservation of middens or local climate influenced their ability to persist and, therefore, their presence.
We calculated the temperature anomaly as the difference from the temperature mean for the last 1 ka in the GISP2 temperature record (following Jouzel et al., Reference Jouzel, Masson-Delmotte, Cattani, Dreyfus, Falourd, Hoffmann and Minster2007). The GISP2 temperature data were averaged across 100-yr bins (referred to as 100-yr binned temperature). Due to the nature of ice-core data, the temperature record is better resolved toward the present, and so the number of temperature records per bin increases as time approaches the present. To make temperature and midden records comparable, we also averaged ± 50 years of temperature anomalies centered on calibrated age of the midden to estimate the temperature during midden formation (referred to as midden-centered averaged temperature). Although binning or averaging dampens some high-amplitude, low-frequency temperature spikes, it generally corresponds to the temporal uncertainty around the midden radiocarbon dates. The maximum rate of temperature shifts was the maximum difference of temperature anomaly within each 100-yr bin (referred to as 100-yr binned temperature shifts and midden-centered binned temperature shifts; see Supplementary Table S1 for analyses using other calculations for temperature shift).
The overall distribution of midden-centered averaged temperatures and temperature shifts was compared with the overall distribution of 100-yr binned temperatures and temperature shifts over the last 25 ka using Kolmogorov-Smirnov and unpaired Wilcoxon signed-rank tests to assess whether middens were formed equally frequently during warming and cooling events (Q1). If estimated midden temperatures are biased toward warmer or cooler temperatures (i.e., asymmetry in response to climate change) during the binned temperature record, we would expect a significant difference for the Kolmogorov-Smirnov and unpaired Wilcoxon signed-rank tests. We only performed analyses on sites and time periods with more than five middens. We did these analyses using a 5 ka sliding window and for each geographic region (northern, central, southern) (Q2).
We tested whether the rate of body-size change was faster during warming or cooling events (Q3). Rate of body-size change was calculated using darwins (d): ln(x 2/x 1)/Δt, where x is the mean population body size (g) and Δt is the time interval in millions of years (Ma) (Gingerich, Reference Gingerich1983). Similarly, rates of temperature change were calculated in darwins: ln(T 2/T 1)/Δt, where T is the average, 100-yr binned temperature anomaly during midden formation (midden-centered binned temperatures). Darwins are useful as a unit for comparison of rates of proportional change over a standardized time interval within a single species. Because darwins can be influenced by varying temporal intervals (Gingerich, Reference Gingerich1983), we only used temporal intervals within 100 yr to 1 ka. We compared the rate of temperature change with the rate of body-size change using a Kolmogorov-Smirnov test.
Finally, we predicted the various ways that modern N. cinerea populations can adapt to warming of only 1°C (Q4). We used the most robust equation (y = 3470.60x −0.798; R 2 = 0.77) from Smith and Betancourt (Reference Smith and Betancourt2006) to estimate the mean July temperature (x) for a population with a mean maximum body size (excluding juveniles) of 350 g (y; close to average body size of N. cinerea) (Smith, Reference Smith1997). The temperature gradient for 5° of latitude at 40–45°N at temperatures from 19.8°C to 14.5°C (Meyer, Reference Meyer1992), which is within the range of estimated temperatures for the contemporary landscape, is 3.8°C per 5° latitude, making the rate of temperature change 1.06°C per 1° latitude. We solved for the degree of latitude change for 1°C of temperature change, then converted to kilometers. We then used the lapse rate for elevational change at latitudes between 40–45°N, which is 5.31°C/km (Meyer, Reference Meyer1992), and solved for the amount of elevational change for 1°C temperature change.
RESULTS
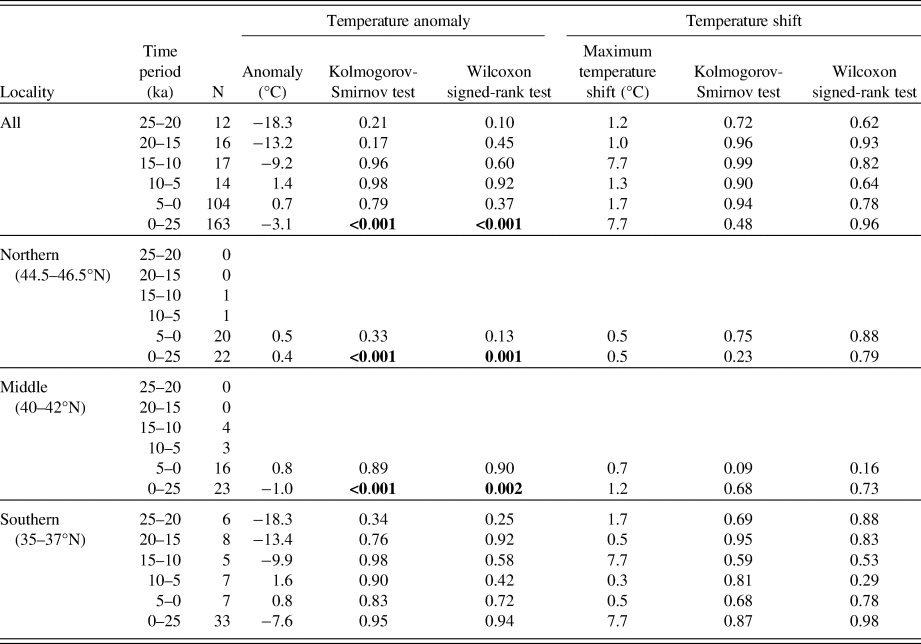
Overall, within the modern geographic range, we found no asymmetry in the ability of N. cinerea populations to exist under different climate regimes over the last 25 ka (Q1). Within each 5-ka interval for which we have enough middens, we found no change in midden formation (midden-centered averaged temperatures) during warmer or cooler climatic conditions based on the 100-yr binned temperatures (Kolmogorov-Smirnov test: P values > 0.05; unpaired Wilcoxon signed-rank test: P values > 0.05; Table 1, Supplementary Table S1). Indeed, midden-centered averaged temperatures, representing temperatures during midden deposition, do not show a bias toward warmer temperatures, but rather closely mirror the frequency of all temperatures within the GISP2 record (Fig. 2a and b, Table 1). Moreover, N. cinerea middens are recovered during temperatures that were estimated to be from 22°C cooler up to 3°C warmer (Fig. 2a and b, Table 1).
Results (P values) for comparison of 100-yr binned temperatures and shifts to the midden-centered temperatures and shifts over the last 25 ka using a Kolmogorov-Smirnov test and an unpaired Wilcoxon signed-rank test.a

a More comprehensive results are provided in Supplementary Table S1. Significant values are in bold.
The magnitude of temperature changes also did not influence persistence patterns (Q1). Despite an average warming of 0.7°C and average cooling of 0.5°C per 100-yr binned GISP2 temperature record, there was no asymmetry in the response of N. cinerea populations (Kolmogorov-Smirnov test: P values > 0.05; Supplementary Table S1) to the 100-yr binned temperature shifts in each 5-ka interval. These results were robust and qualitatively similar regardless of how middens were binned (Supplementary Table S1). Animals persisted even during the most abrupt events (e.g., up to 8°C/100 yr; Fig. 2c and d) at rates that exceed those expected for future anthropogenic warming.
Some sites, however, did not have adequate sampling (>5 middens/5 ka) throughout the 25-ka span. In line with predictions, these temporal gaps coincide with possible climatic conditions that may have caused local extirpations at the periphery of the Pleistocene range (Q2). We found a temporal gap in both the midden and fossil record at the extreme northern latitudes (44.5–46.5°N); neither N. cinerea middens nor bones in sediment from caves and open sites have been reported from 25 ka to 11.5 ka (Supplementary Tables S2 and S3), the coldest period in the record. However, middens both older and younger than this interval were recovered from the northern edge (Supplementary Table S3).
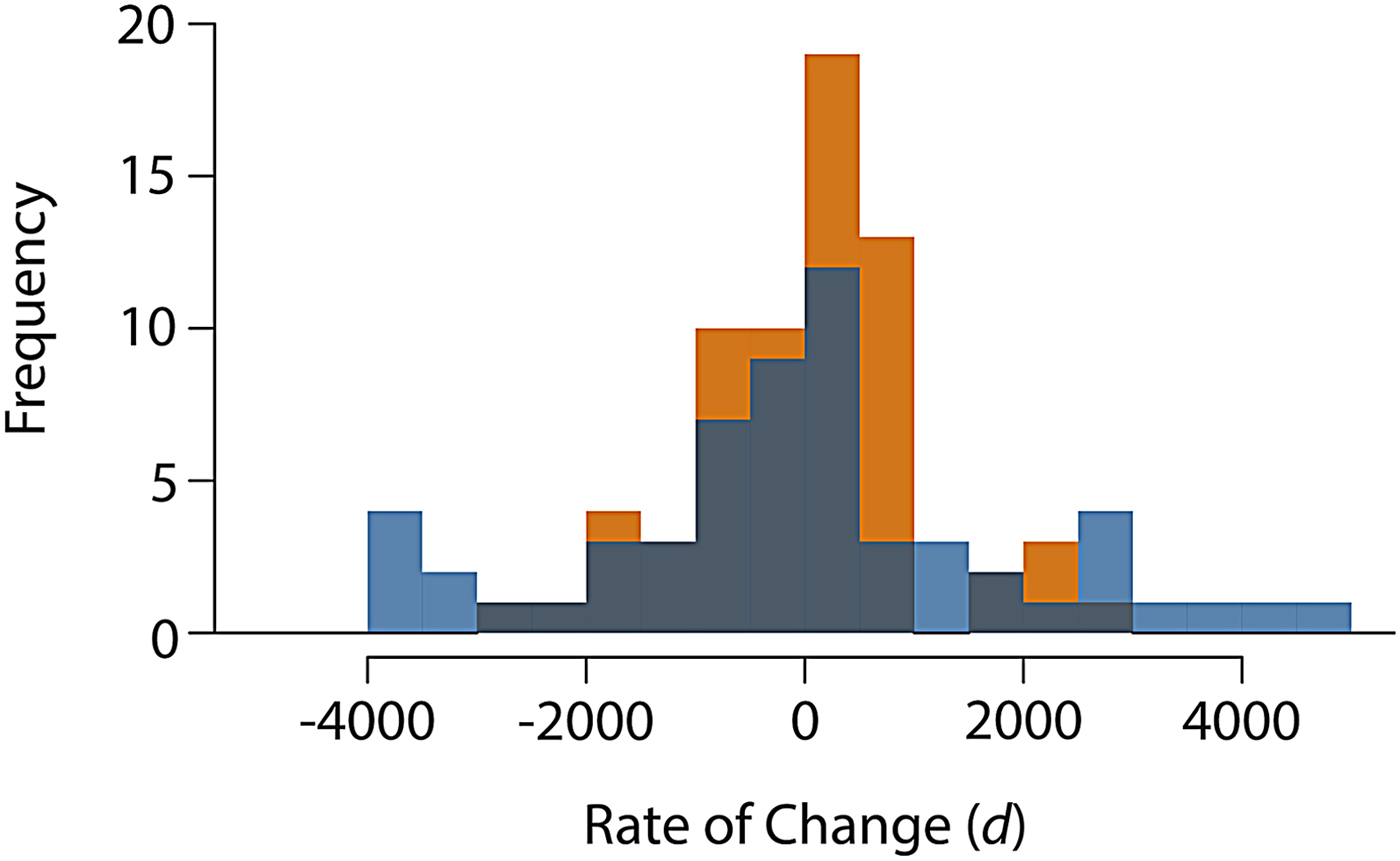
The overall distribution of evolutionary rates of body-size change does not significantly differ from that of the rate of temperature change over the late Quaternary (N = 176, Kolmogorov-Smirnov test: P value = 0.23; Fig. 3) (Q3), suggesting that animals were adapting in step with environmental challenges. Moreover, contrary to our expectations, rates of body-size decreases were not systematically higher than increases (absolute average rate of decrease: 707.3; absolute average rate of increase: 904.8); getting smaller was not evolutionarily “easier.”
Rates of temperature change and morphological change calculated in darwins (d). The distribution of rates of population mean body-mass change (in orange) is not significantly different from the distribution of rates of temperature change (in blue) over the late Quaternary (Kolmogorov-Smirnov test P value = 0.24). Binning smoothed out eight extreme rates of temperature change: four decreasing temperature rates of −12,381 d; −7457 d; −5586 d; −10,643 d; and four increasing temperature rates of 5598 d; 7482 d; 6786 d; 11,004 d. (For interpretation of the references to color in this figure legend, the reader is referred to the web version of this article.)

The ability for populations to adapt has very real implications for modern small mammal response to future climate change. For populations of N. cinerea to stay within their thermal niche, they can change elevation, geographic range, and body size (Q4). For a population with individuals averaging 350 g, a temperature increase of 1°C requires migration of 200 m of elevation or 100 km of latitude, a decrease in mean population body mass by ~1%, or some combination thereof. Of these, shifts in body mass may be the most achievable.
DISCUSSION
Our study tested for the ability of N. cinerea populations to persist during changing climates. Our approach used a combination of presence/absence of middens and estimates of body-size change in relation to temperatures over the late Quaternary. Given that populations decrease in body size in response to warming, we predicted that populations should have an “easier” time coping with warming temperatures than cooling temperatures, as Evans et al. (Reference Evans, Jones, Boyer, Brown, Costa, Ernest and Fitzgerald2012) found that decreasing body size occurred in fewer generations than increasing body size. That is, we should find more middens during warm climates as evidence of a population successfully adapting to warming. Surprisingly, N. cinerea populations show symmetry in their ability to persist and, by extension, adapt through changes in body size in response to warming or cooling events (Fig. 2). Additionally, we predicted that populations should have a faster rate of body-size decrease than increase, particularly in response to warming. However, we find little difference between the rate of temperature change and the rate of body-size change (Fig. 3).
Impressively, the southernmost populations in our study (35–37°N), which were at the center of the Pleistocene geographic range (Smith, Reference Smith1997), persisted through even the largest temperature shifts: 8°C warming and 2°C cooling during the late Pleistocene, which are comparable to estimates of future climate change (Stocker et al. Reference Stocker, Qin, Plattner, Tignor, Allen, Boschung, Nauels, Xia, Bex and Midgley2013). Consistent with our predictions, it is known that populations at the edges of the Pleistocene geographic range appear to become locally extirpated. Populations located in Mexico (not in our data set due to lack of body-size estimates) became locally extirpated as climate warmed (Betancourt et al., Reference Betancourt, Devender and Martin1990). Likewise, northern populations in our study appear to have become extirpated as climate cooled. However, it is worth noting that other factors could account for the apparent absence of middens at northern latitudes: absence could be due to poor preservation or due to investigators not searching for older middens at those sites. Still, we also do not find fossil evidence of N. cinerea from 25 ka to 11.5 ka at northernmost latitudes in our study (44.5–46.5°N) (Fig. 1a, Supplementary Table S2).
Modern populations of N. cinerea that occur at the periphery of their geographic range, possibly already at their physiological limits, may be vulnerable to future anthropogenic temperature shifts. For example, populations in the southern portion occupy higher elevations than populations in the north (Smith, Reference Smith1997). For high-elevation, southern populations, there may be insufficient elevational relief to allow retreat upward as climate warms. Likewise, for northern populations, moving downslope may not provide enough temperature difference to cope with cooling temperatures experienced during the late Quaternary. Additionally, the patchiness of suitable habitats may make it difficult for northern range adjustments. Thus, adaptation via body-size changes may be the only viable option.
Similar to recent research by McCain and King (Reference McCain and King2014), our findings indicate that smaller-sized mammals may be resilient to future climate change. The fastest rate of decrease in darwins (d) was 2661 d (203 g/153 yr); the fastest rate of increase was comparable, at 2550 d (103 g/117 yr). These extremely rapid rates of body-size change correspond with those found in studies performing artificial, or directed, evolution (Gingerich, Reference Gingerich1983; Reznick et al., Reference Reznick, Shaw, Rodd and Shaw1997). Moreover, we find that body size was evolutionarily labile; the mean rate of body-size change was 2 d, somewhat higher than the average for the vertebrate fossil record (Gingerich, Reference Gingerich1983). Morphological adaptation seems a likely response to ongoing climate change for small mammals.
CONCLUSIONS
Recent studies confirm that morphological change may be the most feasible option for some species to persist during current and future climate change (Thompson, Reference Thompson1998; Barnosky et al., Reference Barnosky, Hadly and Bell2003; Blois and Hadly, Reference Blois and Hadly2009). Our study demonstrates that most N. cinerea populations adapted equally well to warming and cooling events over the late Quaternary, as evidenced by middens present during both warm- and cool-temperature periods. And, thermal adaptive thresholds were not exceeded by rates of temperature change, except in peripheral populations, which likely experienced more temperature change than what is captured by the GISP2 ice-core record. Climate change may be an issue at the physiological edges of the geographic range, but within the core, populations can adapt even to rapid shifts. We provide a framework for testing the direction of morphological change in response to concurrent climate change. Our study suggests that, for some small mammals, adaptation may be a viable option for coping with anthropogenic climate change.
SUPPLEMENTARY MATERIAL
The supplementary material for this article can be found at https://doi.org/10.1017/qua.2019.13
ACKNOWLEDGMENTS
This research was supported by National Science Foundation grants BIO-DEB-0344620. MAB was supported by the Program in Interdisciplinary Biological and Biomedical Sciences from the National Institute of Biomedical Imaging and Bioengineering (award #T32EB009414; FAS, principal investigator). The content is the sole responsibility of the authors and does not necessarily represent the official views of the National Institute of Biomedical Imaging and Bioengineering, or the National Institutes of Health. Neotoma sp. fossil data were extracted from the Neotoma Paleoecology Database (http://www.neotomadb.org); the work of the data contributors and the Neotoma community is gratefully acknowledged. We also thank G. Hunt, J.H. Brown, S.T. Jackson, R.C. Terry, L.P. Bell-Dereske, L. Anderson, M.J. Ryan, R.D. Edwards, and the F.A. Smith lab for their reviews and suggestions.