Introduction
In the last 500 years, the impact of humans on ecosystems has triggered an extinction wave with a rate and magnitude like previous events of mass extinction on Earth. Species extinctions may lead to the loss of different functional roles (Dirzo et al. Reference Dirzo, Young, Galetti, Ceballos, Isaac and Collen2014), with worrying consequences for the ecological processes they underlie and ecosystem services they provide (Emer et al. Reference Emer, Galetti, Pizo, Jordano and Verdú2019). Furthermore, declines in abundance and species composition changes result in co-extinction cascades with immediate impacts on ecosystem functioning (Dirzo et al. Reference Dirzo, Young, Galetti, Ceballos, Isaac and Collen2014). Human-induced habitat loss, including forest degradation, is currently one of the main threats to biodiversity (Bongaarts Reference Bongaarts2019). A pervasive feature of forest degradation is the fragmentation of forested habitats and the concomitant increase of edge habitats. Edge habitats are transitional areas between forested and non-forested habitats (Lindenmayer & Fischer Reference Lindenmayer and Fischer2006). Fragmentation leaves populations of plants and animals reduced and potentially isolated. Moreover, it exposes them to ecological conditions to which they may not be adapted (Laurance et al. Reference Laurance, Camargo, Luizão, Laurance, Pimm, Bruna, Stouffer, Bruce Williamson, Benítez-Malvido, Vasconcelos, Van Houtan, Zartman, Boyle, Didham, Andrade and Lovejoy2011), ultimately impairing their persistence. Tropical forests are amongst the most threatened areas globally (Lewis et al. Reference Lewis, Edwards and Galbraith2015). These ecosystems are rich in mutualistic relationships, such as those between plants and their seed dispersers. Up to 80% of the vascular plants depend on animal seed dispersers to some extent (Howe & Smallwood Reference Howe and Smallwood1982). Previous studies have shown that when depleted of large frugivores, these habitats tend to experience a decrease in seed dispersal, altered patterns of tree recruitment, and species’ relative abundance (Bagchi et al. Reference Bagchi, Swamy, Latorre Farfan, Terborgh, Vela, Pitman and Sanchez2018; Harrison et al. Reference Harrison, Tan, Plotkin, Slik, Detto, Brenes, Itoh and Davies2013; Vanthomme et al. Reference Vanthomme, Bellé and Forget2010).
Effective habitat restoration should aim at preserving the complex web of species interactions essential to ecosystem functioning and in sustaining its communities, which may, as a whole, perpetuate conservation efforts by natural processes (Correia et al. Reference Correia, Timóteo, Rodríguez-echeverría and Mazars-simon2017). In the last couple of decades, ecologists have used tools derived from network theory to understand interaction patterns, providing a community-wide perspective while simultaneously exploring the role of individual species (Bascompte Reference Bascompte2007; Proulx et al. Reference Proulx, Promislow and Phillips2005). Moreover, these tools allow us to predict the potential response of communities to cascades of secondary extinctions (Memmott et al. Reference Memmott, Waser and Price2004) and the contribution of each species to those events (Garcia-Algarra et al. Reference García-Algarra, Pastor, Iriondo and Galeano2017). Ecological networks have been applied in multiple contexts, providing essential insights regarding species conservation and evaluating the effectiveness of conservation and restoration programs in preserving ecological functionality (Correia et al. Reference Correia, Timóteo, Rodríguez-echeverría and Mazars-simon2017; Ribeiro da Silva et al. Reference Ribeiro da Silva, Montoya, Furtado, Memmott, Pizo and Rodrigues2015). African seed dispersal networks have been poorly studied (Dugger et al. Reference Dugger, Blendinger, Böhning-Gaese, Chama, Correia, Dehling, Emer, Farwig, Fricke, Galetti, García, Grass, Heleno, Jacomassa, Moraes, Moran, Muñoz, Neuschulz, Nowak, Piratelli, Pizo, Quitián, Rogers, Ruggera, Saavedra, Sánchez, Sánchez, Santillán, Schabo, da Silva, Timóteo, Traveset, Vollstädt and Schleuning2019; Schleuning et al. Reference Schleuning, Blüthgen, Flörchinger, Braun, Schaefer and Böhning-gaese2011; Timóteo et al. Reference Timóteo, Correia, Rodríguez-Echeverría, Freitas and Heleno2018). These few studies reported that African seed dispersal networks are generalized, with a considerable diet overlap associated with frugivorous megafauna (Dugger et al. Reference Dugger, Blendinger, Böhning-Gaese, Chama, Correia, Dehling, Emer, Farwig, Fricke, Galetti, García, Grass, Heleno, Jacomassa, Moraes, Moran, Muñoz, Neuschulz, Nowak, Piratelli, Pizo, Quitián, Rogers, Ruggera, Saavedra, Sánchez, Sánchez, Santillán, Schabo, da Silva, Timóteo, Traveset, Vollstädt and Schleuning2019). This overlap could provide some degree of structural robustness but also vulnerability to selective loss of generalists (Bastazini et al. Reference Bastazini, Debastiani, Azambuja, Guimarães and Pillar2019). Moreover, it was found that even the partial defaunation of Afrotropical forests can have profound impacts on the strength of interactions between animals and plants (Poulsen et al. Reference Poulsen, Clark and Palmer2013). This is alarming in the face of the defaunation occurring across the continent, where key seed dispersers such as primates, birds, and bats are becoming critically endangered and forests are being lost at a critical rate (Vanthomme et al. Reference Vanthomme, Bellé and Forget2010).
Our main goal was to assess the changes in plant–frugivore networks of human-induced forest edges (FEs), resulting mainly from slash and burn agriculture, in sub-humid African forests and understand species’ roles for the continuity of animal seed dispersal in these forests. We had three objectives: 1) assess the influence of fruit availability on the abundance and richness of potential seed dispersers; 2) determine the structure of plant–frugivore networks in this sub-humid forest; 3) identify the role of different network elements in the functioning of the seed dispersal process. To this end, we compared mature and FEs in Cantanhez National Park in Guinea-Bissau. This Park contains one of Africa’s remaining sub-humid forests, identified by World Wide Fund for Nature as one of the 200 most important ecoregions globally (Olson & Dinerstein Reference Olson and Dinerstein2002). Despite its legal protection status, the Park has seen an intensification of anthropogenic agricultural pressures, which led to an annual deforestation rate of 1.17%, increased habitat fragmentation, and a shift from closed to open forest savanna–woodland mosaic (Oom et al. Reference Oom, Lourenço, Cabral, Vasconcelos, Catarino, Cassamá and Moreira2009). The Cantanhez is naturally fragmented, however, the continuous conversion of the forest into farmland has led to a decrease in the size of relatively untouched forest remnants, increasing edge effects. Despite the ecological and conservation importance of these forests, no data on the consequences of deforestation has been collected so far.
We expected higher fruit availability in the MF. In contrast, due to the high animal mobility, we predicted frugivore abundance and richness to be similar in both habitats (Schleuning et al. Reference Schleuning, Blüthgen, Flörchinger, Braun, Schaefer and Böhning-gaese2011). We expected networks to show a high level of generalization, similar to other plant–frugivore networks from the Afrotropics, and interactions to be more unevenly distributed and specialized in the MF networks (Dugger et al. Reference Dugger, Blendinger, Böhning-Gaese, Chama, Correia, Dehling, Emer, Farwig, Fricke, Galetti, García, Grass, Heleno, Jacomassa, Moraes, Moran, Muñoz, Neuschulz, Nowak, Piratelli, Pizo, Quitián, Rogers, Ruggera, Saavedra, Sánchez, Sánchez, Santillán, Schabo, da Silva, Timóteo, Traveset, Vollstädt and Schleuning2019), as frugivores will be less restricted by fruit availability. We expected frugivore species at the FEs to be more generalist in their choices for interactions partners due to the lower availability of fruit resources, thus having to feed on any fruit species available. Consequently, fruit trees will be visited by a wider range of frugivores (Menke et al. Reference Menke, Böhning-Gaese and Schleuning2012). Finally, network dissimilarity between both habitats was expected to be driven by species’ turnover, as FEs will be visited by forest frugivore specialists and non-forest frugivores (Menke et al. Reference Menke, Böhning-Gaese and Schleuning2012).
Material and methods
Study area and sampling design
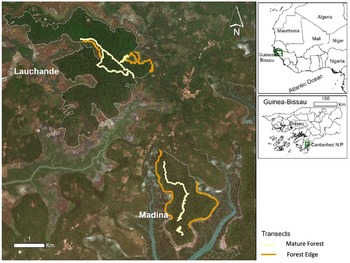
Fieldwork was conducted from January to March 2018 in the Cantanhez National Park (CNP; Fig. 1), Guinea-Bissau (10°55’–12°45’ N, 13°37’–16°43’ W) during the dry season. Sampling in the rainy season is logistically very difficult. Heavy rainfall floods the terrain, denying access to the field sites. The region has a tropical semi-humid climate, with a long dry season between November and May. Rainfall reaches up to 2,400 mm/year, and the average annual temperature ranges from 28º to 31º C (Catarino et al. Reference Catarino, Martins and Moreira2001). The CNP comprises a forest mosaic, savanna, and mangroves (Catarino et al. Reference Catarino, Martins and Moreira2001), supporting a large proportion of West Africa’s remaining sub-humid forest (Oom et al. Reference Oom, Lourenço, Cabral, Vasconcelos, Catarino, Cassamá and Moreira2009).
Satellite image (Esri & GeoEye IKONOS) of the two forest remnants (Lauchande and Madina) located within the Cantanhez National Park (CNP) in Guinea Bissau. Remnants are outlined; orange lines represent the forest edge transects while yellow corresponds to the mature forest transects. The right-side upper panel showcases Guinea-Bissau, while the lower panel locates CNP within the territory.

Within the CNP, we selected two forest remnants, Lauchande (405 ha) and Madina (402.5 ha). Both remnants were surrounded mainly by agricultural fields but also mangroves and abandoned farmlands. Fruiting trees and frugivore species composition were very similar in both remnants. At each remnant, two forested habitats were sampled: MF, starting ca. 200 m from the nearest non-forested habitat, and FE, the transition area from MF to non-forested areas. The structural differences of the vegetation between habitats were visible in satellite imagery, allowing the 200-m cut line to be easily defined. Within each forested habitat, we established ca. 2.5 km-long transects to identify and survey all fleshy fruit trees within 7 m to either side of the transect. At Madina, two transects were selected for each habitat, and at Lauchande, three (five transects per habitat type). Each transect was sampled at least three times, alternating between forest remnants.
During the transects, we (a) counted plant–frugivore interactions, defined as events of fruit consumption by animals and (b) estimated the number of visiting frugivores and potential dispersers. These counts were performed with binoculars at focal trees (i.e., all trees along the transect with ripe fruits and good visibility). Counts at each focal tree were limited to 1 h. If no activity was detected for 15 min, the session would end, and we would move on to the next fruiting tree. Each transect was covered during two 4-h periods, one starting at sunrise and one late in the afternoon until sunset (totalling 138 h). All animal visitors were recorded and identified to the lowest taxonomic level possible (Borrow & Demey Reference Borrow and Demey2001). The duration of animal visits and the number of fruits ingested or removed (i.e., confirmed interactions) were also registered. When birds visited focal trees in flocks, foraging was recorded for a visible randomly chosen individual (Saavedra et al. Reference Saavedra, Hensen, Beck, Böhning-Gaese, Lippok, Töpfer and Schleuning2014). Plant–animal interactions observed between focal tree’s observation were also recorded. Numerical and network analyses were performed using only confirmed plant–animal interactions (fruit-consuming or removing events). The forest canopy density did not allow an accurate fruit count, so fruit availability was estimated by counting all fruiting trees along the transects.
To assess the level of sampling completeness for each habitat, we estimated the richness accumulation of animal visitors, frugivores (visitor with confirmed interactions), trees, and links (unique plant–frugivore interactions) across the sampling period. Sampling completeness was estimated by calculating the proportion of observed richness to the estimated theoretical richness obtained from the non-parametric Chao2 estimator (Chao & Chiu Reference Chao and Chiu2016; Costa et al. Reference Costa, da Silva, Ramos and Heleno2016) via function specaccum from the package vegan (Oksanen et al. Reference Oksanen, Blanchet, Kindt, Legendre, Minchin, O’Hara, Simpson, Solymos, Stevens and Wagner2013), in R environment (version 3.5) (R Core Team 2019).
Influence of fruit availability and habitat type
We tested the effect of habitat type on fruit availability (total and per tree species). Considering only data on confirmed interactions, we also tested the effect of habitat type and fruit availability on the number of frugivore species and the number of interactions (total and per frugivore species) per transect. Firstly, we fitted generalized linear mixed models using both date and sampling sites as random factors. These models were fitted with Poisson error distribution and log link function using the lme4 package (Bates et al. Reference Bates, Mächler, Bolker and Walker2015). However, the variance accounted for by both random variables was nearly zero. Therefore, we used generalized linear models (GLMs). All GLM assumptions were tested beforehand; residuals were visually inspected for departure from normality. Habitat type and fruit availability were checked for collinearity using a Spearman correlation matrix. We excluded fruit availability from the second set of models since the correlation between the two descriptors was >0.7 (Zhang Reference Zhang2012). For Bycanistes fistulator (Cassin, 1850), Ceratogymna elata (Temminck, 1831), Piliocolobus badius temminckii (Kerr, 1792), Cinnyricinclus leucogaster (Boddaert, 1783), and Pogonornis bidentatus (Shawn, 1799), the effect of habitat type on the abundance of individual frugivores and tree species was not modelled because these species were only observed in one habitat type. However, in the richness and abundance models, these species were considered.
Networks analysis
To analyse the interaction pattern between trees and their potential seed dispersers, we compiled the network of interactions into a matrix for each forested habitat, with interaction frequency defined as the number of fruit-eating or fruit-removal events (hereafter referred to as confirmed interactions).
To characterize each network’s structure, we calculated commonly used descriptors that reflect their connectivity, distribution of interactions, and ability to withstand species extinction cascades. Modularity and nestedness provide information on the global structure of the network, highlighting the potential redundancy or segregation of species while performing a given function. Ecological and biological factors influence modularity (e.g. seasonality, trait-matching, or evolutionary trajectories (Olesen et al. Reference Olesen, Bascompte, Dupont and Jordano2007)) and can help understand the level of cohesiveness of an ecological community and proneness to fragmentation (Dehling et al. Reference Dehling, Töpfer, Schaefer, Jordano, Böhning-gaese and Schleuning2014). Through a close inspection of modules and the role played by each species, we can identify those species that hold the different parts of a network together and that should be the focus of management actions to ensure the continuity of an ecological function (Kaiser-Bunbury & Blüthgen Reference Kaiser-Bunbury and Blüthgen2015). A nested network allows inferences regarding the functional redundancy of a system and possible pathways for the persistence of specialists (Bascompte Reference Bascompte2007). Other parameters, such as connectance, vulnerability/generality, specialization (H2’), interaction evenness, provide information regarding the diversity and distribution of interactions among species in a network. Connectance synthetizes the diversity of observed interactions between species, reflecting the rate at which an ecological process occurs, with higher connectance implying greater level of generalism by species that can provide a buffer against fluctuations on the availability of partner species (Tylianakis et al. Reference Tylianakis, Laliberté, Nielsen and Bascompte2010). In turn, generality and vulnerability tell us how much each level of a network (frugivore and tree plants, respectively) rely on a, more or less restricted, group of partners, with implications on their ability to cope with the extinction of their interaction partners (Kaiser-Bunbury & Blüthgen Reference Kaiser-Bunbury and Blüthgen2015). Interaction evenness and network specialization, provide a way to assess, at the level of the whole community, how species distribute their interactions among the available partners, and how redundant or complementary is the system in the provision of an ecological function (Kaiser-Bunbury & Blüthgen Reference Kaiser-Bunbury and Blüthgen2015). In addition, we quantified robustness of the network to environmental changes and unpredictable events, allowing a preventive conservation approach. Nevertheless, robustness is quantifiable as the degree to which a network can withstand a cascade of secondary extinctions (Memmott et al. Reference Memmott, Waser and Price2004), estimated for frugivores (HL – higher level, e.g. robustness to the extinction of trees) and trees (LL – lower level, e.g. robustness to the extinction of frugivores).
The Overlap and Decreasing Fill – WNODF (Almeida-Neto & Ulrich Reference Almeida-Neto and Ulrich2011) and the computeModules function based on the DIRTLPawb+ algorithm (Beckett Reference Beckett2016), with 18 steps were used to calculate nestedness and modularity, respectively. We resorted to null models to test if the empirical network structure is not a mere result of stochastic processes (Dormann et al. Reference Dormann, Frund, Bluthgen and Gruber2009). We used the vaznull model (Vázquez et al. Reference Vázquez, Melián, Williams, Blüthgen, Krasnov and Poulin2007), which is a conservative model that preserves the original structure of the network, along with its species richness, interaction frequency, and connectance. We generated 1000 simulated networks, and compared the significance of the observed network metrics to that of the simulated networks using a z-score (Ribeiro da Silva et al. Reference Ribeiro da Silva, Montoya, Furtado, Memmott, Pizo and Rodrigues2015).
We assessed network dissimilarity between both habitats using network beta-diversity indices (Poisot et al. Reference Poisot, Canard, Mouillot, Mouquet and Gravel2012). This method estimates network dissimilarity in terms of change in species composition (ßs – species turnover) and interactions (ßwn – interaction turnover). The latter is then decomposed into the contributions from species turnover (ßst) and changes in the interactions between co-existing species, i.e., rewiring (ßos).
Network descriptors and network dissimilarity were estimated using the R packages bipartite (Dormann et al. Reference Dormann, Frund, Bluthgen and Gruber2009) and betapart (Poisot Reference Poisot2016).
Network species’ roles
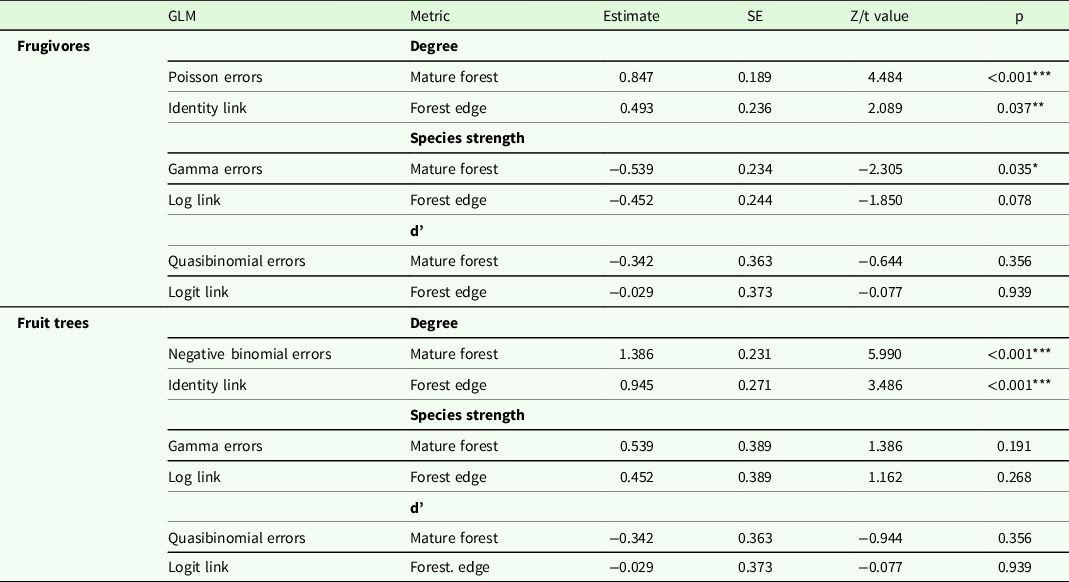
To investigate the importance of each species in the network, we calculated a series of species-level descriptors. Species degree quantifies the number of links of each species, a simple metric that reflects the level of participation of a species in the network. Species strength quantifies the importance of each frugivore species for the set of tree species and vice versa. It is defined as the cumulative sum of dependencies of species from one level of the network to the species on the other level (Bascompte et al. Reference Bascompte, Jordano and Olesen2006). The specialization index (d’) reflects a species selectivity for partners and is estimated as the deviation from a random sampling of interacting patterns. It ranges from zero (no specialisation) to one (perfect specialist). When d’ is close to one, that species interacts with partners rarely visited (Blüthgen Reference Blüthgen2010). To test the effect of habitat type on these species-level descriptors, we resorted to GLMs for each descriptor. GLMs for degree were fitted with Poisson error distribution and identity link, species strength with Gamma error distribution and log link function, and specialization index d’ with quasibinomial error distribution and logit link function.
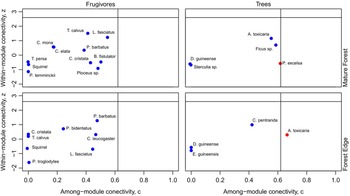
Species’ structural roles were determined from the assignment of species to modules obtained in the modularity analysis and described by two parameters: z, the standardized number of links to species in the same module, and c, the level to which a species connects to species in other modules (Olesen et al. Reference Olesen, Bascompte, Dupont and Jordano2007). Species were then classified as peripherals (few links inside its module – z≤2.5, and few link to other modules – c≤0.62), module connectors (few links within modules – z≤2.5, but many links between modules – c> 0.62, thus crucial to network cohesion), module hubs (many links within its module – z>2.5, and few links to other modules – c≤0.62, being essential to the consistency of its module), and network hubs (several links both within and between modules – z> 2.5 and c> 0.62, thus important to the coherence of the overall network). Finally, to assess how vulnerable the network is to the loss of a particular species, we estimated the K risk index (García-Algarra et al. Reference García-Algarra, Pastor, Iriondo and Galeano2017).
All network and species-level metrics were calculated using the R package bipartite (Dormann et al. Reference Dormann, Frund, Bluthgen and Gruber2009), except for K risk , estimated with the package kcorebip (García-Algarra et al. Reference García-Algarra, Pastor, Iriondo and Galeano2017).
Results
We recorded 1540 visits by potential frugivores to focal trees and 77 confirmed interactions (i.e., fruit ingestion or fruit removal events), with 14 frugivores species feeding or removing fruits from eight tree species (Table S1). The visitor community was composed of 26 bird species, 5 primates, and 2 species of unidentified squirrels. In MF, fruiting trees received 900 visitors from 30 species resulting in 41 confirmed interactions. In FE, 640 visitors from 20 species resulted in 36 confirmed interactions. Sampling completeness for visitors was higher at the FE (77% vs 47%). The pattern persisted for frugivores (83% vs 81%) and tree species (84% vs 78%) within the network (Table S2). Lastly, sampling completeness of plant–frugivore links for the MF was 26%, whereas the edge was 69% (Table S2).
Influence of fruit availability and habitat type
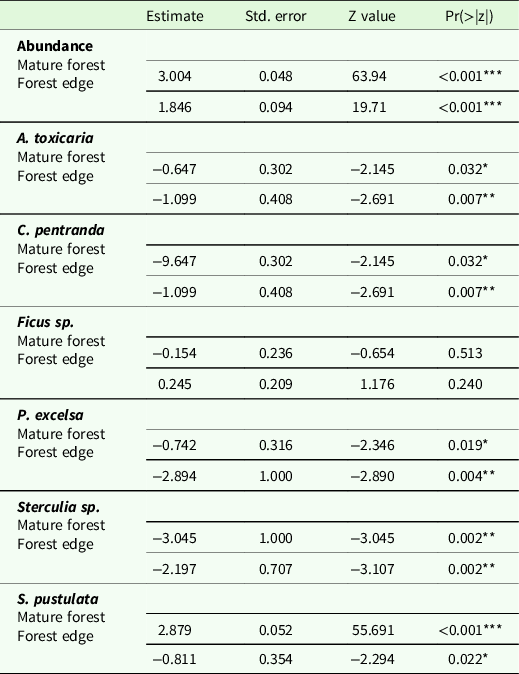
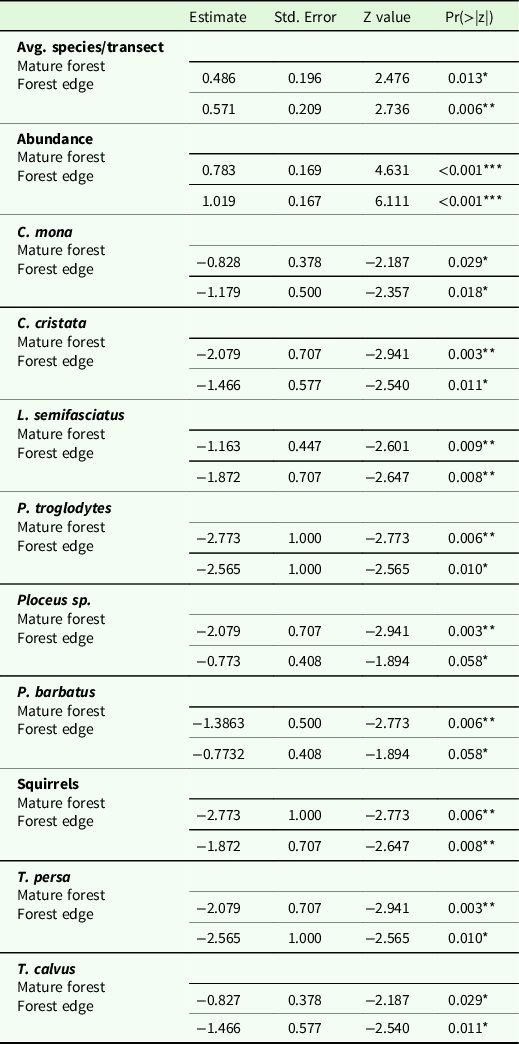
Overall, habitat type had a significant effect on fruit availability, with MF displaying the highest number of fruiting trees (640 vs 153 Table 1). Tree species occurring in both habitats were the same except for Parinari excelsa (Sabine, 1824), which was only observed at MF, and Elaeis guineensis (Jacq., 1763), which seemed to occur only at FE. Ceiba pentranda (L.) Gaertn., and Sterculia sp. (L.,1753) showed a significantly higher fruiting abundance at the FE, whereas fruiting Strombosia pustulata (Oliv., 1894), P. excelsa, and Antiaris toxicaria (Lesh., 1810), were more abundant at the MF (Table 1). Fruiting tree counts were as accurate as possible. However, tree height, size, and canopy density were higher at MF and the onset of fruiting in some trees might be harder to identify in this habitat. Consequently, any bias in our data will be towards underestimating fruit availability for the MF, increasing thus the observed difference in fruit availability between the two habitats. Although the total number of interacting frugivores, both individuals and species, was higher at MF, their average value per transect was significantly higher at the FE. Habitat type had a significant effect on fruit consumption of several frugivores. B. fistulator, C. elata, and P. temminckii were only observed foraging at MF. In contrast, C. leucogaster and P. bidentatus were observed only at FE. Lophoceros semifasciatus (Hartlaub, 1812), Cercopithecus mona (Schreber, 1774), Tauraco persa (Linnaeus, 1758), and Treron calvus (Temminck, 1811) ingested fruits more often at MF. In contrast, squirrels, Corythaeola cristata (Vieillot, 1816), Pan troglodytes (Blumenbach, 1775), Pycnonotus barbatus (Desfontaines, 1789), and Ploceus sp. (Cuvier, 1816) fed more frequently at FE (Table 2).
Parameters of the generalized linear models testing the effect of forest habitat type – mature and edge – on fruit availability (total and per fruiting tree species). Statistical significance is shown as follows: ***p<0.001 **p<0.01, *p<0.05

Parameters of the generalized linear models testing the effect of two forest habitat types – mature and edge — on the average frugivore species per transect, total species abundance, and species-specific abundance. Only species occurring in both habitats were considered for this analysis. Statistical significance is shown as follows: ***p<0.001 **p<0.01, *p<0.05

Networks analysis
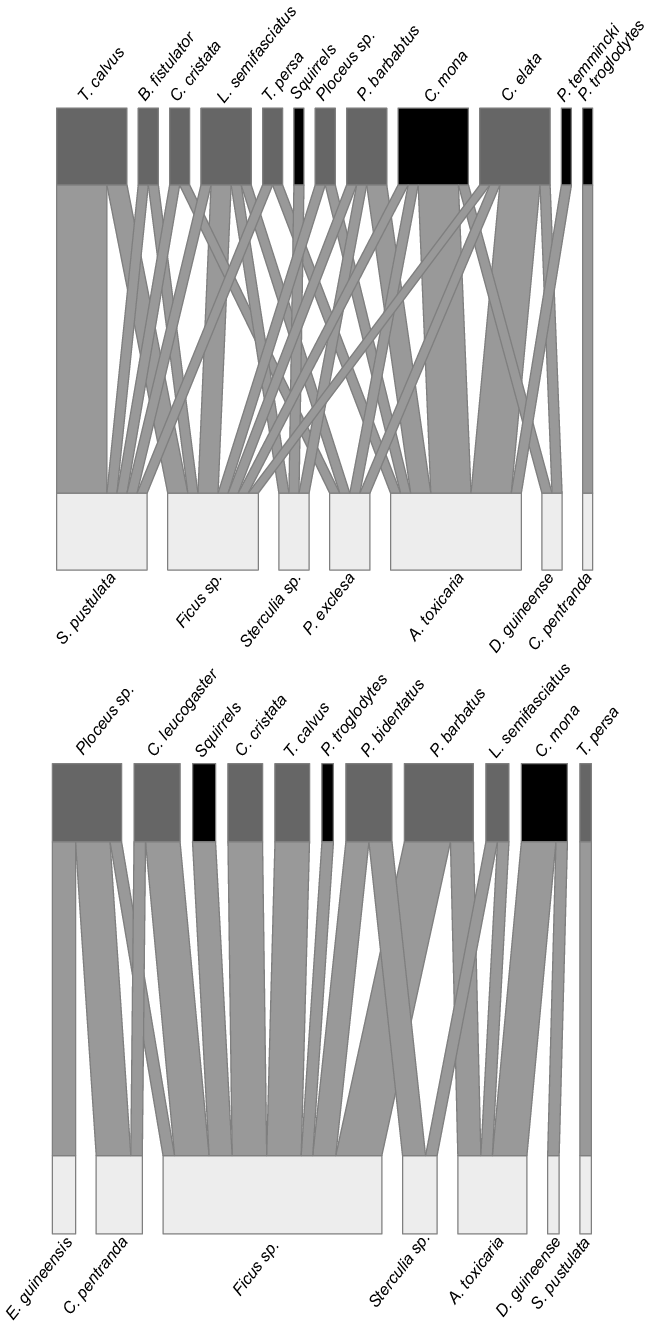
The plant–frugivore networks from both forest habitats were very similar regarding species richness, having the same number of tree species (seven) and differing by one in the number of frugivore species (11 at FE and 12 at MF, Fig. 2). Fewer interactions were detected at FE (36) than at MF (41). At FE, figs were the most ingested fruits (52% of the interactions). In contrast, at MF, consumption was more evenly distributed across tree species: A. toxicaria (32%), Ficus sp. L., and S. pustulata (22% each) (Fig. 2). At MF, the most critical consumers were C. elata, T. calvus, and C. mona (17.1% each), while at FE, the most important were Ploceus sp. and P. barbatus (16.7% each) (Fig. 2).
Quantitative tree-frugivore network from the mature forest (top) and forest edge (bottom) in the Cantanhez National Park, Guinea-Bissau. The upper boxes represent frugivore species, whereas the lower boxes represent tree species. Box width corresponds to the relative fraction of interactions contributed by each species to the networks. Line width is proportional to the interaction frequency between each frugivore and tree species. At the upper level, black rectangles are mammals, and grey are bird dispersers. Additional information regarding these species can be found in Tables 3 and 4.

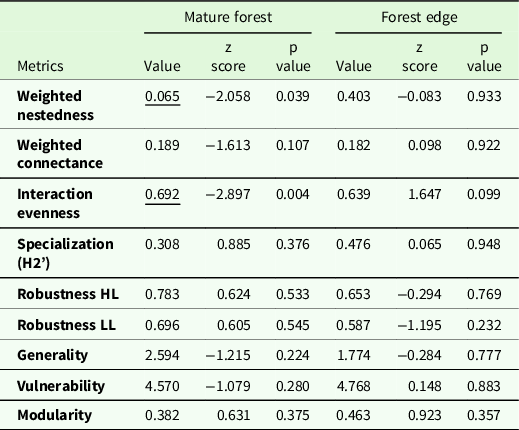
Metrics describing the global structure of both networks were similar in general. Nestedness and interaction evenness at MF were the only descriptors that significantly differed from random expectations. Both are lower than expected by the null model (z-scores: −2.058 for WNODF, and −2.897 for interaction evenness, Table 3). Nestedness was lower at MF than at FE (MF: 0.065 vs FE: 0.403), and MF was less modular (MF: 0.382 vs FE: 0.463) and specialized (MF: 0.308 vs FE: 0.476) than FE (Table 3). On the other hand, MF was slightly more connected, and its interactions were more evenly distributed than the FE (connectance: 0.189 vs 0.182, and interaction evenness: 0.692 vs 0.639, for MF and FE, respectively; Table 3). Regarding the distribution of interactions within each level of the networks, generality was higher at MF (MF: 2.594 vs FE: 1.774; Table 3). Vulnerability was higher at FE (MF: 4.570 vs FE: 4.768; Table 3). Modularity analysis revealed that networks were composed of five modules at MF and six modules at FE.
Network-level descriptors for the mature forest and forest edge. The significance of results was obtained using a z-score test to compare the observed values with that of the mean of 1000 randomly regenerated networks using the vaznull model (the original structure is preserved, as well as species richness, interaction frequency, and connectance). Significant results are underlined. Robustness HL and Robustness LL refer to the robustness of the network to cope with the removal of species on the higher (frugivore species) and lower (tree species) levels of the network, respectively.

Finally, robustness to secondary extinctions was relatively high for both habitats (Table 3), with MF exhibiting higher values of robustness than FE for both frugivore extinction (robustness HL: MF: 0.783 vs FE: 0.653) and plant extinction (robustness LL: MF: 0.696 vs FE: 0.587).
The dissimilarity in species composition between the two networks (ßs – 0.297) was much lower than the dissimilarity of interactions (ßwn – 0.695). Moreover, interaction turnover was mainly led by the rearrangement of interaction between co-occurring species (ßos – 0.417) rather than by changes in species between communities (ßst – 0.279).
Network species’ roles
The average degree for frugivores and trees was statistically different between habitats (p = 0.05, Table 4) and higher at MF (MF: frugivores – 2.33, trees – 4.00 vs FE: frugivores – 1.64, trees – 2.57). On the other hand, frugivore species strength was statistically lower at MF (MF: 0.583 vs FE: 0.636), and no differences were detected for trees (Table 4). Both parameters followed the same trends, with large-bodied frugivores showing the highest strength and degree at MF, such as C. elata, whereas at FE, smaller species such as Ploceus sp. and P. barbatus had the highest scores (Table S3). Regarding trees, Ficus sp. and A. toxicaria had the highest scores for both habitats, and S. pustulata was important at MF (Table S3). No statistical differences were found between forest habitats regarding frugivore and tree species’ specialization d’ (Table 4). The most specialized species were P. troglodytes and C. pentranda at MF, and T. persa and S. pustulata at FE (Table S3).
Parameters for the generalized linear models relating differences for frugivores and trees’ species-level network metrics between mature forest and forest edge. Metrics are a) degree, b) species strength and c) specialization index - d’. Statistical significance is shown as follows: ***p<0.001 **p<0.01, *p<0.05

Most species were peripheral in both habitats, except for P. excelsa, at MF, and A. toxicaria, at FE, classified as module connectors (Table S3; Fig. 3). K risk analyses allowed to identify species whose loss poses a greater risk to network cohesion. Most plant and frugivore species showed low and identical K risk scores, but those with the highest scores were trees (Table S3): A. toxicaria and C. pentranda at MF and Ficus sp., A. toxicaria and Ploceus sp. at FE (Table S3).
Distribution of frugivore and tree species according to their network role. Each dot represents one species, and each small pane shows the role distribution of a selected group of species. Due to limitations in how the z value is defined in the original formula, any species alone (in its level) in a module will have z=NaN since SD is 0. Those species were: T. calvus, S. pustulata, and C. pentranda in the mature forest, and C. mona, T. persa, Ploceus sp., Ficus sp., Sterculia sp., and S. pustulata in the forest edge. Upper panes are of the mature forest and lower panes of the forest edge. Frugivores are shown on the right and plants on the left.

Discussion
In the present work, we assessed how animal seed dispersal might be affected by forest fragmentation in a sub-humid forest of West Africa. In agreement with our expectations, the results showed that MFs hold higher fruit availability, resulting in more interactions, even if the FE had a higher average number of interactions per transect. Network structure was similar in both forests, showing low nestedness, connectance, specialization, and modularity. In contrast, interaction evenness was high for both networks. Both networks showed a relatively high level of robustness, but it was higher in MF as predicted. Trees hold high structural importance in both habitat types and they pose a greater risk to network cohesion in the case of species extinction.
Habitat type and fruit availability
Despite MF having higher fruiting tree abundance and frugivore total richness, FE had a higher average number of species and abundance per transect, a result previously registered in other studies (Menke et al. Reference Menke, Böhning-Gaese and Schleuning2012; Saavedra et al. Reference Saavedra, Hensen, Beck, Böhning-Gaese, Lippok, Töpfer and Schleuning2014). This may result in part from some sampling bias, with higher detectability at the FE due to the lower tree height and canopy density. However, most of the differences in species abundance, composition, and richness between the two habitats are due to the occurrence of bird species typical from open and savanna habitats in the FE, e.g. Ploceus sp. (Borrow & Demey Reference Borrow and Demey2001). These species are probably attracted to EF due to the higher fruit abundance compared with open habitats (e.g., farmland and savanna) and a vegetation structure that allows these open-habitat species to reach those fruits (Menke et al. Reference Menke, Böhning-Gaese and Schleuning2012; Saavedra et al. Reference Saavedra, Hensen, Beck, Böhning-Gaese, Lippok, Töpfer and Schleuning2014).
MF seems less accessible to small open-habitat species, and overall, fruiting trees at MF were visited by large-bodied frugivores. Some fed exclusively at this habitat (e.g., C. elata). Hornbills and primates are among the most important seed dispersers in tropical forests (Poulsen et al. Reference Poulsen, Clark, Connor and Smith2002). Primates comprise 25%–40% of the frugivore biomass in these ecosystems (Chapman Reference Chapman1995). Large-bodied frugivores are essential seed dispersers, traveling long distances, having large home ranges and long gut passage time (Beaune et al. Reference Beaune, Fruth, Bollache, Hohmann and Bretagnolle2013). Moreover, due to their wide gape widths, they ingest seeds with sizes inaccessible to smaller frugivores (Schleuning et al. Reference Schleuning, Blüthgen, Flörchinger, Braun, Schaefer and Böhning-gaese2011). Large-bodied frugivores are increasingly vulnerable to extinction because they are susceptible to habitat loss and degradation and to poaching (Vanthomme et al. Reference Vanthomme, Bellé and Forget2010). The quality of the seed dispersal services in FE may already be compromised by the absence of large-bodied and generalist frugivores that provide functional redundancy to the system (Dugger et al. Reference Dugger, Blendinger, Böhning-Gaese, Chama, Correia, Dehling, Emer, Farwig, Fricke, Galetti, García, Grass, Heleno, Jacomassa, Moraes, Moran, Muñoz, Neuschulz, Nowak, Piratelli, Pizo, Quitián, Rogers, Ruggera, Saavedra, Sánchez, Sánchez, Santillán, Schabo, da Silva, Timóteo, Traveset, Vollstädt and Schleuning2019), thus hindering the potential for natural regeneration in these areas (Menke et al. Reference Menke, Böhning-Gaese and Schleuning2012).
Plant-Frugivore networks
The structure of plant–frugivore networks was similar between both habitats. Both networks showed low levels of nestedness and modularity, which is expected for networks with low connectance, such as those from Cantanhez (Fortuna et al. Reference Fortuna, Stouffer, Olesen, Jordano, Mouillot, Krasnov, Poulin and Bascompte2010). Modules for both networks included primates and birds, indicating that interactions are not necessarily constrained by phylogeny but are mainly limited by species traits (Mello et al. Reference Mello, Marquitti, Guimarães, Kalko, Jordano and de Aguiar2011a; Schleuning et al. Reference Schleuning, Ingmann, Strauß, Fritz, Dalsgaard, Matthias Dehling, Plein, Saavedra, Sandel, Svenning, Böhning-Gaese and Dormann2014). Considering that nestedness is often associated with network stability and reduction of interspecific competition, its higher value at FE may indicate protection for the persistence of less abundant species or more selective in their resource use as they are structured around a core of highly connected generalist species (Bascompte et al. Reference Bascompte, Jordano, Melian and Olesen2003; Fortuna et al. Reference Fortuna, Stouffer, Olesen, Jordano, Mouillot, Krasnov, Poulin and Bascompte2010).
Network specialization (H2’) was low for both habitats, concurrent with studies from other sub-tropical and tropical ecosystems (Menke et al. Reference Menke, Böhning-Gaese and Schleuning2012; Schleuning et al. Reference Schleuning, Fründ, Klein, Abrahamczyk, Alarcón, Albrecht, Andersson, Bazarian, Böhning-Gaese, Bommarco, Dalsgaard, Dehling, Gotlieb, Hagen, Hickler, Holzschuh, Kaiser-Bunbury, Kreft, Morris, Sandel, Sutherland, Svenning, Tscharntke, Watts, Weiner, Werner, Williams, Winqvist, Dormann and Blüthgen2012). However, frugivore species at FE seem to be more selective, which may be explained by differences in feeding preferences of the distinct frugivore communities (Menke et al. Reference Menke, Böhning-Gaese and Schleuning2012), as both habitats share all but one fruiting tree species. African seed dispersal networks often exhibit a homogeneous distribution of interactions across partners (Dugger et al. Reference Dugger, Blendinger, Böhning-Gaese, Chama, Correia, Dehling, Emer, Farwig, Fricke, Galetti, García, Grass, Heleno, Jacomassa, Moraes, Moran, Muñoz, Neuschulz, Nowak, Piratelli, Pizo, Quitián, Rogers, Ruggera, Saavedra, Sánchez, Sánchez, Santillán, Schabo, da Silva, Timóteo, Traveset, Vollstädt and Schleuning2019), as trees are frequently equitatively distributed amongst the disperser community, who in turn consume most of what is available. This tendency is revealed by the high levels of interaction evenness, low generality, and vulnerability, as fruiting trees had more dispersers (higher vulnerability) in MF. The high levels of interaction evenness suggest some level of functional complementary and increased functioning of ecological processes (Correia et al. Reference Correia, Timóteo, Rodríguez-echeverría and Mazars-simon2017), but in degraded or severely reduced habitats may also indicate a lack of available interaction partners (Blüthgen et al. Reference Blüthgen, Fründ, Vazquez and Menzel2008).
During the dry season in Cantanhez, fruiting trees are scattered and unsynchronized. Frugivores are thus compelled to crowd on a few trees or exploit those not yet saturated by other competitors. This behaviour results in homogenous resource use and possibly a complementary seed dispersal service (Schleuning et al. Reference Schleuning, Blüthgen, Flörchinger, Braun, Schaefer and Böhning-gaese2011). Most frugivore and tree species were generalists. Specialist tree species were the least abundant or had specific morphological traits (e.g., large fruit size) making them inaccessible for many frugivores.
High robustness of both frugivores and trees are usual features of mutualistic networks, particularly seed dispersal networks. It is also associated with low specialization and low modularity, allowing for functional redundancy (Mello et al. Reference Mello, Marquitti, Guimarães, Kalko, Jordano and de Aguiar2011b; Memmott et al. Reference Memmott, Waser and Price2004). These results are concurrent with the analysis of the dissimilarity of interactions, which showed a rearrangement of interactions between co-occurring species. This provides different paths for network persistence.
Lower sampling completeness for plant–frugivore links than frugivore or tree species was expected (Jordano Reference Jordano2016). Often low sampling may underestimate network parameters such as connectance or robustness, which are more sensitive to sampling effort and evenness. The low sampling completeness we found for the MF may reflect species detectability, as frugivores were less visible in this habitat due to both species-specific traits and vegetation characteristics. However, some non-observed interactions are often forbidden links, resulting from biological constraints (e.g., temporal or spatial uncoupling, reward mismatches, etc.), or simply because species are so rare in the system that their interaction probability is very low and only detectable by chance or through an insurmountable sampling effort (Jordano Reference Jordano2016). Nevertheless, most network parameters are quite robust to moderate sampling efforts. Moreover, using interaction frequency rather than binary matrices provides a better picture of the observed network (Blüthgen Reference Blüthgen2010).
Network species’ roles
Most species in the two habitats were networks peripherals. Only A. toxicaria and P. excelsa (the latter occurring only at the MF) were connector species. The loss of connector species may fragment the network into isolated modules, with unpredictable and potentially destabilizing consequences for the forests of Cantanhez (Olesen et al. Reference Olesen, Bascompte, Dupont and Jordano2007).
Considering the overall result for trees in both habitats, Ficus sp., P. excelsa, A. toxicaria, and S. pustulata are essential elements in the network according to species’ strength and structural roles. Figs are particularly important for frugivores and an essential resource across tropical forests (Shanahan et al. Reference Shanahan, So, Compton and Corlett2001). Studies have reported fig consumption and effective dispersal by many frugivore species (Whitney et al. Reference Whitney, Fogiel, Lamperti, Holbrook, Stauffer, Hardesty, Parker and Smith1998). Identifying species that are central to the functioning of the network, such as S. pustulata or fig trees, will greatly benefit forest regeneration strategies. Due to their fruits, these species will work as attraction points to a morphological and functional diverse community of frugivores that will fill a range of different ecological roles. Simultaneously, remnant isolated trees in abandoned fields or between once connected forest patches may then act as catalysts for succession, facilitating the recolonization of native vegetation (Brown & Lugo Reference Brown and Lugo1994; Wunderle Reference Wunderle1997). They will attract frugivores due to their fruits, but they will also attract frugivores that are morphologically different and thus may have different ecological roles (Howe, Reference Howe1993).
The most important frugivores were distinct between habitats; at the MF, these were P. troglodytes, C. mona, and C. elata, whereas, at the edge, that role fell to Ploceus sp. and P. barbatus. Both hornbills and primates are considered effective seed dispersers (Poulsen et al. Reference Poulsen, Clark, Connor and Smith2002). They consume different-sized fruits and disperse them across the landscape, even to degraded areas and open habitats (Wrangham et al. Reference Wrangham, Chapman and Chapman1994). The primates, C. mona and P. troglodytes, exhibit different behaviours with contrasting effects on seed dispersal. C. mona is considered a spitter (Kaplin & Lambert Reference Kaplin, Lambert, Levey, Silva and Galetti2002), and most seeds fall near the parent tree while only the smaller ones are swallowed. Seeds spitted near the parent tree are thus subject to density-dependent mortality due to increased predation and intra-specific competition (Traveset et al. Reference Traveset, Heleno, Nogales and Gallagher2014). P. troglodytes, however, swallows larger seeds, dispersing them at longer distances (Lambert Reference Lambert1999). These two animal groups – hornbills and primates – may be essential for the continuity of the seed dispersal service in sub-humid forests and should be targeted for active conservation and management practices in forests under increasing degradation. The network role of large frugivores may shed light on how degraded habitats around the world are performing or evolving through time. In the Cantanhez, it may be crucial to study the abundance and movements of large frugivores. Moreover, it would be helpful to understand how these patterns change according to forest gradients, to better illustrate the impact of deforestation on the seed dispersal network.
Ploceus sp. and P. barbatus, both occupy a great variety of habitats (Borrow & Demey Reference Borrow and Demey2001), with P. barbatus being important dispersers in other African habitats, tracking the fluctuating fruit availability (Schleuning et al. Reference Schleuning, Blüthgen, Flörchinger, Braun, Schaefer and Böhning-gaese2011). The role of Ploceus sp. as dispersers is still largely unknown (Bleher & Böhning-Gaese Reference Bleher and Böhning-Gaese2001). Although they are commonly considered seed predators, some authors have reported that some seeds will germinate after passing through the gut of these birds (Lieberman & Lieberman Reference Lieberman and Lieberman1986). The existence of an antagonism–mutualism continuum (Montesinos-Navarro et al. Reference Montesinos-Navarro, Hiraldo, Tella and Blanco2017), from seed disperser to seed predator, may indicate that species traditionally not considered seed dispersers should not be overlooked in this type of studies. Species such as Ploceus sp. and T. calvus may contribute to this process by transporting seeds from FE beyond forested habitats (Genrich et al. Reference Genrich, Mello, Silveira, Bronstein and Paglia2017; Heleno et al. Reference Heleno, Ross, Everard, Memmot and Ramos2010; Timóteo et al. Reference Timóteo, Ramos, Vaughan and Memmott2016). Most species in our system were habitat and dietary generalists, which may be a positive indicator, suggesting alternative paths for network persistence still exist (Bascompte & Jordano Reference Bascompte and Jordano2007; Blüthgen et al. Reference Blüthgen, Menzel, Hovestadt, Fiala and Blüthgen2007).
Species critical for network cohesion and persistence overlap with those with the highest species strength (A. toxicaria, Ficus sp. and Ploceus sp). K risk allows the identification of key species that preserve the cohesion of the global network, which ultimately is the goal of all conservation strategies (García-Algarra et al. Reference García-Algarra, Pastor, Iriondo and Galeano2017). Three of the four species with the highest K risk were trees, highlighting their structural importance for network cohesion and supporting the remaining community of frugivores. This ranking of vulnerability to possible extinction scenarios, and the coupling with other species-specific parameters, supports the elaboration of specific legislation to protect them. FE had three of those four species, which may indicate some level of fragility for this habitat, which concurs with FE’s lower robustness and stresses the importance of adding information on species-specific roles to assess network functional performance.
Conclusion
While both habitats have similar seed dispersal networks, the main differences emphasize a higher prevalence of large-bodied frugivores, lower specialization, and higher interaction evenness at the MF. These results reflect the increased robustness of this habitat and stress the importance of maintaining viable populations of large-bodied species that will likely ensure the continuity of this ecological function and the natural regeneration of fruiting tree species within and beyond the forest patch. The animal species with higher strength at the FE network are smaller birds, better adapted to open spaces. The network degree is lower, and consequently, its vulnerability is higher due to the lower number of disperser species per tree species. Overall, although edge habitats may allow for the persistence of less abundant or more selective species, it shows lower robustness to species’ extinction.
Despite the relatively positive outlook for both habitats, the FE shows a lack of large-bodied frugivores feeding on its trees and a network with at least three species that, if lost, may pose great risks for the maintenance of its function. Tree species seem to be the main elements keeping the structure of these networks, working as connectors, and holding positions of greater impact for its performance. Overall, large-bodied frugivores and fruiting-tree species that work as connectors within the network should thus be the focus of active conservation management in West African sub-humid forests. Only viable populations of these species will ensure a good performance of the seed dispersal network promoting the natural regeneration of these ecosystems.
Our findings have important implications for conserving seed dispersal networks across other African sub-humid forests. The pattern described above should hold in similar forests, even if communities change slightly. However, more studies are necessary to allow further generalizations. Similar long-termed studies should focus on analysing changes in interaction patterns along gradients of fragmentation and seasons. Data on nocturnal frugivores, seed viability, and the effectiveness of animal seed dispersal to degraded habitats are also needed. Integrating these distinct sources of information is of utmost importance to inform policy guidelines that ensure a balanced coexistence between human needs and the persistence of natural processes.
Supplementary material
To view supplementary material for this article, please visit https://doi.org/10.1017/S0266467422000062
Data availability statement
Matrices of plant–frugivore interactions are available at https://doi.org/10.6084/m9.figshare.12651923.v1
Acknowledgements
During the field work, we had the collaboration and logistic support of IBAP (Instituto da Biodiversidade e das Áreas Protegidas) and AD (Acção para o Desenvolvimento) in Guinea-Bissau. We wish to thank all IBAP staff, particularly Aissa Regala, Queba Quecuta, and Alfredo Simão da Silva, for their time and readiness to assist in all activities during fieldwork. We would like to thank AD (Acção para o Desenvolvimento) and AIN (Associazione Interptreti Naturalistici) for providing accommodation during our stay in Cantanhez. We are grateful to our field guides, Saidou Coiate, Mamadu, Braima Vieira, and Braima Cassamá, for their support and helpful input. We thank Luis Catarino for aiding in tree species identification and providing vast knowledge of the vegetation in the Cantanhez National Park. We thank Katy Orford for proofreading the manuscript.
Author contributions
AR and ST designed and supervised the study. PPC carried out fieldwork, led the analysis, and prepared the first draft of the manuscript. SG carried out fieldwork and assisted in identifying tree and animal species. All authors contributed critically to discussions and revisions of the manuscript.
Funding
ST and AR were funded by the Portuguese Foundation for Science and Technology (FCT) contract CEECIND/00135/2017 and UID/BIA/04004/2020, and grant SFRH/BPD/101983/2014, respectively
Competing interests
The authors declare none.