Introduction
Time reversal (TR) techniques [Reference Fink, Cassereau, Derode, Prada, Roux, Tanter, Thomas and Wu1] involve physical or synthetic retransmission of signals recorded by an antenna array in a time reversed fashion. They exploit the invariance of the wave equation in lossless and time-invariant media and enable the retransmitted signals to focus around the original source or target location. First proposed in acoustics [Reference Fink, Cassereau, Derode, Prada, Roux, Tanter, Thomas and Wu1] and introduced in electromagnetics later [Reference Lerosey, De Rosny, Tourin, Derode, Montaldo and Fink2], TR has drawn much attention in the past decade due to its useful properties such as temporal and spatial focusing, super-resolution, and statistical stability. TR has a wide range of applications including biomedical imaging [Reference Hossain, Mohan and Abedin3], power combining [Reference Zhao and Zhu4], wireless communication [Reference Yan, Wang and Han5], etc.
The time reversal mirror (TRM) [Reference Kosmas and Rappaport6] is a basic TR method that directly back-propagates the time reversed signals to image the target. The process of TRM is time consuming and it requires additional strategy to determine the focusing time. Moreover, in multi-target cases the weaker targets can be hardly detected due to the near-far problem [Reference Li and Xia7]. The TR operator (TRO) formed by the scattering multistatic data matrix (MDM) lays the foundation of two other important TR imaging methods: the decomposition of the TR operator (DORT) [Reference Prada, Manneville, Spoliansky and Fink8] and the TR multiple signal classification (TR-MUSIC) [Reference Lev-Ari and Devancy9]. For well-resolved point-like scatterers, the signal subspace eigenvectors of the TRO carry partial information about locations and strengths of the targets. The DORT employs the signal subspace eigenvectors to synthesize the set of back-propagating pulses and achieves selective focusing for different targets. The TR-MUSIC employs the noise subspace eigenvectors and achieves multi-target simultaneous focusing. Both DORT and TR-MUSIC exploit the MDMs at a single frequency, and the combination of the same MDMs at multiple frequencies forms the ultrawideband (UWB) extensions of the two methods, i.e. the time domain DORT (TD-DORT) [Reference Yavuz and Teixeira10] and the UWB-MUSIC [Reference Yavuz and Teixeira11] which can provide statistically stable images. However, the eigenvectors carry arbitrary and frequency dependent phases at each frequency, thus a preprocessing step is required to obtain coherent eigenvectors in the time domain to prevent degeneration of the imaging quality. Besides, in order to acquire the MDM, each antenna should transmit signal in sequence and all the antennas record the returns after each transmission, making it difficult to detect the moving targets in real time.
To overcome these problems, some alternative methods have been developed. Instead of the traditional space-space MDM, the space–frequency MDM (SF-MDM) whose columns and rows correspond to the space and frequency components of the received signals respectively is considered in the SF-TR [Reference Yavuz and Teixeira12, Reference Zhong, Liao and Lin13]. Applying the singular value decomposition (SVD) to the SF-MDM yields the left singular vectors where the information of the target location is encoded. Then, the left singular vectors are utilized to construct the retransmitted pulses to image the target, forming the fundamental of the SF-DORT. It has been proved that the SF-DORT has similar performance to the TD-DORT. However, the preprocessing step can be left out and only single measurement is required in the SF-DORT. Recently, a TR imaging approach based on the utilization of UWB frequency data has been proposed in [Reference Bahrami, Cheldavi and Abdolali14]. It applies the SVD to the new frequency–frequency MDM (FF-MDM) where each element corresponds to a received signal at fine and coarse frequencies. The obtained left singular vectors encode the coarse frequency dependence of the received signals and are used to form the imaging function of the FF-DORT. The data collection is implemented with the monostatic synthetic aperture radar (SAR), and the resulting image is constructed by overlapping the snapshots from different transceiver locations to get a higher resolution. However, the imaging quality is highly dependent on the frequency bandwidth of the received signal and the synthetic aperture size [Reference Bahrami, Cheldavi and Abdolali14, Reference Bahrami and Ghalibafan15], limiting the applications of the method. In practical cases of target detection, the requirement of large array aperture (compared with the target distance) is not always satisfied. Besides, the data collection of the FF-DORT is time consuming, making it hardly used for moving targets tracking.
In this paper, we propose a new TR imaging approach based on the space–frequency–frequency MDM (SFF-MDM) which is formed by the received signals through single measurement. After applying the SVD to the SFF-MDM, the left singular vectors corresponding to the signal subspace are divided into multiple subvectors using two schemes where the target signatures are revealed by the coarse frequency dependence and the relative phase shifts respectively. The final imaging function is constructed by employing the subvectors corresponding to different antenna locations as well as coarse frequencies. Numerical simulations are carried out to verify the performance of the proposed method for both single and multiple targets and the results are compared with the traditional FF-DORT. Furthermore, the imaging results based on the experimental data are also provided to show the effectiveness of the proposed SFF-DORT in practical applications.
TR imaging based on the SFF-MDM
Overview of the FF-DORT
Consider N antenna locations and P scatterers located in the probed domain. The nth antenna transmits the UWB pulse to the probed domain and the same antenna records the scattered signal. The received signals are transformed into the frequency domain and form the individual FF-MDM
 $${\bf K}_{{\rm FF}}^n = \left( \matrix{k_{11}^n (\omega_{11})\;\;...\;\;k_{1M}^n (\omega_{1M}) \hfill \cr \;\;\;\;...\;\;\;\;\;\;\;...\;\;\;\;\;\;...\;\;\;\; \hfill \cr k_{L1}^n (\omega_{L1})\;\;...\;\;k_{LM}^n (\omega_{LM})\; \hfill} \right),$$
where ω ij = ω 0 + (i − 1)ω c + (j − 1)ω f with ω 0 being the start frequency, ω c being the coarse frequency, and ω f being the fine frequency, i = 1, …, L, and j = 1, …, M. Here the scatterers are assumed to be point-like and well-resolved, thus the element  $k_{ij}^n $ can be represented as follows by using the Born approximation:
 $$k_{ij}^n = \sum\limits_{\,p = 1}^P {\tau _p(\omega _{ij})G^2({\bf x}_n,{\bf x}_p,\omega _{ij})s(\omega _{ij})}, $$
where τ p is the scattering coefficient of the pth target and s(ω ij) is the frequency spectrum of the probed signal.  $G({\bf x}_n,{\bf x}_p,\omega _{ij})$ is the Green's function between the nth transceiver location
 ${\bf x}_n$ and the pth target location
 ${\bf x}_p$, and the quadratic term is used because of the forward and backward propagation of waves in the monostatic mode. The Green's function can be approximatively decomposed into two parts corresponding to the coarse and fine frequencies respectively. Hence the FF-MDM can be expressed as
 $${\bf K}_{{\rm FF}}^n = \sum\limits_{\,p = 1}^P {\chi _n({\bf x}_p){\bf g}_n({\bf x}_p,\omega _c){\bf g}_n^T ({\bf x}_p,\omega _f)} $$
where the superscript T denotes the transposition and
 $$\eqalign{& {\bf g}_n({\bf x}_p,\omega _c) = [G^2({\bf x}_n,{\bf x}_p,\omega _{11}),...,G^2({\bf x}_n,{\bf x}_p,\omega _{L1})]^T \cr & {\bf g}_n({\bf x}_p,\omega _f) = [G^2({\bf x}_n,{\bf x}_p,\omega _{11}),...,G^2({\bf x}_n,{\bf x}_p,\omega _{1M})]^T} $$
are the background Green's function vectors that connect the pth target location to the nth transceiver location.  $\chi _n({\bf x}_p)$ is the coefficient in accordance with the Green's function approximation and the scattering strength of the pth target. Similar with the traditional TRO based algorithms, applying the SVD to the FF-MDM yields
 $${\bf K}_{{\rm FF}}^n = {\bf U}_{{\rm FF}}^n {\bf \Lambda} _{{\rm FF}}^n ({\bf V}_{{\rm FF}}^n )^H,$$
where the superscript H denotes the Hermitian conjugation.  ${\bf U}_{{\rm FF}}^n $ is the L × L matrix of left singular vectors,
 ${\bf V}_{{\rm FF}}^n $ is the M × M matrix of right singular vectors, and
 ${\bf \Lambda} _{{\rm FF}}^n $ is the L × M diagonal matrix of singular values. The coarse frequency dependence and fine frequency dependence of the received signals are encoded by
 ${\bf U}_{{\rm FF}}^n $ and
 ${\bf V}_{{\rm FF}}^n $ respectively. The imaging function of the FF-DORT is formed by utilizing the left singular vectors for all the N monostatic antenna locations
 $${\bf D}_p^\Omega ({\bf x}_s) = \prod\limits_{n = 1}^N {\langle{{\bf g}_n({\bf x}_s,\omega_c),{\bf u}_{{\rm FF}p}^n} \rangle} $$
with p = 1, …, P, where 〈, 〉 denotes the standard inner product, Ω is the sampling bandwidth,  ${\bf x}_s$ is the location of arbitrary pixel in the probed domain, and
 ${\bf u}_{{\rm FF}p}^n $ is the pth left singular vector of
 ${\bf U}_{{\rm FF}}^n $. The defined imaging function peaks at
 ${\bf x}_p$ as the inner product approximates the integrand given by
 $$\langle{{\bf g}_n({\bf x}_s,\omega_c),{\bf u}_{{\rm FF}p}^n} \rangle \approx \int_\Omega {{(G^2({\bf x}_n,{\bf x}_s,\omega ))}^{^\ast}G^2({\bf x}_n,{\bf x}_p,\omega )d\omega}. $$
The proposed TR method
The traditional FF-DORT multiplies the functions for N locations to enhance the cross-range resolution which is highly dependent on the frequency bandwidth of the received signal and the synthetic aperture size. As a result, the imaging resolution deteriorates when the size of the array aperture is limited even though UWB frequency is adopted. In order to achieve satisfactory imaging quality on the condition of limited array aperture, we introduce an approach based on the new SFF-MDM.
Different from the monostatic SAR strategy, here we consider an antenna array consisting of N elements and P scatterers located in the probed domain. The UWB pulse is transmitted from one antenna and the scattered signals are recorded by the whole array only once. The signal received by the nth antenna is used to form the individual FF-MDM described in (1). Then, all the N individual FF-MDMs are combined together, forming the new SFF-MDM
 $${\bf K}_{{\rm SFF}} = \left( \matrix{{\bf K}_{{\rm FF}}^1 \hfill \cr \;...\;\; \hfill \cr {\bf K}_{{\rm FF}}^N \hfill} \right) = \left( \matrix{k_{11}^1 (\omega_{11})\;\;...\;\;k_{1M}^1 (\omega_{1M}) \hfill \cr \;\;\;\;...\;\;\;\;\;\;\;...\;\;\;\;\;\;\;... \hfill \cr k_{L1}^1 (\omega_{L1})\;\;...\;\;k_{LM}^1 (\omega_{LM}) \hfill \cr \;\;\;\;...\;\;\;\;\;\;\;...\;\;\;\;\;\;\;... \hfill \cr k_{11}^N (\omega_{11})\;\;...\;\;k_{1M}^N (\omega_{1M}) \hfill \cr \;\;\;\;...\;\;\;\;\;\;\;...\;\;\;\;\;\;\;... \hfill \cr k_{L1}^N (\omega_{L1})\;\;...\;\;k_{LM}^N (\omega_{LM})\; \hfill} \right).$$
Each element of  ${\bf K}_{{\rm SFF}}$ is a frequency domain sample of the received signal and corresponds to a specific coarse frequency, fine frequency and antenna location. By applying the SVD directly to
 ${\bf K}_{{\rm SFF}}$ we obtain
 $${\bf K}_{{\rm SFF}}\;{\bf =}\; {\bf U}_{{\rm SFF}}{\bf \Lambda} _{{\rm SFF}}{\bf V}_{{\rm SFF}}^H, $$
where  ${\bf U}_{{\rm SFF}}$ is the (N × L) × (N × L) matrix of left singular vectors,
 ${\bf V}_{{\rm SFF}}$ is the M × M matrix of right singular vectors and
 ${\bf \Lambda} _{{\rm SFF}}$ is the (N × L) × M diagonal matrix of singular values. Each column of
 ${\bf U}_{{\rm SFF}}$ is an individual left singular vector, and the first P left singular vectors correspond to the P scatterers and span the signal subspace. The residual left singular vectors span the noise subspace which is orthogonal to the signal subspace.
Let us focus on the signal subspace and divide the pth left singular vector into N subvectors as follows:
 $${\bf u}_{{\rm SFF}p} = [({\bf u}_{{\rm SFF}p,sub_1})^T,...,({\bf u}_{{\rm SFF}p,sub_N})^T]^T.$$
Each subvector of a specific left singular vector comprises L elements encoding the coarse frequency dependence of the received signals and corresponds to the same specific scatterer. Similar to (6), the subfunction for imaging the pth target based on the nth subvector is defined as
 $${\bf I}_{\,p,n}^\Omega ({\bf x}_s) = \langle{{\bf g}_n({\bf x}_s,\omega_c),{\bf u}_{{\rm SFF}p,sub_n}} \rangle $$
with p = 1, …, P and n = 1, …, N, where
 $$\eqalign{{\bf g}_n({\bf x}_s,\omega _c) &= [G({\bf x}_t,{\bf x}_s,\omega _{11})G({\bf x}_s,{\bf x}_n,\omega _{11}),...,\cr& \quad G({\bf x}_t,{\bf x}_s,\omega _{L1})G({\bf x}_s,{\bf x}_n,\omega _{L1})]^T$$
is the L × 1 background Green's function vector and  ${\bf x}_t$ is the transmitter location. Forming the target image requires knowledge of the background Green's function vector at each pixel in the probed domain. In this paper the background Green's function of homogeneous medium is utilized as the target detection in free space is investigated.
However, the imaging function given in (11) only exploits partial information of the SFF-MDM to image the target, i.e. the target signatures contained by the coarse frequency dependence which can be regarded as the information provided by the absolute time delay of the received signals. Meanwhile, the SFF-MDM also reveals the target information in the form of relative phase shifts among different antennas which can be regarded as the information provided by the relative time delay of the received signals. To exploit the second part of information for target imaging, we rearrange the pth left singular vector  ${\bf u}_{{\rm SFF}p}$ as follows:
 $${\bf u}_{{\rm SFF}p} = [{\bf u}_{{\rm SFF}p,sub_1^{\prime}}\!,..., {\bf u}_{{\rm SFF}p,sub_L^{\prime}} ]^T,$$
where
 $${\bf u}_{{\rm SFF}p,sub_l^{\prime}} = [{\bf u}_{{\rm SFF}p,sub_1}^l\!,..., {\bf u}_{{\rm SFF}p,sub_N}^l ]$$
where  ${\bf u}_{{\rm SFF}p,sub_n}^l $ is the lth element of the nth “old” subvector
 ${\bf u}_{{\rm SFF}p,sub_n}$ with l = 1, …, L. By this way, the rearranged
 ${\bf u}_{{\rm SFF}p}$ will comprise L “new” subvectors, and each subvector of a specific left singular vector comprises N elements encoding the target signatures in the form of relative phase shifts and corresponds to the same specific scatterer. Hence, the subfunction for imaging the pth target can be constructed by employing the lth “new” subvector
 $${\bf I}^{\prime \Omega}_{\,p,l} ({\bf x}_s) = \langle{{\bf g}({\bf x}_s,\omega ),{\bf u}_{{\rm SFF}p,sub_l^{\prime}}} \rangle $$
with p = 1, …, P and l = 1, …, L, where
 $${\bf g}({\bf x}_s,\omega ) = [G({\bf x}_s,{\bf x}_1,\omega ),...,G({\bf x}_s,{\bf x}_n,\omega ),...,G({\bf x}_s,{\bf x}_N,\omega )]^T$$
is the N × 1 background Green's function vector at each pixel in the probed domain.
For acquiring high imaging resolution, the subfunctions given in (11) and (15) are combined together and overlapped with all the subvectors from N antenna locations and L coarse frequencies respectively. The final imaging function is defined as
 $${\bf F}_p^\Omega ({\bf x}_s) = \prod\limits_{n = 1}^N {\langle{{\bf g}_n({\bf x}_s,\omega_c),{\bf u}_{{\rm SFF}p,sub_n}} \rangle} \prod\limits_{l = 1}^L {\langle{{\bf g}({\bf x}_s,\omega ),{\bf u}_{{\rm SFF}p,sub_l^{\prime}}} \rangle} $$
with p = 1, …, P, and the proposed method is called the SFF-DORT.
In the new scheme the left singular vectors corresponding to dominant singular values, i.e. the signal subspace vectors are utilized for target imaging. However, it is difficult to extract the signal subspace when the number of targets is unavailable. Here we introduce a criterion based on [Reference Zhong, Liao and Lin13] to determine the number of targets in the probed domain. It is assumed that the scatterers are located in the far-field region from the antenna array so the received signals from a single scatterer can be approximately considered as parallel. The phase difference between the signals received by the nth and the (n + 1)th antennas can be represented by the phase difference between  ${\bf u}_{{\rm SFF}p,sub_l^{\prime}} ^n $ and
 ${\bf u}_{{\rm SFF}p,sub_l^{\prime}} ^{n + 1} $, denoted as Δφn here. Then the accumulated fluctuation of the phase differences corresponding to the lth subvector
 ${\bf u}_{{\rm SFF}p,sub_l^{\prime}} $ is calculated as
 $$\Delta \Phi _l = \sum\limits_{n = 1}^N {\left \vert {\vert {\Delta \varphi_n} \vert -\displaystyle{{\sum\nolimits_{i = 1}^{N-1} {\vert {\Delta \varphi_i} \vert }} \over {N-1}}} \right \vert}. $$
By adding together the accumulated fluctuations corresponding to all the L subvectors, we obtain
 $$\Delta \Phi = \sum\limits_{l = 1}^L {\displaystyle{{\Delta \Phi _l} \over L}}. $$
ΔΦ is calculated for each left singular vector: if the obtained value is small the signal comes from a real target and the corresponding left singular vector belongs to the signal subspace, otherwise it belongs to the noise subspace.
Results and discussion
In this section the performance of the proposed SFF-DORT is examined through different experiments. The finite-different time-domain method is used for the data collection in numerical simulations [Reference Taflove and Hagness16]. The probed domain is composed of 200 × 200 grids with grid size Δx = Δy = 1 cm and the perfectly matched layer is employed as the boundary condition to provide reflectionless truncation of the probed domain. Only the TMz case is considered here to provide isotropic scattering. The sinusoidal modulated Gaussian pulse with frequency ranging from 1 to 5 GHz is chosen as the probed signal. A uniform linear array (ULA) consisting of N = 10 antennas is placed parallel to the y-axis of the probed domain to accomplish the space–frequency measurement. The antenna elements are separated by half the center wavelength of the probed signal to reduce mutual coupling, and the size of the limited array aperture equals to D = 0.36 m.
Single target imaging
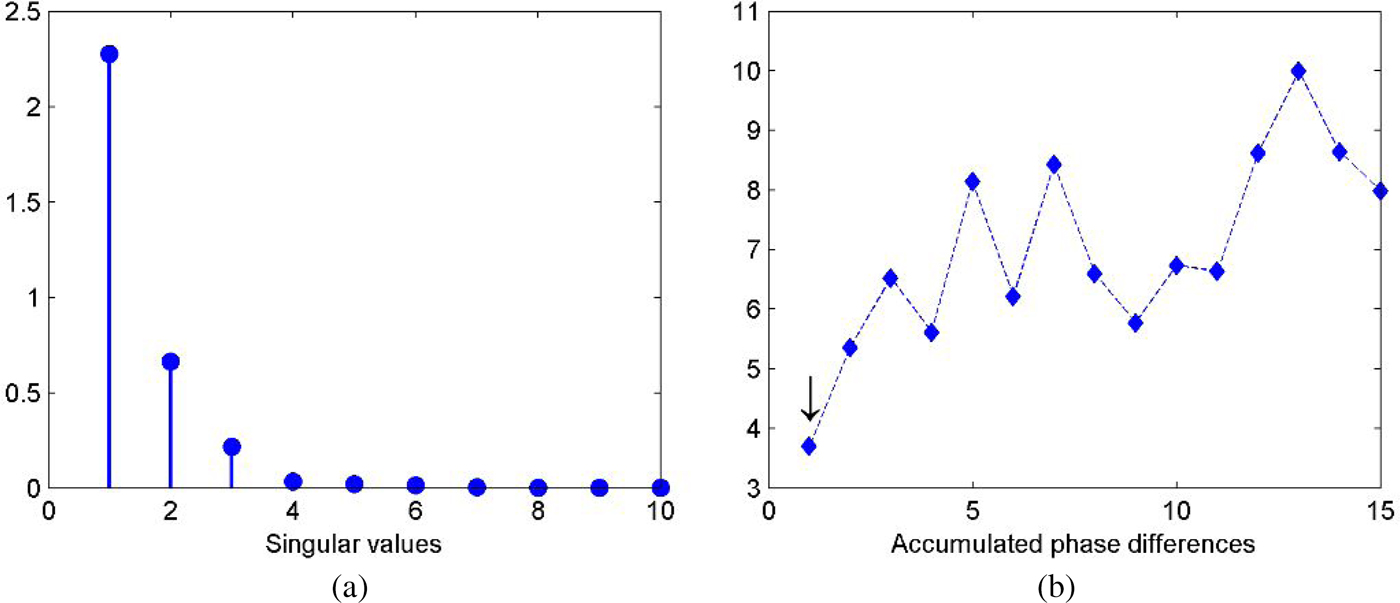
At first, we investigate the case for single target detection where a perfect electric conductor (PEC) point-like scatterer with radius r = 3 cm is located at (1.2 m, 0.75 m) in the probed domain. The seventh element of the antenna array which is located at (0.06 m, 1.01 m) serves as the transmitter and all the antennas record the signals only once. The received signals are used to constitute the SFF-MDM with coarse and fine frequencies being ω c = 120 MHz and ω f = 60 MHz over the frequency band, respectively. The corresponding singular values of the SFF-MDM are shown in Fig. 1(a) where we can see that the first singular value is much larger than the others. To further confirm the number of targets, accumulated values of the phase difference for the first fifteen left singular vectors are calculated according to (19) and plotted in Fig. 1(b). It shows that the first value is obviously smaller than the others so the target number equals to one, and the signal subspace is spanned by the first left singular vector.
(a) Singular values distribution. (b) Accumulated values of the phase difference.

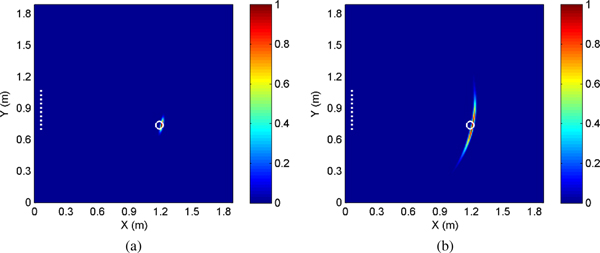
The target image obtained by the SFF-DORT is shown in Fig. 2(a). The maximum of pixel intensities is normalized to one, and locations of the antenna array and the actual target are both marked in the figure. It can be seen that the image peaks right at the target position and possesses satisfactory resolution despite of the limited array aperture. The imaging result given by the traditional FF-DORT is provided in Fig. 2(b) for a comparison. We can observe that the FF-DORT also achieves accurate positioning of the target, and the range resolution is fine thanks to the adopted wide bandwidth and the multiplying process in the algorithm. However, the cross-range resolution is relatively poor due to the limited array aperture.
Imaging results for the single target. (a) SFF-DORT image. (b) FF-DORT image.

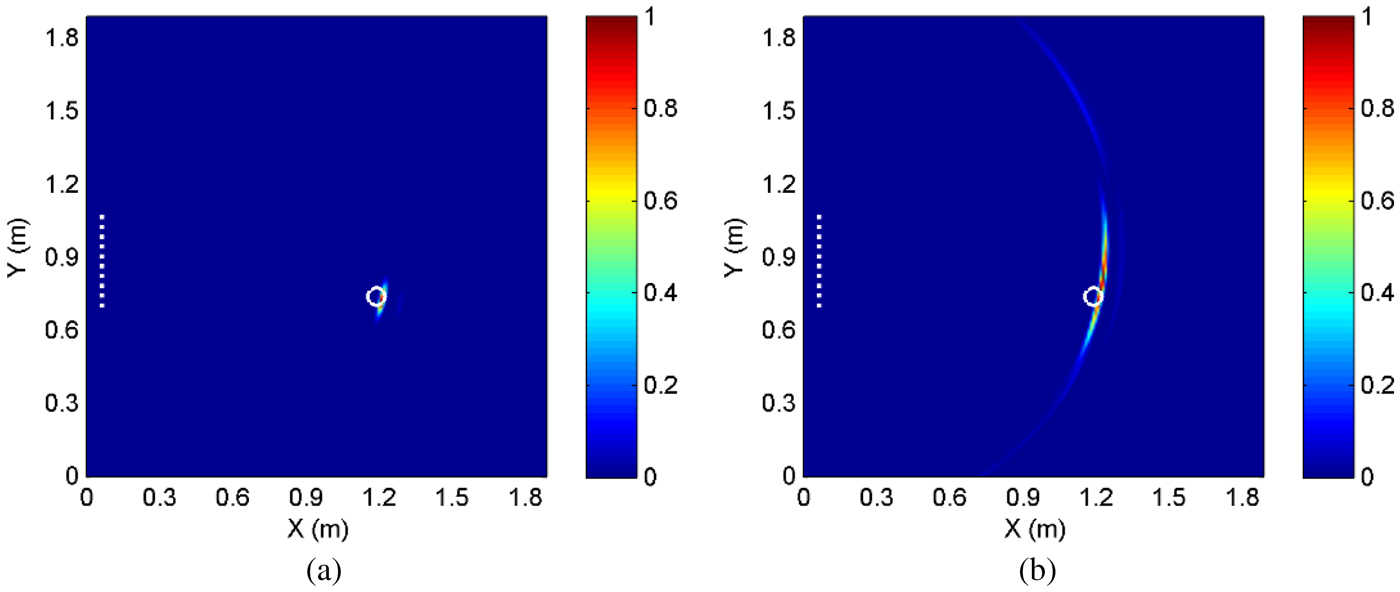
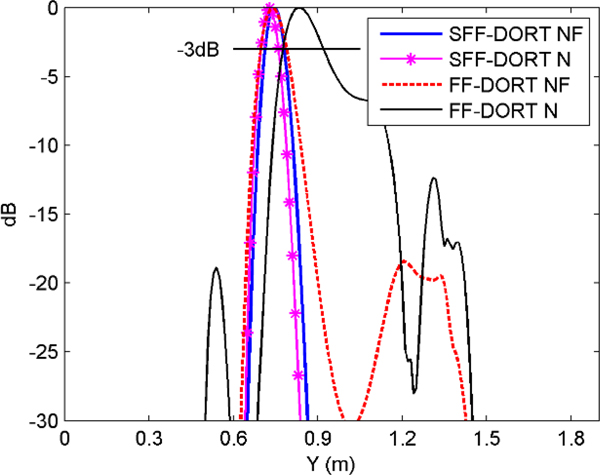
In order to evaluate the imaging performance in the strong noise environment, the white Gaussian noise with SNR = −5 dB is added to the received signals. The imaging results are demonstrated in Figs 3(a) and 3(b) where we can see that the SFF-DORT image maintains nearly as the image in the noise-free case, while decline of imaging quality and clutters in other non-target regions appear in the FF-DORT image. The results indicate that the SFF-DORT is more robust with the noise as more target signatures can be extracted from the SFF-MDM and the new imaging function is contributed by multiple subvectors, leading to the statistical stability in the noise environment. For a more straightforward comparison of the imaging performance, the normalized cross-range resolution of the SFF-DORT and the FF-DORT are depicted in Fig. 4 where “N” and “NF” represent noise and noise-free cases, respectively.
Imaging results for the single target in the noise environment. (a) SFF-DORT image. (b) FF-DORT image.

Comparison of the cross-range resolution.

Multiple targets imaging
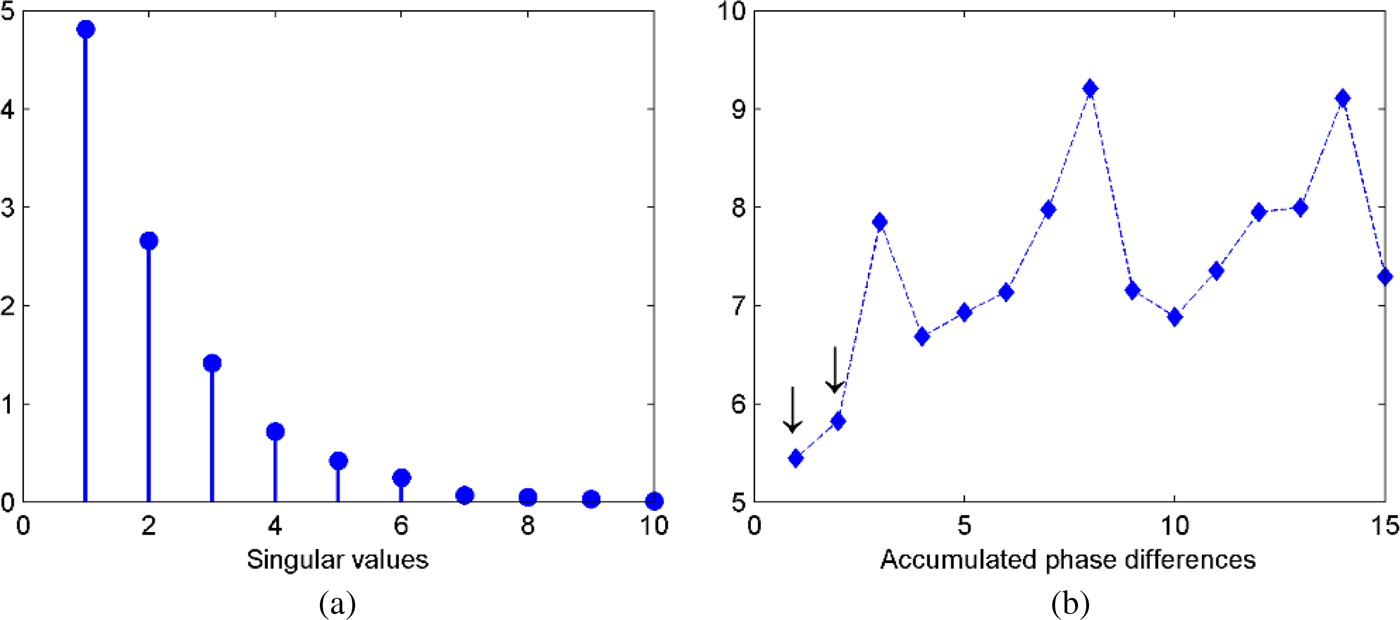
Next, we investigate the case for multiple targets detection. Two PEC point-like scatterers with radius r = 3 cm are located at (0.8 m, 0.8 m) and (1.4 m, 1.3 m) in the probed domain, standing for the nearer and further targets, respectively. The simulation setup remains the same as the case of single target. The corresponding singular values of the SFF-MDM and accumulated values of the phase difference are depicted in Figs 5(a) and 5(b) respectively. From Fig. 5(b) we can see that the first two values are obviously smaller than the others so the target number equals to two, and the signal subspace is spanned by the first and second left singular vectors.
(a) Singular values distribution. (b) Accumulated values of the phase difference.

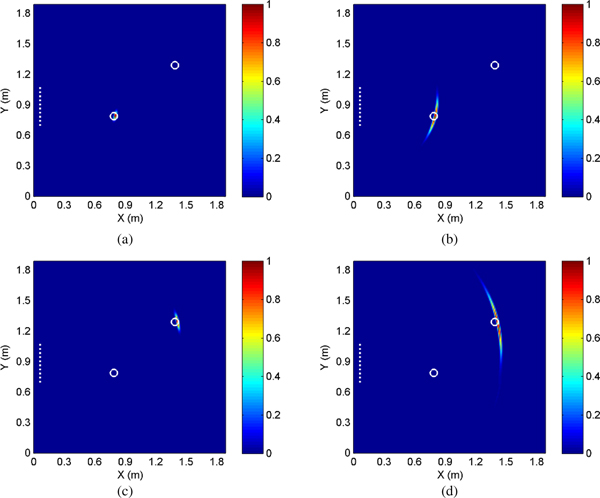
Selective imaging for different scatterers can be achieved by choosing different left singular vectors. The imaging results given by the SFF-DORT and the FF-DORT are shown in Fig. 6. As for the nearer target, both the two methods achieve accurate detecting and the SFF-DORT provides better cross-resolution. As for the further target, the imaging quality of the two methods both degenerate due to a greater distance of the target, however, the result given by the SFF-DORT is still satisfactory considering the contrast between the array aperture and the target distance.
Imaging results for multiple targets. (a) SFF-DORT image for the nearer scatterer. (b) FF-DORT image for the nearer scatterer. (c) SFF-DORT image for the further scatterer. (d) FF-DORT image for the further scatterer.

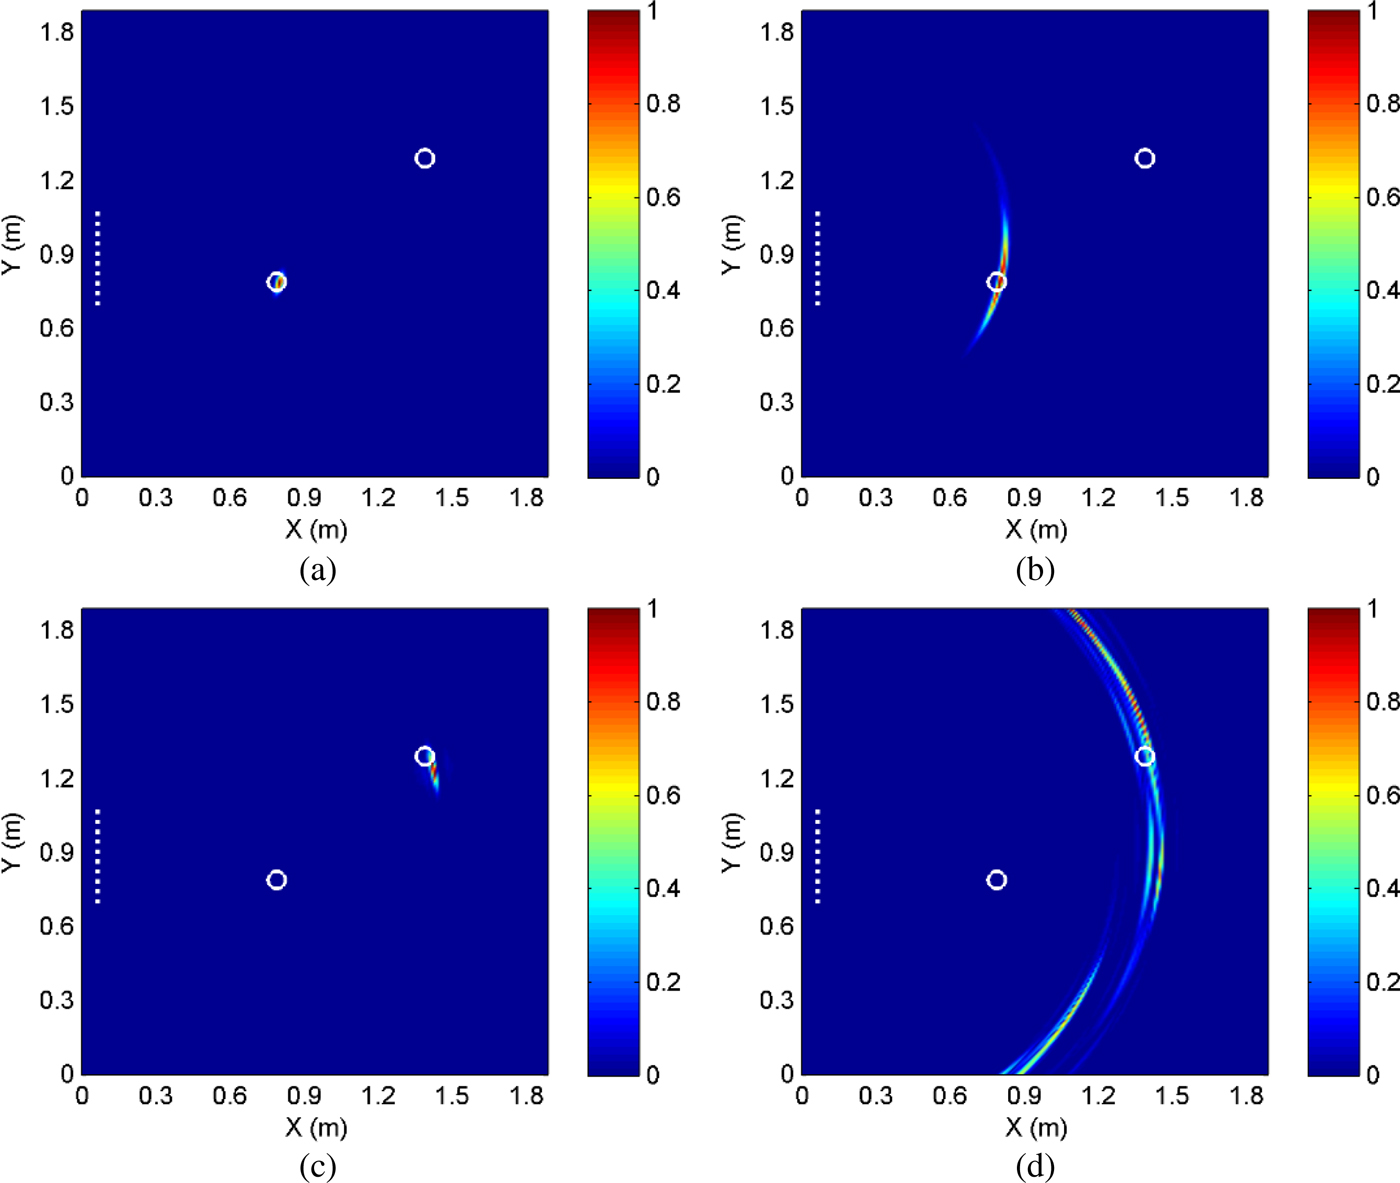
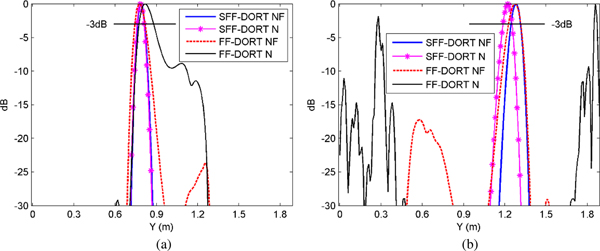
In addition, multiple targets imaging in the noise environment with SNR = −5 dB are studied, as shown in Fig. 7. From Figs 7(a) and 7(b) we can observe that for the nearer target the noise has little effect to the SFF-DORT image while it causes mild degeneration to the FF-DORT image. It is observed from Figs 7(c) and 7(d) that for the further target only a slight deviation from the actual target position appears in the SFF-DORT image while the imaging quality of the FF-DORT declines a lot, making it difficult to identify the target from the resulting image. The reason is that for the antenna array the further target is a relatively weaker scatterer which is affected by the noise more severely. The comparisons of the normalized cross-range resolution between the two methods are shown in Fig. 8 where the superiority of the SFF-DORT is demonstrated more clearly.
Imaging results for multiple targets in the noise environment. (a) SFF-DORT image for the nearer scatterer. (b) FF-DORT image for the nearer scatterer. (c) SFF-DORT image for the further scatterer. (d) FF-DORT image for the further scatterer.

Comparison of the cross-range resolution for (a) the nearer scatterer and (b) the further scatterer.

Experimental verification
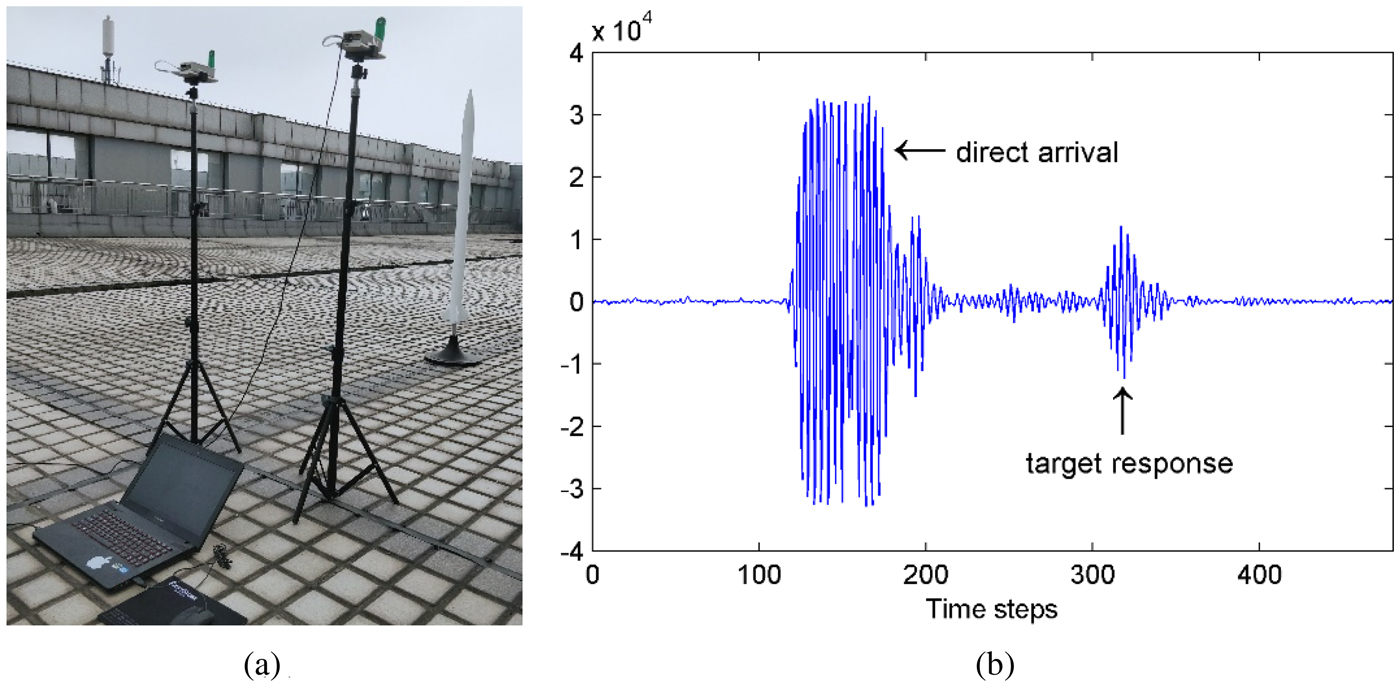
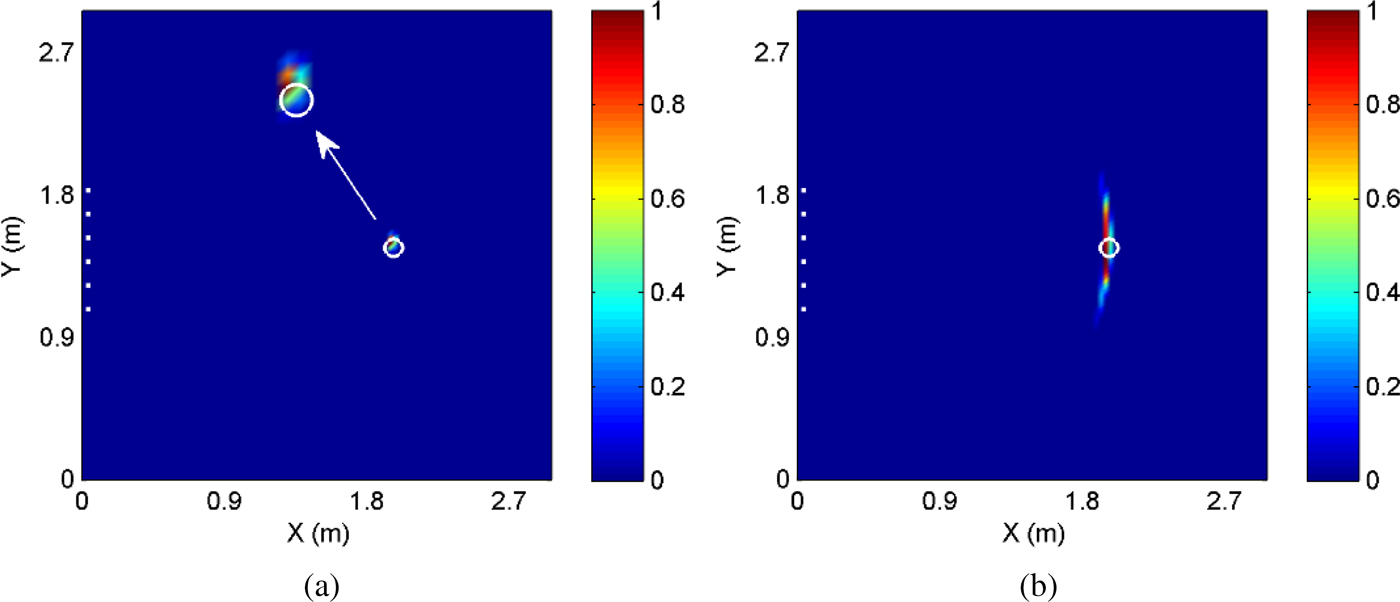
At last, the effectiveness of the proposed method is evaluated through a practical experiment. The PulsOn 440 (P440), a UWB radio transceiver operating between 3.1 and 4.8 GHz which is provided by the Time Domain Corporation, is adopted to configure the multistatic radar system. A pair of P440 modules are used for the synthesis of a ULA consisting of N = 6 elements with array aperture D = 0.75 m. The UWB pulse is emitted by the transceiver fixed at the third element and the other transceiver moves along the ULA to record the signals. The probed domain is 3 m × 3 m and a metal rocket model with radius r = 3.2 cm is located at (2 m, 1.5 m). The omni-directional antenna supporting a frequency range of 3.1–5.3 GHz is connected to the P440 for the radiation and reception of waveforms. The received waveforms can be displayed and saved to the host computer in real time by using the matched Channel Analysis Tool.
The experimental setup and one of the captured waveforms are demonstrated in Figs 9(a) and 9(b) respectively. The time windowing process is applied to the raw signals to remove the direct arrival and extract the target response due to the utilization of the omni-directional antenna. The imaging results given by the SFF-DORT and the FF-DORT are shown in Figs 10(a) and 10(b) respectively. It indicates that the proposed method achieves successful detecting with enhanced imaging quality based on the experimental data.
(a) Experimental setup. (b) Received waveform.

Imaging results based on the experimental data. (a) SFF-DORT image. (b) FF-DORT image.

Conclusion
In this paper, a novel TR imaging method is proposed where the target signatures can be extracted from coarse frequency dependence as well as relative phase shifts by applying the SVD to the new SFF-MDM. The imaging function which is contributed by multiple subvectors of the left singular vectors achieves selective imaging for different targets. The effectiveness of the SFF-DORT is demonstrated by applying it to imaging single and multiple PEC scatterers through numerical simulations. The comparisons with the FF-DORT show the superiority of the SFF-DORT in imaging resolution and robustness to the noise. Imaging results obtained by the experimental data preliminarily verify the availability of the method in practical applications. Moreover, the SFF-DORT requires only single space–frequency measurement by the antenna array thus it is applicable to moving targets detecting. The proposed SFF-DORT has potential applications in various areas including microwave breast cancer detecting, through-the-wall imaging, nondestructive testing, etc.
Furthermore, the proposed SFF-MDM can be also extended to the MUSIC methods to acquire better imaging resolution even for the case where scatterers are not well-resolved. However, the MUSIC methods are not as robust as the DORT methods under high-level clutter or noise. In future research, applying the SFF-MDM to the MUSIC methods as well as dealing with the noise will be investigated.
Acknowledgements
This work was supported by the National Natural Science Foundation of China under Grant 61271331 and Grant 61571229.
 Tong Mu received his B.E. degree in electronic information engineering from the Nanjing University of Science and Technology in 2014. He is now pursuing his Ph.D. degree in information and communication engineering. His main research interests are antenna array, radar signal processing, and microwave imaging.
 Yaoliang Song received his B.E., M.E., and Ph.D. degrees in electrical engineering from the Nanjing University of Science and Technology, in 1983, 1986, and 2000, respectively. He has been a researcher fellow at the Department of Engineering Science at the University of Oxford from September 2004 to September 2005. He now is a professor at the Nanjing University of Science and Technology. His major research interests include UWB communications, UWB radar imaging, and advanced signal processing.