Did repression decrease in Guatemala after the end of the Cold War? Is Uzbekistan more repressive today than when it first emerged as an internationally recognized state? Was Latin America a more repressive region than the rest of the world in the 1980s? The promise of a science of international human rights relies on the ability to provide transparent and realistic answers to descriptive questions like these. Unfortunately, as we argue in this article, the measures currently used in the quantitative human rights literature are ill suited to the task of comparing levels of repression between countries or over time. In this article, we provide a theoretically motivated measurement model that enhances researchers’ ability to compare repression levels across time and space.
This project provides several distinct contributions to political science research. We emphasize the special importance of measurement in human rights research relative to many other areas of political science. Precise scoring of repression levels using available information in different countries is directly useful to international and non-governmental organizations (NGOs). Moreover, considerable scholarly attention focuses on the efficacy of “naming and shaming” campaigns, which are claimed to improve human rights practices.Footnote 1 If these claims are true, the availability of messages that can more precisely discriminate between repression levels in different countries may enhance the persuasive power of such techniques.
The model developed in this article allows descriptive human rights questions like those posed above to be answered in the form of a probability. The resulting model estimates provide the first source of information that allows for direct, probabilistic comparisons of levels of human rights abuse between cases. Until now, analysts who wished to compare two cases had to rely on case-specific evidence or additive human rights indices. Case-specific evidence limits the number of comparisons that can be made and does not provide an estimate that can be compared alongside other pairwise comparisons. The additive indices that predominate the quantitative human rights literature can provide yes or no answers, but rely on unrealistic assumptions about the data-generating process and do not allow uncertainty estimates. For example, two countries that receive the same score on one of the standard additive human rights scales are assumed to be the same with probability 1, and if another country-year pair receives different scores, then they are assumed to be different with probability 1. Furthermore, the human rights estimates generated by our model are interval-level measures, which simplifies data analysis for applied human rights researchers.Footnote 2
The article also provides a methodological contribution to international relations scholars more generally. Though ordinal measurement models are currently used elsewhere in international relations (Treier and Jackman Reference Treier and Jackman2008; Pemstein, Meserve and Melton Reference Pemstein, Meserve and Melton2010), these models assume that the observed indicators are independent conditional on the value of the trait to be estimated. We demonstrate, however, that this is an overly strong assumption in the case of human rights data. In contrast to this approach, we use hierarchical priors that allow the estimated latent respect for human rights in a country in a particular year to depend on that country's value in the previous year.
Though we justify the dynamic measurement model for estimating latent human rights theoretically, we believe that a dynamic model similar to ours would be useful for measuring democracy and other temporally dependent processes. Our results suggest that our dynamic approach should be incorporated into models of democracy and other concepts used in time-series cross-sectional studies. Finally, we present three model comparison statistics—deviance information criterion, posterior predictive checks and predictive validity tests—which all demonstrate that the physical integrity and empowerment estimates produced by the dynamic model outperform those produced by a static model similar to the one used by Pemstein, Meserve and Melton (Reference Pemstein, Meserve and Melton2010) and Treier and Jackman (Reference Treier and Jackman2008).
This article proceeds as follows. In Section 2 we review existing methodological approaches for modeling latent variables and measuring uncertainty and introduce the Bayesian ordinal item-response theory (O-IRT) model and the theoretical justification for our proposed dynamic version(DO-IRT). Section 3 applies the DO-IRT and O-IRT models to the Cingranelli and Richards (CIRI) physical integrity rights and empowerment rights data. Section 4 presents parameter estimates obtained from the DO-IRT and O-IRT models for both physical integrity and empowerment rights and several probabilistic answers to the descriptive questions posed above. Section 5 discusses several model fit statistics and demonstrates the improvement of the dynamic model over the static version by conducting posterior predictive checks and comparing the latent variables to the existing additive scales. Section 6 demonstrates how to incorporate the new measures into applied research. Finally, Section 7 concludes.
Measurement of Human Rights Practices
There is considerable debate in the human rights and repression literatures regarding the appropriate ways to measure relevant concepts.Footnote 3 Scholars have recently taken issue with the CIRI data because of its use of additive scales:
Specifically, we question the logic of summing these categories to establish this picture because, in doing so, users must make the assumption that an act of torture is equivalent to a disappearance or that an extrajudicial killing is equivalent to an instance of arbitrary imprisonment (Wood and Gibney, Reference Wood and Gibney2010).
Though this has sometimes been interpreted as a criticism of the data source, we note that this objection applies not to the source of the data but to the additive scale as a model for aggregating indicators. The modeling approach used in this article helps alleviate existing concerns with the kinds of data that are used to provide quantitative answers to human rights questions. The criticism made by Reference Clark and SikkinkClark and Sikkink (forthcoming) is directed at the documentary sources of the data and indirectly at the overreliance on the data derived from these sources. Though we are not able to confront this issue directly in this article, we do make some suggestions about extending our model, which can address the criticism of the data sources, given the availability of other sources of information.
Although we ultimately agree with Wood and Gibney that the assumption of equal weights between indicators is inadequate, the importance of utilizing multiple indicators of the same concept should not be underestimated. As Jackman (Reference Jackman2008) points out, a researcher with only one indicator of a latent construct is unable to determine how much variation in the indicator is due to measurement error as opposed to variation in the latent construct.
Furthermore, the quality of the inferences made about repression levels depends on clearly specifying a theoretically informed model that best approximates reality, or in modeling terms, the data-generating process. Alison Brysk (Reference Brysk1994) makes this point in an essay that highlights the difficulties inherent in the measurement of repressive actions. She notes “the importance of careful specification of the political processes being modeled through measurement and explicit justification of the use of particular measures to represent those processes” (1994, 692). We take up this challenge here and develop a model that explicitly assumes that repressive practices are related over time in that the pattern of abuses committed today might change the use of (or even the need for) future repressive actions for a certain period of time (Duvall and Stohl Reference Duvall and Stohl1983; Stohl et al. Reference Stohl, Carleton, Lopez and Samuels1986). Our model is the first in the human rights literature to formalize this idea in the measurement of repression. We then assess the usefulness of incorporating this idea into the model by comparing it to a model that does not make such an assumption.
Our model assumes there is an underlying trait that can be estimated using observed outcomes (that is, the items or responses). We are therefore able to focus on estimating a single physical integrity latent variable using the four physical integrity indicators measured by Cingranelli and Richards (Reference Cingranelli and Richards2012a) and a single empowerment latent variable using seven empowerment indicators, which we describe below. This distinction is important, because Landman and Carvalho (Reference Landman and Carvalho2009) include measures that are not physical integrity rights in their factor analysis. However, these variables may be better captured by the Cingranelli and Richards (Reference Cingranelli and Richards2012a) Empowerment Index. We therefore choose to build on the considerable research conducted by Cingranelli, Richards and their co-authors and estimate our dynamic latent variable model using only the indicators coded as part of the CIRI data project.Footnote 4
To estimate the physical integrity and empowerment latent variables, we build on existing IRT models, which are increasingly important in political science. Static measurement models in political science are well developed for use with binary data, and have been developed especially for the case of recovering the ideal points of political actors. The seminal work on measuring ideal points from roll-call data is the NOMINATE project (Poole Reference Poole2005; Poole and Rosenthal Reference Poole and Rosenthal1991, Reference Poole and Rosenthal1997), which employs a maximum likelihood approach to the problem and remains the most widely used model for this purpose in Congressional politics. This model has been applied in comparative politics (Desposato Reference Desposato2006) and to the United Nations General Assembly (Voeten Reference Voeten2000). The Bayesian approach to the problem, based on IRT, was used by Clinton, Jackman and Rivers (Reference Clinton, Jackman and Rivers2004). Martin and Quinn (Reference Martin and Quinn2002) extended the approach to incorporate dynamics and applied the model to the US Supreme Court. Political scientists have now published many extensions and applications of the binary item-response model (Aleman and Saiegh Reference Aleman and Saiegh2007; Lauderdale Reference Lauderdale2010; Rosas and Shomer Reference Rosas and Shomer2008).
The item-response model related to the one employed by Clinton, Jackman and Rivers has been extended to include ordinal items.Footnote 5 The ordinal item-response model was applied to estimates of democracy by Treier and Jackman (Reference Treier and Jackman2008). Quinn (Reference Quinn2004) developed a model that incorporates both ordinal and interval responses and applies it to data on political risk. Pemstein, Meserve and Melton (Reference Pemstein, Meserve and Melton2010), in the Unified Democracy Scores project, apply a model similar to Quinn's to aggregate several measures of democracy into a single scale. In this article, we build on the standard ordinal item-response model like the one employed by Treier and Jackman (Reference Treier and Jackman2008).
Our methodological contribution is to extend ordinal item-response models into a dynamic setting. This endeavor has already been successful in the case of binary item-response models. The DW-NOMINATE procedure (Poole and Rosenthal Reference Poole and Rosenthal1997) is a dynamic version of W-NOMINATE which estimates idea points as a function of ideal points in the previous time period. Like the model presented in this article, the Martin and Quinn model accounts for temporal dependence in the data by specifying a prior for each value of the latent variable centered at the estimated latent variable from the same unit in the previous time period. A few other approaches to dynamic measurement can be found in the literature. Rosas (Reference Rosas2009), for example, estimates a latent trait model that places an autoregressive structure on the covariance between factor scores. To our knowledge, this article provides the first dynamic ordinal IRT model.
A Measurement Model of Human Rights Respect
The strategy used in this article is to derive and then apply a measurement model to the CIRI human rights dataset. This data is used to construct two additive scales that are commonly used in the quantitative human rights literature. Though a strength of our model is that it can easily be extended to incorporate information from a wide variety of sources, the CIRI dataset is ideal for introducing the method because the reliabilities of the two CIRI scales are already established and because they facilitate comparison between our measurement model and the additive approach.Footnote 6 By reliable, we mean that the CIRI variables consistently represent the content of the human rights reports published annually by the US State Department and Amnesty International, based on their own coding criteria.
Though the CIRI scales are reliable, some scholars question their validity.Footnote 7 Wood and Gibney (Reference Wood and Gibney2010) question the precision of the CIRI coding guidelines to categorize the reports’ content. Reference Clark and SikkinkClark and Sikkink (forthcoming) question the CIRI dataset's ability to compare coded reports from earlier periods that were quantifiably less informative than more recent ones based on raw word counts taken directly from some of the US State Department reports. The argument made by Wood and Gibney (and more recently by Clark and Sikkink) relates to the validity of the CIRI scales relative to the theoretical construct of interest: respect for human rights. If Cingranelli and Richards were only interested in accurately measuring the content of the reports, then Clark and Sikkink would have little reason to question the validity of the resulting variables, because Clark and Sikkink's argument is based on changes to the content of the human rights reports themselves. This is an important theoretical distinction that is often overlooked when the CIRI data and other variables based on the human rights reports are presented as measurements of repression rather than of reported repression.
Our model is based only on the CIRI data, which allows us to directly address the issue raised by Wood and Gibney (Reference Wood and Gibney2010) but not Reference Clark and SikkinkClark and Sikkink (forthcoming). However, the model is extendable and can incorporate new theoretical insights and data, which can then be used to assess the validity of the resulting estimates relative to the theoretical construct of interest: respect for human rights. Model comparison techniques are developed below that help us establish the validity of our dynamic measurement model relative to an alternative. Future research will be able to explore how these and other variables vary in the level of information they provide about repression by introducing additional information about repression and human rights into our dynamic measurement model and then using the same model comparison techniques we describe below. In the next subsection, we introduce the data and the justification for our proposed dynamic measurement model (DO-IRT).
Human Rights Indicators
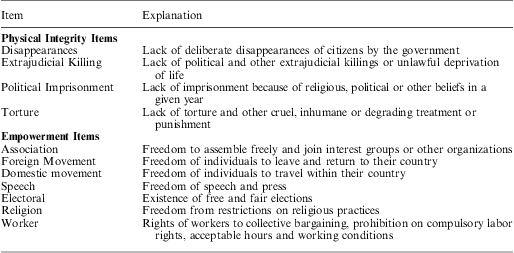
The Cingranelli and Richards (Reference Cingranelli and Richards1999) Physical Integrity Scale is a single 9-point ordinal scale that ranges from 0 to 8 and is measured from country practices documented in human rights monitoring reports by the US State Department and Amnesty International. The CIRI data use this information to code violations of four individual physical integrity variables (political imprisonment, torture, extra-judical killing and disappearances).Footnote 8 As part of the larger CIRI data project Richards, Gelleny and Sacko (Reference Richards, Gelleny and Sacko2001) introduced several new variables that were scaled together to create the CIRI Empowerment Index.Footnote 9 The CIRI empowerment variables are also listed and described in Table 1 and are discussed at length in Richards, Gelleny and Sacko (Reference Richards, Gelleny and Sacko2001). Each index is based on the human rights reports from the US State Department and Amnesty International for all countries each year.
Variables in Human Rights Scales

Note: The sources for all variables are Cingranelli and Richards (Reference Cingranelli and Richards1999, Reference Cingranelli and Richards2010, Reference Cingranelli and Richards2012a,Reference Cingranelli and Richardsb); Richards, Gelleny and Sacko (Reference Richards, Gelleny and Sacko2001).
We use all observations from 1981 to 2009, for a total of 4,518 country-years. Each CIRI human rights variable measures the level of violation on an ordinal scale where 2 indicates that the right is not violated, 1 indicates that the right is violated occasionally and 0 indicates that the right is violated frequently. If the reports provide information about the number of individuals affected by a given rights violation, then the following cut-offs are used:
Level 0: 50 or more occurrences
Level 1: 1 to 49 occurrences
Level 2: 0 occurrences
According to the coder guidelines, if an estimate of the number of violations is not be available then the following guidelines from the CIRI codebook (Cingranelli and Richards, Reference Cingranelli and Richards2012a) are used:
• Instances where violations are described by adjectives such as “gross”, “widespread”, “systematic”, “epidemic”, “extensive”, “wholesale”, “routine”, regularly or likewise, are to be coded as a ZERO (have occurred frequently).
• In instances where violations are described by adjectives such as “numerous”, “many”, “various” or likewise, you will have to use your best judgment from reading through the report to decide whether to assign that country a ONE (have occurred occasionally) or a ZERO (have occurred frequently). Look for language indicating a pattern of abuses; often, these cases merit a ZERO.
Thus there is a certain level of precision implied by the CIRI coding guidelines, as argued by Wood and Gibney (Reference Wood and Gibney2010). However, our model directly confronts this issue by estimating the uncertainty of the latent variable estimates of human rights, which we describe in detail below.
Model Parameterization
We assume that the observed indicators for each country-year are functions of a unidimensional latent variable that represents the level of respect for human rights. To make this assumption more realistic, we run separate models using the physical integrity and empowerment indicators. For each country-year observation, let i index the country and t index the year. For each model, there are J indicators J = 1,…, J, each of which is ordinal with levels 0 (no respect), 1 (moderate respect) and 2 (full respect). Our goal is to estimate each θit, which is the latent level of respect for physical integrity or empowerment rights of country i in year t.
Let i = 1, …, N index cross-sectional units and t = 1, …, T index time periods. In each time period, we observe values yij for each of j = 1,…,J indicators for each unit. Each indicator is ordinal in nature and can take on Kj values. The responses to each of the items depend on a single latent variable θit which may vary across units and over time.
For each item, there is an “item discrimination” parameter βj and a set of Kj−1 difficulty cut-points  $$$\left( {{{\alpha }_{jk}}} \right)_{{k\, = \,{\rm{1}}}}^{{{{k}_j}}} .$$$
For each item, yitj = k if
 $$${{\alpha }_{jk\,{\rm{ - }}\,1}}\, \less \,{{\theta }_{it}}{{\beta }_j}\, + \,{{{\epsilon}}_{itj}}\, \lt \,{{\alpha }_{j,k}}$$$
, where εitj is an error term and αj 0 = −∞ and
 $$${{\alpha }_{j{{k}_j}}}\, = \,\infty $$$
for notational convenience. The theoretical interpretation of the error term depends on the application. In the case of survey responses, individuals’ responses to the questions may depend stochastically on the true latent variable. The applications we present below are based on human coding of documents, so it is natural to assume that εitj represents perceptual error on the part of the coders and reporting error on the part of the organizations that collect and aggregate the information that make up the documents. Obtaining a likelihood for this model depends on specifying a distribution for the εitj terms. In this case, we assume that they are independently drawn from a logistic distribution.
It follows that the probability distribution for a given response to item j is given by:
 $$P\left[ {{{y}_{itj}}\, = \,k} \right]\, = \,F\left( {{{\alpha }_{jk}}\,{\rm{ - }}\,{{\theta }_{it}}{{\beta }_j}} \right)\,{\rm{ - }}\,F\left( {{{\alpha }_{jk\,{\rm{ - }}\,1}}\;{\rm{ - }}\;{{\theta }_{it}}{{\beta }_j}} \right),$$
where F(·) denotes the logistic cumulative distribution function. Therefore, assuming local independence of responses across units, the likelihood functionFootnote 10 for β, α and θ, given the data is:
 $${\cal L}\left( {\beta, \alpha, \theta {\rm{|}}y} \right)\, = \,\prod\limits_{i\, = \,{\rm{1}}}^N {\prod\limits_{t\, = \,{\rm{1}}}^T {\prod\limits_{j\, = \,{\rm{1}}}^J {\left[ {F\left( {{{\alpha }_{j{{y}_{it\,j}}}}\,{\rm{ - }}\,{{\theta }_{it}}{{\beta }_j}} \right)\,{\rm{ - }}\,F\left( {{{\alpha }_{j{{y}_{it\,j}}\,{\rm{ - }}\,1}}\,{\rm{ - }}\,{{\theta }_{it}}{{\beta }_j}} \right)} \right].} } } $$
If θ was fully observed, the likelihood function above would be equivalent to independent ordinal logistic regression models. Since θ is unobserved, we are faced with the task of estimating the latent data along with the item-discrimination parameters and difficulty cut-points.
The products in Equation 1 reflect the local independence assumption utilized in some form by all IRT models. This implies that any two item responses are independent conditional on θ. That is, two item responses are only related because they measure the same latent variable. In this model, there are three relevant local independence assumptions, each of which is related to one of the products taken in Equation 1. The assumptions are: (1) local independence of different indicators within the same country-year, (2) local independence of indicators across countries within years and (3) local independence of indicators across years within countries.
Assumption 1 is strong in that it rules out causal relationships between items. For example, we assume that torture cannot cause an increase or decrease in political imprisonment, so any correlation between these two items is explained by the latent respect for physical integrity rights within a country. Though this assumption is made explicit in IRT models, we are unaware of existing human rights research that does not implicitly make an equally strong independence assumption. For instance, if a researcher runs a separate regression on each indicator to reach a broad conclusion about human rights practices, independence of errors is required to obtain efficient estimates. Furthermore, the additive index approach, based on Cingranelli and Richards’ Mokken Scaling Analysis, is an IRT-based model that makes the identical conditional independence assumption that the (static) ordinal IRT model makes.Footnote 11
Assumption 2 may be problematic in many time-series cross-sectional data. Time period-specific shocks may cause increases or decreases in responses across many countries in the same year. In human rights data, however, the influence of these events on our estimates will be small, since within-country variation in our indicators is small compared to the between-country variation.
We depart from standard measurement models in the literature by relaxing Assumption 3. We argue that Assumption 3 is most problematic in many time-series cross-sectional datasets. For instance, if the behavior caused by the latent variable tends to persist over time, the local independence assumption is violated and researchers should expect biased estimates of the latent variable. We account for such dynamics while maintaining the basic form for Equation 1 by incorporating temporal information into prior beliefs about θ, as we describe below.
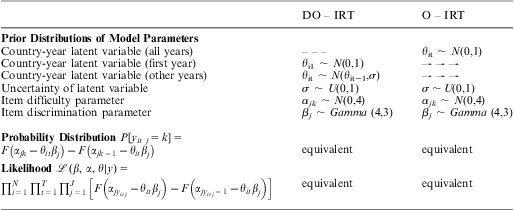
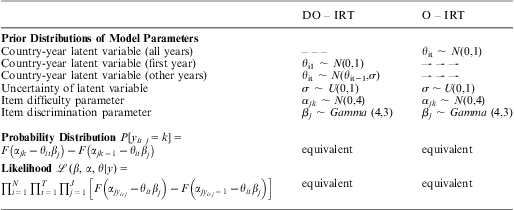
For the purposes of comparison, we estimate our dynamic model alongside the standard static IRT model described in Treier and Jackman (Reference Treier and Jackman2008). The difference between the standard ordinal IRT (O-IRT) model and the dynamic ordinal IRT (DO-IRT) model lies in the specification of the hierarchical priors for θit. For the O-IRT model, we place independent standard normal priors on each θit. In other words,
 $${{\theta }_{it}}\, \sim \,N\left( {0,1} \right)$$
for all i and t. For the DO-IRT models, we use the same standard normal prior when t = 1 and
 $${{\theta }_{it}}\, \sim \,N\left( {{{\theta }_{it\,{\rm{ - }}\,{\rm{1}}}},\sigma } \right)$$
for all other years. This method of incorporating dynamics was implemented in the context of a dichotomous IRT by Martin and Quinn (Reference Martin and Quinn2002). One difference between our model and the Martin and Quinn model, besides our ordinal implementation, is that we estimate σ instead of specifying it a priori.
The prior for variance σ is modeled as U(0,1). This reflects our prior knowledge that the between-country variation in human rights respect will be much higher on average than the average within-country variance.Footnote 12 Slightly informative gamma priors Gamma(4,3) were specified for the β parameters. The prior on β has strictly positive support to reflect our prior belief, based on the Cingranelli and Richards (Reference Cingranelli and Richards1999) article, that all indicators contribute significantly (and in the same direction) to the latent variable.Footnote 13 The α parameters were given N(0,4) priors (extremely diffuse for this model) subject to the ordering constraint that αj 1 > αj 2 for all j. Table 2 summarizes the parameterization of the DO-IRT and O-IRT models. As should be clear, the key difference between the two models is the prior distribution of the latent variable θit.
Summary of DO-IRT and O-IRT Model Paramaterization
Note that, as is generally true of item-response models, the likelihood function in Equation 1 is not identified. In particular, IRT models suffer from “invariance to reflection”, which means that (for instance) multiplying all of the parameters by −1 would have no effect on the likelihood function. Though lack of identification is problematic in maximum likelihood models, it is, in principle, not a problem for Bayesian approaches. The problem of invariance to rotation did, however, lead to some computational difficulties when estimating the model, which were eliminated by giving the β parameters strictly positive priors. For more information on identification problems in IRT models, see Jackman (Reference Jackman2009).
Each model is estimated using three MCMC chains. Each chain is run with 300,000 iterations. The first 50,000 iterations were thrown away as burn-in and the rest were used for inferences. The Gibbs sampler for the DO-IRT and O-IRT models was implemented in Martyn Plummer's JAGS software (Plummer Reference Plummer2010). The JAGS code used is displayed in the appendix. The conventional diagnostics all suggested convergence,Footnote 14 including those of Geweke (Reference Geweke1992), Heidelberger and Welch (Reference Heidelberger and Welch1981, Reference Heidelberger and Welch1983), Gelman and Rubin (Reference Gelman and Rubin1992) and standard graphical analysis.
Results
The model produces two sets of parameter estimates. The first set is item specific, and helps us make inferences about the relative informativeness of each indicator. The second set is the latent variable estimates for each observation, which are of primary interest. We review both sets of parameter estimates here. Though our DO-IRT and O-IRT models are estimated for both datasets, and item-specific parameters are displayed for both models, our discussion will focus on the better-fitting DO-IRT model; direct comparisons are saved for the following section of the article.
Results for Individual Indicators
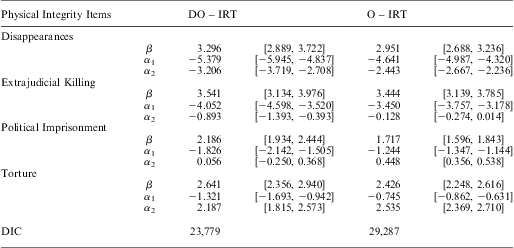
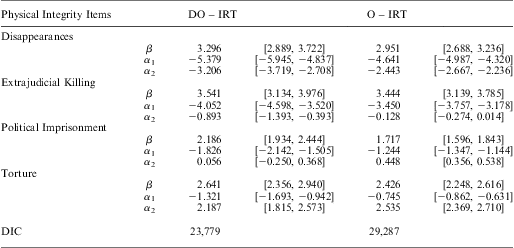
The item-discrimination parameters (β) for each model allow assessment of the information value of each indicator. Figure 1 displays the item-discrimination parameters from the DO-IRT model for both physical integrity rights and empowerment rights. As expected, all items discriminated well with respect to the latent variable. The most informative indicator among physical integrity rights is extrajudicial killing (posterior mean: 3.541, 95 percent credible interval [3.134, 3.976]), followed by disappearances (3.296: [2.889, 3.722]), torture (2.641: [2.356, 2.940]) and political imprisonment (2.186: [1.934, 2.444]).
Posterior densities for item-discrimination parameters for individual rights across models (30,000 draws) Note: All of the item-discrimination parameters are different from the prior mean of the parameter.
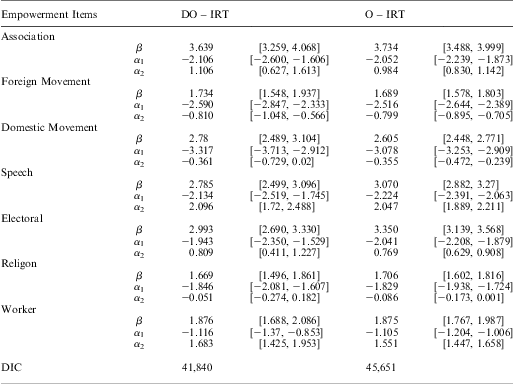
Among the empowerment indicators, freedom of association (posterior mean: 3.639, 95 percent credible interval [3.259, 4.068]), followed by electoral self-determination (2.993: [2.690, 3.330]), freedom of speech (2.785: [2.499, 3.096]), domestic movement (2.78: [2.489, 3.104]), workers’ rights (1.876: [1.688, 2.086]), foreign movement (1.734: [1.548, 1.937]) and freedom of religion (1.669: [1.496, 1.861]). The wide range of item-discrimination parameters for both models provides substantial evidence that our model improves on the additive scale used throughout most of the human rights literature. The item-discrimination parameters (β) and cut-points (α) for the ordinal indicators from the IRT models are displayed in Tables 3 and 4.
Point Estimates and 95 percent Posterior Intervals for Item Discrimination Parameters β and Ordinal Cut-points α for Physical Integrity Rights Indicators from the DO-IRT and O-IRT Models
Point Estimates and 95 percent Posterior Intervals for Item Discrimination Parameters β and Ordinal Cut-points α for Empowerment Rights Indicators from the DO-IRT and O-IRT Models
Finally, recall that we departed from previous dynamic models by estimating σ, the variance of the autoregressive prior, rather than specifying it a priori. The σ parameter gives a rough idea of the relative importance of within-country versus between-country influences variance. That is, since the overall variance is fixed at 1, a variance of 0 would indicate that respect for human rights does not change at all within countries, while a variance of 1 would suggest that respect for human rights within countries is just as variable as between countries. Recall that σ was restricted to be less than or equal to 1 based on prior knowledge. In the Physical Integrity model, the posterior mean for σ was 0.039 with a 95 percent credible interval from 0.031 to 0.049. In the Empowerment model, the posterior mean for σ was 0.034 with a credible interval from 0.026 to 0.043. These suggest that between-country variation is much larger than within-country variation, which helps to explain why the DO-IRT model performed better in posterior predictive checks. These statistics also suggest that the requirement that σ ≤ 1 was not very restrictive.
Estimates of Latent Human Rights Levels
The primary results from our statistical analysis are the estimates of latent respect for physical integrity and empowerment rights for each country-year. Since the 4,518 estimates provided at each draw in the model are difficult to display in their entirety, we present illustrative slices of the data and note that the entire set of estimates, with associated posterior standard deviations, is available online.
Figures A1 and A2 in the appendix display the latent variable estimates for physical integrity and empowerment rights, respectively, with 95 percent credible intervals, for all countries in the data in 2008. The range of parameter estimates for both models is around −3 to 3, and the credible intervals cover about one unit for most of the observations. As with confidence intervals, one should not judge the statistical significance of differences between countries by examining the overlap of credible intervals (Schenker and Gentleman Reference Schenker and Gentleman2001), but a more systematic assessment of differences between countries is given later.
Our model also enhances researchers’ ability to assess change in human rights levels over time. Figure 2 displays two columns of plots for three different countries (China, Guatemala and Namibia). The plots in the left column display the highest and lowest country-year posterior densities for each of these countries, and the right column displays the mean estimates and 95 percent confidence intervals for every year for these countries. The plots on the rights column provide a qualitative assessment of the human rights trends in each of the three countries. Visual examination of the plots reveals a slow decline in human rights levels in China, despite starting from a very low level. In contrast, the plots show radical improvement in human rights levels in Namibia and substantial improvement in Guatemala over the time period.
Posterior estimates from three country examples Note: DO-IRT highest and lowest posterior density for China, Guatemala and Namibia are displayed in the left column of plots. In the right column of plots, the dots are point estimates (posterior means) and the lines are 95 percent credible intervals from 1981-2009.
The plots on the left column of Figure 2 help us make more systematic comparisons between particular years within countries. We chose the highest and lowest years for analysis. In addition, a statistical comparison of the draws from the model allows us to give the equivalent of a p-value for the hypothesis of a difference between the highest and lowest years. The plot shows unambiguous differences between high and low years for Guatemala (p < 0.001) and Namibia (p < 0.001) and substantial differences between high and low years for China (p < 0.01).
Comparison with Traditional Measures
Since our model estimates produce latent variable estimates that researchers can use to replace traditional additive scales, we provide a few revealing comparisons between our model and the traditional measures. Though the two measures are highly correlated, as should be expected, our model-based estimates provide a more nuanced picture of global human rights practices in several ways.
We address the issue of discrimination between countries. An advantage of our latent variable estimates is that they allow the researcher to assess the level of error in the measure. This has been an issue of concern to quantitative human rights researchers. Wood and Gibney (Reference Wood and Gibney2010) argue that the method of aggregating multiple types of abuse into one scale implies a level of precision that is not supported by the data. Our method is a response to this objection. Furthermore, systematic comparison of our measure to the traditional measures confirms the validity of this objection to the current scales.
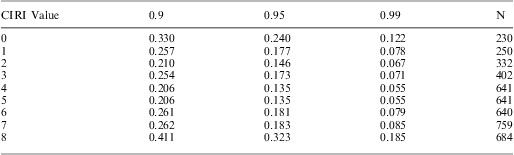
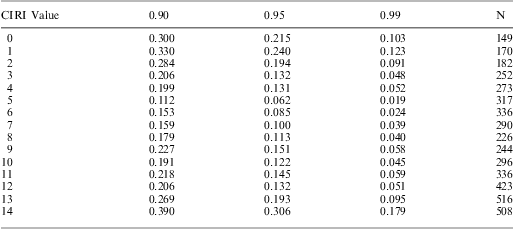
It is important to emphasize that there is no model-free way to estimate latent levels of respect for human rights. Thus the additive scale approach is a model that assumes equally weighted indicators and no error. If two country-years have the same value on the CIRI additive scale, the additive scale model states that those country-years are the same with a probability of 1. Our model finds substantial evidence of variation in latent respect for human rights within levels of the traditional additive scale. Table 5 displays, for each level of the physical integrity additive scale, the proportion of country-year pairs with that value, such that one country-year is greater than the other with high probability. Table 6 displays the same information for the Empowerment Index.
Precision from DO-IRT Model versus the CIRI Physical Integrity Index
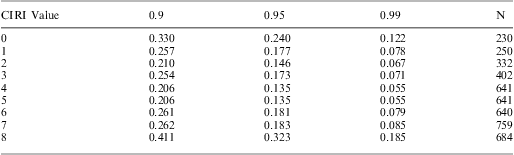
Note: The column values are the proportion of the country-year pairs for which both country-years in the dyad received the same score on the CIRI physical integrity index but for which one is greater than the other on the DO-IRT latent variable with 0.90, 0.95 and 0.99 probability, respectively.
Precision from DO-IRT Model Versus the CIRI Empowerment Index
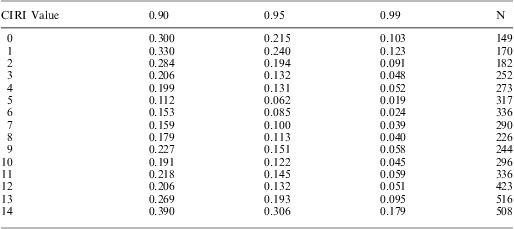
Note: The column values are the proportion of the country-year pairs for which both country-years in the dyad received the same score on the CIRI empowerment index but for which one is greater than the other on the DO-IRT latent variable with 0.90, 0.95 and 0.99 probability, respectively.
The DO-IRT model applied to the physical integrity variables produces significant variation within values of the CIRI additive scale. For every level of the additive scale, over 20 percent of the pairs were different with a probability greater than 0.9. The higher number of differences on the 0 and 8 ends of the scale reflect a conservativeness built into the dynamic model: a country that suddenly experiences more extreme values in a given year will have a higher variance and a more moderate posterior than one that had extreme values for the entire time period.
Similar patterns can be seen in the empowerment indicators. For all values of the Empowerment Index, over 11 percent of the country-year pairs are different with probability greater than 0.9, and the number is greater than 20 percent for the majority of index levels. As in the physical integrity data, larger differences are seen at extreme values of the scale.
Though the DO-IRT model reveals substantial variation between country-years that are considered the same under the additive scale model, it is more modest than the additive scale model in terms of its overall ability to discriminate between country-years. Figure 3 displays an overall picture of country-year comparisons for the physical integrity and empowerment data. Notice that the CIRI data assumes that approximately 90 percent of these country-year pairs are different with probability 1 and the remaining are different with probability 0. Our model suggests that this proportion of country-year pair differences is not very likely.
Summary of paired country-year comparisons for all such pairs in the DO-IRT physical integrity model and empowerment model Note: The Y-axis in each graph represents the proportion of country-year pairs that the DO-IRT model predicts are different from one another with level of confidence p on the x-axis.
These results suggest that in many cases, scholars will get a very different picture of comparisons of human rights behavior at the individual-case level from looking at our model. Each of the country-year comparisons represented in our tables represents different descriptive inferences that one might wish to draw. Is Uzbekistan more repressive today than when it first emerged as an internationally recognized state? In 2008, was Tajikistan more repressive than the Kyrgyz Republic? Did repression decrease in Guatemala immediately after the Cold War? We can now estimate that the probability of a “yes” answer to these questions is 0.586, 0.743 and 0.639, respectively.Footnote 15
Model Checks
The quality of the descriptive inferences we make about human rights levels in different countries depends critically on choosing the best model specification available. The DO-IRT model provides a better fit in a variety of ways, and provides a more realistic picture of changes in human rights practices. We compare the O-IRT and DO-IRT models in two ways. First, we use a formal decision-theoretic criterion called the Deviance Information Criterion to compare the models. Secondly, we provide a variety of posterior predictive checks, particularly related to dynamic aspects of human rights patterns.
Deviance Information Criterion
The O-IRT and DO-IRT models both fit the data reasonably well and are based on defensible assumptions about the data. To choose between models, more formal model comparisons are needed. Bayes Factors are often viewed as a good way to compare models in the Bayesian framework (Kass and Raftery Reference Kass and Raftery1995). Calculation of Bayes Factors, which requires marginalization over the parameter space of the models, remains difficult for very high dimensional models such as ours. A recent measure of model fit by Spiegelhalter et al. (Reference Spiegelhalter, Best, Carlin and Van Der Linde2002)—called the Deviance Information Criterion (DIC)—is appropriate for comparing IRT models, is much easier to compute and is designed explicitly for models estimated using MCMC.
The DIC is an estimate of expected deviance and has been proposed as a measure of model fit when the goal is to maximize out-of-sample predictive power (Gelman et al. Reference Gelman, Carlin, Stern and Rubin2003). For a given factor of parameters ψ, the deviance is given by  $$$D\left( {y,{\rm{\rpsi }}} \right)\, = \,{\rm{ - }}2\log \left( {{\cal L}\left( {y{\rm{|\rpsi }}} \right)} \right)$$$
, where
 $$${\cal L}\left( {y|{\rm{\rPsi }}} \right)$$$
is the likelihood function of the model. Other commonly used information criteria use the number of parameters as an argument, but in a hierarchical context (such as in our DO-IRT model) the number of parameters can be difficult to quantify. The DIC uses the effective number of parameters which is:
 $$pD\, = \,\overline{D}\left( y \right)\,{\rm{ - }}\,\hat{D}\left( {y,\,{\rm{\hat{\rPsi }}}} \right),$$
where  $$$\overline{D}\left( y \right)$$$
is the posterior mean of the deviance and
 $$$\hat{D}\left( {y,\,{\rm{\hat{\rPsi }}}} \right)$$$
is the deviance estimates using the posterior mean of the parameters,
 $$${\rm{\hat{\rPsi }}}$$$
. The DIC is:
 $$DIC\, = \,{\rm{2}}\overline{D}\left( y \right)\,{\rm{ - }}\,\hat{D}\left( {y,\,{\rm{\hat{\rPsi }}}} \right).$$
The model with the smallest DIC is expected to have the greatest out-of-sample predictive power. In addition to computational ease, the DIC carries some advantages over computing Bayes Factors. Bayes Factors may only be appropriate under the assumption that one and only one of the models is “true” and the goal is to choose the true model (Spiegelhalter et al. Reference Spiegelhalter, Best, Carlin and Van Der Linde2002). This assumption is especially unappealing for IRT models, since the latent variable is a figment of our imaginations, used for the specific purpose of reducing the data into a lower dimensional space. We believe that criteria based on short-term predictive power, such as the DIC, are therefore more appropriate for choosing between item-response models. A model that would best predict a new set of observations is likely to be most informative about the latent variable of interest. Like Bayes Factors and the other standard information criteria, the DIC penalizes more complex models, so parsimonious models are favored, all else equal.
The DIC for our models estimated on the human rights data suggests that DO-IRT performs better that O-IRT for both the physical integrity and empowerment data. The DIC for the DO-IRT model estimated usin the physical integrity data was 23,779 compared to 29,287 for O-IRT. Similarly, the DIC for the DO-IRT model applied to the empowerment data was 41,840 compared to 45,651 for O-IRT. There is no objective standard for what constitutes a substantial difference in the DIC, but suggested “rules of thumb” (Spiegelhalter et al. Reference Spiegelhalter, Best, Carlin and Van Der Linde2002) propose that differences of greater than five or ten provide substantial evidence in favor of the model with the lower DIC. Though these rules of thumb are arbitrary, we point out that in our model comparisons, with differences of a few thousand in both cases, the rules of thumb are far from binding. Thus the DIC provides good evidence in favor of the DO-IRT model. Along with the concerns about the local independence assumptions discussed in Section 3, this leads us to recommend the DO-IRT model for use by human rights researchers.
Posterior Predictive Checks
Posterior predictive checks provide an additional method of assessment of model quality (Gelman and Hill Reference Gelman and Hill2007) and provide more insight into the specific reasons for differences in fit. We test the ability of the DO-IRT and O-IRT models to predict the original CIRI response variables. For each draw from the posterior distribution, we predict each of the j items yitj for every country-year observation it. We then calculate the sum of squared differences of observed yitj and d posterior predicted values  $$${{\hat{y}}_{it\,jd}}$$$
using the following equation:
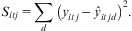 $${{S}_{itj}}\, = \,{{\mathop{\sum}\limits_d {\left( {{{y}_{it\,j}}\,{\rm{ - }}\,{{{\hat{y}}}_{it\,jd}}} \right)} }^{\rm{2}}} .$$
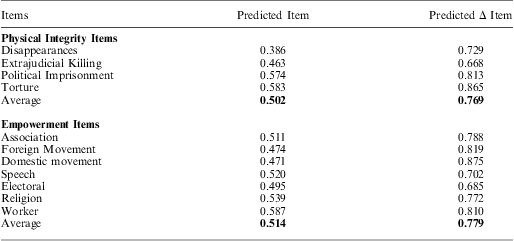
For presentation purposes, we aggregate the sum of squares difference for each observation. Figure 4 displays a proportion for each item in which the average sum of squares differences for each item is calculated from the DO-IRT and O-IRT models.Footnote 16 The proportions increase as the number of observations that have a smaller sum of squared deviation increases when comparing the DO-IRT model to the O-IRT model. On average, there is slightly less deviation from the “true” CIRI item and the predicted item generated by the DO-IRT model compared to the predictions generated by the O-IRT model. The proportion columns in Table 7 measure the proportion of country-year observations that have a smaller deviation generated by the DO-IRT model compared to the O-IRT model. In sum, the DO-IRT model does a slightly better job of predicting the original CIRI data compared to the O-IRT model. However, we demonstrate next that the dynamic model (DO-IRT) does substantially better at predicting temporal changes compared to the static version (O-IRT).
Summary of Posterior Predictive Checks
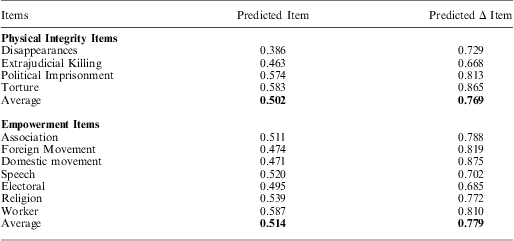
Note: The first column of proportions measures the proportion of country-year observations that have a smaller sum of squared deviation generated by comparing the observed item and predicted item for the DO-IRT model compared to the O-IRT model. The second proportion measures changes from year t−1 to year t for country-year observations that have a smaller sum of squared deviation generated by the DO-IRT model compared to the O-IRT model. In sum, the DO-IRT model does a slightly better job of predicting the item and a substantially better job of predicting temporal change from year t−1 to year t compared to predictions generated from the O-IRT model.
We also assess the ability of the DO-IRT and O-IRT models to predict the temporal dynamics of the CIRI data. To accomplish this task, we repeated the procedure outlined above, using the first differences of the observed data and the first differences of the predicted data taken from the posterior draws. For each draw from the posterior distribution, we predict the change in each of the j items yitj for every country-year observation it. We then calculate the sum of squared differences of observed Δyitj and d posterior predicted values  $$$\rDelta {{\hat{y}}_{it\,jd}}$$$
using
 $$\rDelta {{S}_{it\,j}}\, = \,\mathop{\sum}\limits_d {{{{\left( {\rDelta {{y}_{it\,j}}\,{\rm{ - }}\,\rDelta {{{\hat{y}}}_{it\,jd}}} \right)}}^{\rm{2}}} } .$$
Overall, the results displayed in both Table 7 and Figure 4 demonstrate the improvement in predictive power of the DO-IRT model when compared to the O-IRT model. The DO-IRT model outpredicts the O-IRT model for both sets of predictions. However, it substantially outperforms the predictive power of the O-IRT model when considering changes in time.
Though the dynamic model is clearly superior at predicting temporal changes in the original data, this result should not be surprising, since the model explicitly includes temporal information in the prior of each estimate of the latent variable. We explore additional temporal predictions next, and discuss the predictive validity of the dynamic and static measures.
Predictive Validity
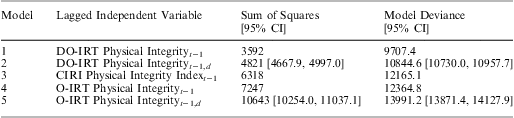
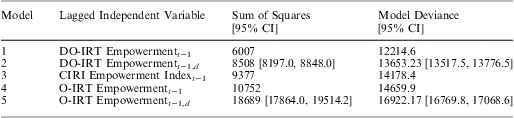
A measure of the construct validity of our measure is the performance of the human rights variable at predicting future human rights levels. The difficulty in assessing the relative predictive abilities of the variables is in selecting the outcome to predict. Since most measures should perform better at predicting future values of themselves than of another measure of the same concept, the choice of outcome variable may bias the comparison in favor of one measure or another. To make the comparison as difficult as possible for the DO-IRT model, we compared the ability of each variable to predict future values of the traditional CIRI additive index. To do this, we regressed the CIRI Physical Integrity Scale on lagged values of each variable and compared the model deviance and sum of squared deviations resulting from each model. Specifically, we regress these scales on (1) the lagged version of the scales, (2) the lagged version of the static latent variable and (3) the lagged version of the dynamic latent variable. We also repeat Models 2 and 3 in order to incorporate the uncertainty captured by the latent variables in the predictions generated by these models. We describe these procedures at the end of this section. The results of this comparison are presented in Table 8.
Ordered Logistic Regressions: CIRI Physical Integrity Additive Index Dependent Variable
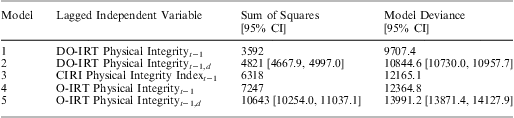
Note: summary statistics are derived from five bivariate ordered logistic regressions in which the CIRI Physical Additive Integrity Index is regressed on one of several lagged physical integrity variables. The models are listed in ascending order of predictive fit. The mean estimate of the dynamic latent variable (Model 1) outperforms the alternative lagged constructs even when uncertainty is incorporated into the model (Model 2). Note that the lagged version of the original CIRI Physical Integrity Index (Model 3) outperforms the models with a static latent variable (Models 4 and 5).
For each of the models using the latent variable estimates, we ran one regression using the posterior mean as a point estimate of the human rights index in each country-year and another taking 1,000 draws from the posterior to account for the uncertainty in the estimates. To incorporate the uncertainty from the measurement models, we estimate the same statistical model for each of the m datasets and then make inferences from the distribution of parameter estimates.
Table 8 displays the model deviance and sum of square deviations calculated for five ordered logistic regression models with a single covariate. Though the deviance is the more accepted method for assessing fit in generalized linear models, we will refer to the sum of squared deviations in the discussion for ease of interpretation, since both numbers give the same impression. The sum of squared deviation statistics is generated from ordered logistic regressions; the CIRI Physical Integrity Index is regressed on the lagged version of itself and several other lagged measures of physical integrity abuse. The lagged version of the CIRI Index does better than the mean estimate of the lagged static variable, but not the mean estimate of the lagged dynamic variable. As an alternative, we also ran the ordered logistic regressions 1,000 times, taking draws from the lagged mean and standard deviation of the dynamic and static estimates. Again the dynamic estimate 4,821 [95 percent CI: 4667.93,4997.00], even when incorporating uncertainty about the estimate from the previous year, outperforms both the models with the lagged CIRI value 6,318 and a model that also incorporates uncertainty from the static model 10,643 [95 percent CI: 10253.98, 11037.10]. We generated the same statics using the empowerment variables, which are displayed in Table 9. Again the dynamic latent variable outperforms both the lagged CIRI empowerment variable and the static estimate. Overall, the evidence provided in this section demonstrates that the dynamic latent variable model produces much more precise and informative estimates, which are useful in statistical analyses of human rights practices.
Ordered Logistic Regressions: CIRI Empowerment Additive Index Dependent Variable
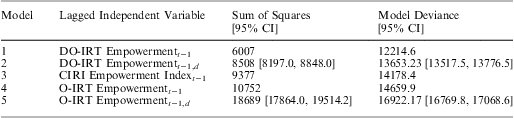
Note: summary statistics are derived from five bivariate ordered logistic regressions in which the CIRI Empowerment Additive Index is regressed on one of several lagged empowerment variables. The models are listed in ascending order of predictive fit. The mean estimate of the dynamic latent variable (Model 1) outperforms the alternative lagged constructs even when uncertainty is incorporated into the model (Model 2). Note that the lagged version of the original CIRI Physical Integrity Index (Model 3) outperforms the models with a static latent variable (Models 4 and 5).
Illustration: Human Rights and Terrorism
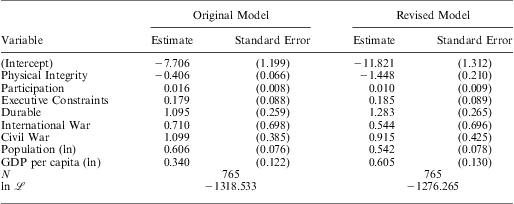
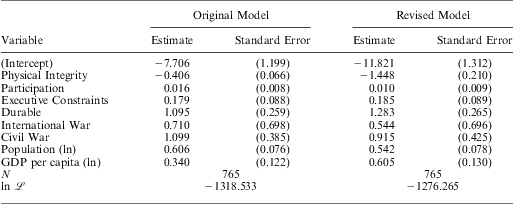
We now illustrate how to use our measure for applied data problems by repeating an analysis by Piazza and Walsh (Reference Piazza and Walsh2009), which shows that countries with better human rights practices experience fewer terrorist attacks. Piazza and Walsh use negative binomial models on counts of the number of domestic terrorist attacks, transnational terrorist attacks and total terrorist attacks that occurred in each country-year. The main independent variable of interest was the CIRI Physical Integrity Rights Index. As controls, the model also includes three measures of democracy: (1) constraints on the executive, participation and the durability of the regime; three measures of state capacity (government involvement in an international war, government involvement in a civil war and the natural logarithm of the state's population) and (3) the natural logarithm of gross domestic product (GDP) per capita. We replicated their analysis of domestic terrorist events and then repeated the analysis using our latent variable estimates in place of the additive scales.Footnote 17Table 10 compares the original and revised models.
Negative Binomial Regression of the Number of Domestic Terrorist Events
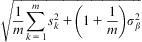
In the model using the latent variable estimates, we incorporated the uncertainty associated with the measure using the same Monte Carlo procedure that is used for multiply imputed missing data.Footnote 18 First, we take m = 10 draws from the posterior distribution of the DO-IRT model and use them to create 10 datasets. Next, estimates were combined in the same way they are combined in multiple imputation problems. Estimates were combined using the Rubin (Reference Rubin1987) formulas, in which the point estimate for each parameter is the mean from the m estimates, and the standard error is:
 $$\sqrt {\frac{{\rm{1}}}{m}\mathop{\sum}\limits_{k\, = \,{\rm{1}}}^m {s_{k}^{{\rm{2}}} } \,+\left( {{\rm{1}}\, + \,\frac{{\rm{1}}}{m}} \right)\sigma _{\beta }^{{\rm{2}}} }$$
where  $$$s_{k}^{{\rm{2}}} $$$
is the standard error from dataset k, and
 $$$\sigma _{\beta }^{{\rm{2}}} $$$
is the variance in the regression coefficients between datasets. In other words, the standard error is the average standard error from each model, plus the variance in the regression coefficients times a correction factor for finite m. This procedure can be implemented in any program designed for multiply imputed data.
Though the coefficients for the human rights variable in the original and revised models are different, these differences correspond primarily to the different scales for the variables. The substantive effects, and therefore the conclusions of Piazza and Walsh (Reference Piazza and Walsh2009), are very similar across the two models.Footnote 19 To compare substantive effects across the models, we simulated the expected number of attacks under both models. The change in the expected number of attacks when changing physical integrity from the 25th percentile to the 75th percentile was about −3.22 (95 percent CI: −4.71, −2.06) in the original model and −3.32 (95 percent CI: −4.60, −2.32) when including the latent variable. The main difference between these two effects is the size of the confidence interval of the estimated difference. A Kolmogorov-Smirnov test confirms that the two distributions of simulated estimates are statistically different (p < 1e −6). Thus the increased precision of the DO-IRT estimates relative to the additive index allows us to estimate effects more precisely even after we incorporate the uncertainty associated with measurement error. The substantive impact of this observation is that researchers may be able to detect effects that would have been missed using additive scales.
The superior performance of the DO-IRT model can also be verified by comparing the fit of the models.Footnote 20 The log-likelihood in the original model is −1318.533. The average log-likelihood from the 10 replications is −1276.265. Note also that each of the individual log-likelihoods from the 10 replications are larger than the log-likelihood from the original model, which suggests that the model with the latent human rights variable better fits the data in each individual m model.
Conclusions
In this article, we introduced the Bayesian ordinal IRT model and provided a theoretical motivation for developing the dynamic version of this model when applied to human rights data. Overall, the Bayesian approach provides the researcher with a high degree of flexibility in modeling latent characteristics of states or any other political actor. Further, the approach utilized in this article has the potential to occupy an important middle ground in the current debate over measurement of respect for physical integrity rights.Footnote 21 Critics of the CIRI Physical Integrity Index are uncomfortable with several aspects of the measure. First, they are skeptical of the assumption that each practice represents the latent trait equally. Secondly, scholars are concerned that the level of precision implied by the estimates is not supported by the available data. Our approach addresses these concerns by empirically estimating both the item weights and the uncertainty of the estimates. At the same time, our approach provides the advantage of utilizing a disaggregated data source that allows empirical assessment of unidimensionality and places the aggregation of indicators under the control of the researcher, thus allowing for greater transparency in both measurement and testing. Further, the point estimates and credible intervals estimated in this analysis are available for researchers to use as both a dependent variable or independent variable in applied work. These continuous latent human rights variables allow the researcher to use the widely available tools for assessing such a dependent variable in a panel data setting. We have also discussed two simple techniques for including the uncertainty inherent in measuring human rights in statistical analyses that include the latent human rights variables as an independent variable.
Reference Clark and SikkinkClark and Sikkink (forthcoming) are critical of both the CIRI physical integrity data and the Political Terror Scale. These authors suggest that “systematic ‘information effects’ in these data sets may contribute to the pessimistic findings of the quantitative literature” (forthcoming). By pessimistic findings, these authors mean the stagnant pattern of human rights abuse over time and the negative correlation between these human rights scales and the implementation of UN human rights treaties. Our model does not allow us to assess information effects directly. However, the DO-IRT model is extendable and, as we have demonstrated in this article, capable of (1) bringing together diverse sources of information, (2) assessing the relative quality of the information included and (3) quantifying the certainty of estimates of repression that are generated from the models. Future measurement projects can use our DO-IRT model to parameterize new theoretical insights. Additional data collection efforts are necessary to address the challenge posed by Reference Clark and SikkinkClark and Sikkink (forthcoming), which is similar to one made by Stohl et al. (Reference Stohl, Carleton, Lopez and Samuels1986) three decades ago. Another issue that our model might address in future research is the comparability of event data that counts the number of repressive events in country-year observations.Footnote 22 We leave these extensions to future research projects.
Overall, the DO-IRT model provides a starting point for new theorizing and model development by generating new information about quantifiable country-year comparisons that was not previously available to researchers. The dynamic latent variable estimates generated by the DO-IRT model allow for the direct, probabilistic comparison of the level of human rights abuse between country-year cases. Until now, analysts who wished to compare two cases had to rely on case-specific evidence or ordinal human rights variables. Case-specific evidence limits the number of comparisons that can be made and does not provide an estimate that can be compared alongside other pairwise comparisons. The ordinal data that predominates the quantitative human rights literature can provide yes/no answers but is unable to quantify the certainty of a given answer. The evidence provided in Figures 4 and 5 and Tables 7, 8 and 9 all suggest that the dynamic latent physical integrity and empowerment variables provide the most informative and precise estimates of their corresponding theoretical constructs to date. This evidence, coupled with the ability to make probabilistic comparisons between country-year cases (which we demonstrated in Figure 3 and Tables 5 and 6) means that the estimates generated from this project can provide transparent and realistic answers to the descriptive questions we posed at the outset of this article. The estimates should be of use in both large-N and case-study research. However, we hope that it also proves useful to policy makers and NGOs. The ability to make probabilistic statements and accurate predictions about future levels of abuse is essential for scientific progress and targeted action by human rights NGOs.
Proportion of observations for which the Physical Integrity (left)/Empowerment (right) DO-IRT is more precise than the O-IRT estimate Note: proportions closer to 1 indicate that the dynamic version of the model is outperforming the static version at predicting the original CIRI items and changes in those items from year t−1 to year t. Proportions closer to 0 indicate that the static version of the model is outperforming the dynamic version. Proportions at 0.50 indicate that both models are predicting the items with about the same amount of error. Notice that while a few of the proportions in the first figure are below the 0.50 mark, only in the case of predicting disappearances does the static model (O-IRT) substantially outperform the dynamic model. The dynamic model is clearly superior at predicting temporal changes in the original data.
Comparison of deviations from bivariate model predictions of CIRI Physical Integrity (left)/Empowerment (right) additive index Note: The sum of squared deviations is derived from each of five bivariate ordered logistic regressions in which the CIRI Physical Integrity Additive Index (left panel) and the CIRI Empowerment Additive Index (right panel) are regressed on one of five different lagged variables. Lower values represent a better-fitting model. The dynamic latent variable in period t−1 predicts values of the indices in period t with greater accuracy than the static variables or the additive indices themselves.
APPENDIX
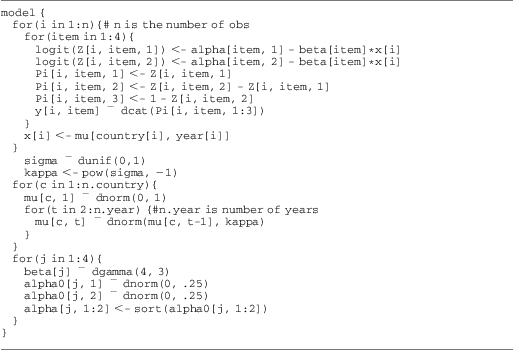
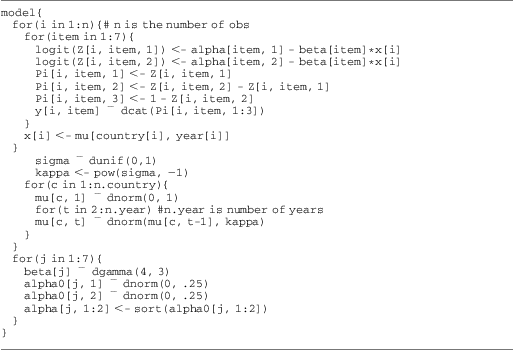
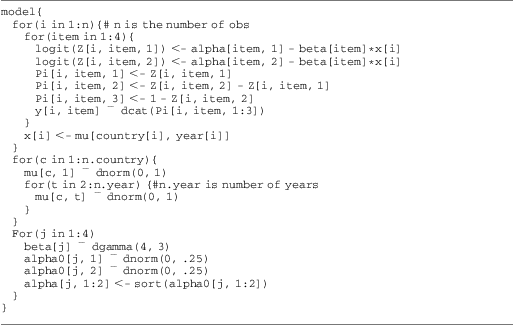
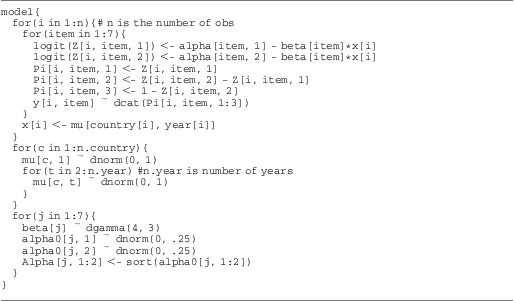
The JAGS code that estimates the latent variables, displayed below, was run using Martyn Plummer's JAGS software (Plummer Reference Plummer2010). All other estimations were run in R (R Development Core Team 2011) using the statistical packages coda, Rjags and R2jags. All data and code used in this analysis are publicly available at a Dataverse repository maintained by the authors.
DO-IRT JAGS Code for Physical Integrity
DO-IRT JAGS Code for Empowerment
O-IRT JAGS Code for Physical Integrity
O-IRT JAGS Code for Empowerment
Additional Figures
Here we present cross-sectional comparisons of estimates from the DO-IRT physical integrity model and the DO-IRT empowerment model.
DO-IRT physical integrity latent variable estimates for 192 states in 2008 Note: Dots are point estimates (posterior means) and lines are 95 percent credible intervals.
DO-IRT empowerment latent variables estimates for 192 states in 2008 Note: Dots are point estimates (posterior means) and lines are 95 percent credible intervals.