Introduction
In Algeria, there are approximately 3 million goats that are a source of income for about 800 000 small farmers. Goats constitute a tradition in Algeria. They are found in small numbers (4 or 5) or with sheep in the same flock. In Algeria, there are no defined breeds as such, but they are considered as populations according to the area. They present many advantages to farmers which are: ability to tolerate harsh climates, good recovery capacity from drought, suitability to poor systems because of small size and ability to thrive on poor quality diets, low milk production and animals for sale. The mating system is based on exchange of males from one farmer to another. No breeding programmes have been implemented to improve productivity of small ruminants. Small ruminants are bred extensively (Dekhili and Aggoun, Reference Dekhili and Aggoun2007). In Algeria, information on goat resources is scarce, which does not contribute to the characterization of different local genetic types. To improve animal productivity or to maintain genetic diversity which allows farmers to select or to sell more animals or to create new breeds, a solid strategy is needed to identify and understand the productivity of these populations in their regions. However, before that, an adequate phenotypic and genetic characterization is needed. The first step of the characterization of Algerian local genetic resources is to assess variation in morphological traits (Delgado et al., Reference Delgado, Barba, Camacho, Sereno, Martinez and Vegapla2001). Many authors have suggested use of multifactorial analysis for morphological traits in order to assess phenotypic variation within and between goat populations (Traoré et al., Reference Traoré, Tamboura, Kabore, Royo, Fernandez, Alvarez, Sangare, Bouchel, Poivey, Francois, Oguyeni, Sawadogo and Goyache2008a, b; Yakubu et al., Reference Yakubu, Salako, Imumorin, Ige and Akinyemi2010; Legaz et al., Reference Legaz, Cervantes, Perez-Cabal, De la Fuente, Martinez, Goyache and Gutiérrez2011; Yakubu, Reference Yakubu2011). The main objectives of this study are to identify any distinct goat populations and to describe their external characteristics (qualitative and quantitative) within the Algerian production environment (Sétif).
Materials and methods
Environmental areas and goat populations
The high plateaux of Sétif are divided naturally into three environmental areas according to climate conditions, altitude, type of soil and vegetation:
-
Northern area: is located between 1 500 to 2 000 m of altitude, with an annual rainfall of ≤700 mm, with low temperatures varying from −5 to 20 °C and grassy, bushy and shrubby vegetation, usually quite sparse, with ligneous species. Soils are black, hygroscopic and mainly of clay;
-
Central area: is located between 900 to 1 200 m of altitude, with annual rainfall of ≤400 mm. Temperatures are varying from −1 to 25 °C. Vegetation is mainly based on fallow ground or stubble of cereals. Soils are more silty with brown colour;
-
Southern area: is at 800 m of altitude with annual rainfall of ≤250 mm. Vegetation steppe is quite sparse, with ligneous species: Stippa tenacissima and Artemesia herba-alba. Soils are more of limestone, with white colour and salty. Temperatures are varying from −1 to 27 °C (ONM, 2010).
The three environmental areas described above are habitats of the goat populations concerned with this investigation, which is the first in both Sétif region and in Algeria. Each area is divided into districts: four districts for Northern area, three districts for Southern area and five for Central area.
Data collection
During the summer of 2010, sampling was carried out on a total of 14 flocks, selected at random, located in three different areas in eastern Algeria. A total of 660 non-pregnant adult female goats from 3- to 4-years old, were included in this investigation and were distributed as follows: 101 for North, 405 for Centre and 154 individuals for South. All goats were scored for 17 body measurements (quantitative) concerning width size and dimensions of animals. These are influences and may depend on numerous genes and are economically important. The second type of data are nine coded qualitative discrete traits, such as colour or categorical (presence or absence). Body measurements or quantitative traits were carried out by three technicians using Lydthin stick, tape measure and Vernier calipers. Animals were put on a flat floor and held by the farmers. The 17 body measurements obtained were: head length (hl), ear length (el), neck length (nl), body length (bl), trunk length (trl), pelvis length (pl), hip width (hw), ischion width (iw), chest size (cs), chest depth (cd), chest width (cw), height at withers (htw), height at back (hb), height at sacrum (hs), side depth (sd), hair length (hrl) and tail length (tl). The eight qualitative traits scored are as follows: head colour (hc), ear position (ep), profile position (pp), coat colour (cc), presence of goatee (gp), presence of pendants (pdp), colour of legs (lc) and udder development (ud).
The data collection was done as follows: qualitative and quantitative traits were collected simultaneously in the field and were reported on files or cards. Individual files were prepared before starting characterization. Hence, the data were collected on the conditions in which animals are bred. Once the data were collected, they were reported on Excel file to be analysed later. Questionnaires were elaborated as well, to collect information about production environment, mating, feeding, selection and other activities.
Statistical analyses
Statistical analyses were carried out using the SAS/STAT package (1999). Basic statistics for body measurements and qualitative traits were obtained using PROC UNIVARIATE and PROC FREQUENCY, respectively. The influence of the environmental area on the 17 body traits measured was assessed using the PROC MIXED, fitting a model including as effects the area (with three levels: North, Centre and South) and districts as a random effect nested within the area to account for non-independency of sampling in each district. Least square means and their standard errors were obtained for each body trait by area level. Duncan's multiple-range test was performed on all area means of body measurement traits using PROC GLM. Stepwise discriminant procedure was applied using PROC STEPDISC to determine which morphological traits have more discriminant power than others. The CANDISC procedure was used to perform canonical analysis to derive canonical functions, linear combinations of the quantitative variables that summarize variation between areas and compute between areas Mahalanobis distance matrix. The ability of the computed canonical function to assign each individual goat to its sampling area was calculated as the percent of correct assignment using DISCRIM procedure. The association between the qualitative traits was assessed via correspondence analysis using the PROC CORRESP of SAS. When necessary for descriptive purposes, canonical variables and correspondence analysis dimensions were plotted using Microsoft Excel.
Results and discussion
Continuous traits
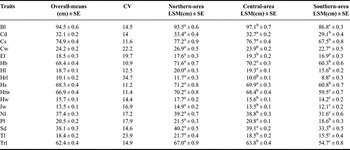
Least square means for the body measures analysed by environmental area are given in Table 1. Overall, the Northern area had the highest values (P < 0.05) for 15 traits or 88 percent. These traits were mainly related to length (6), width (3), height (3), depth (2) and size (1). The Central area had the highest values for all traits compared with the South goats. This indicates that the North goats are different than the two other types of goats located in the Centre and in the South; as, the Centre ones are different from the South ones, as well. Goat populations are exhibiting different phenotypes according to the area. These morphological differences shown by univariate analysis constitute an indication of the inherent genetic constitution of each goat population. The presented coefficient of variation (Table 1) varied from 10.94 percent to 34.67 percent. Therefore, a large variation is shown in the body measures.
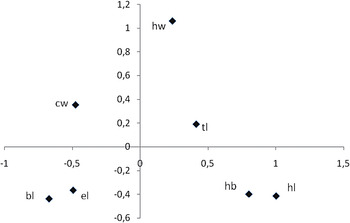
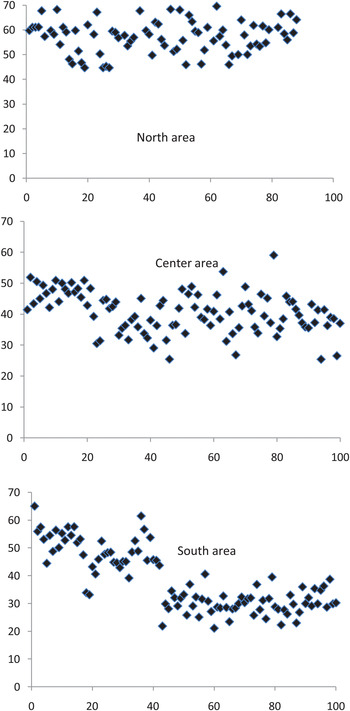
Bi-dimensional plot illustrating the association between body measures in Sétif goat assessed via canonical analysis. Traits: HW, hip width; CW, chest width; TL, tail length; BL, body length; EL, ear length; HB, height at back; HL, head length.

Overall arithmetic mean (cm) with their standard error (SE), coefficient of variation (CV), least square means (cm) and their standard error (SE) for each area analysed for each of the seven body measurements.

Traits: Bl, body length; Cd, chest depth; Cs, chest size; Cw, chest width; El, ear length; Hb, height at back; Hl, head length; Hrl, hair length; Hs, height at sacrum; Htw, height at withers; Hw, hip width; Lw, ischion width; Nl, neck length; Pl, pelvis length; Sd, side depth; Tl, tail length; Trl, trunk length.
a–cDifferent superscript indicate significant difference (P < 0.05).
Qualitative traits
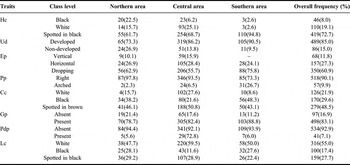
Incidence in percentage of each level of the eight qualitative traits recorded for all individuals and for each environmental area (Table 2), suggests that goats are mainly spotted black in head (72.7 percent), with drooping ears (60.9 percent), right pp (90.1 percent), gp (83.1 percent), absence of pendants (92.9 percent), with white legs colour (58.0 percent) and developed udder (85.0 percent). cc varied from one area to another. Black and spotted in brown (38.2 percent, 46.1 percent) in North and 48.28 and 43.1 percent in South; Spotted in brown, white and black (50.8 percent −27.6 percent −21.6 percent) for the Central area.
Frequency of each class level of qualitative traits scored in Sétif area goats (and percentage for each qualitative trait in brackets).

X 2 test showed that incidence of all analysed traits varied significantly among environmental areas (P < 0.05).
1Traits: c, coat colour; Ep, ear position; Hc, head colour; Gp, presence of goatee; Lc, legs colour; Pdp, presence of pendant; Pp, profile position; Ud, udder development.
Multivariate analyses
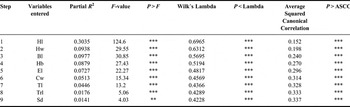
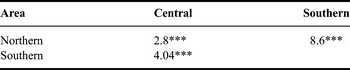
Results of the stepwise discriminant analysis are presented in Table 3. Nine of the seventeen measured variables were found to be significant (P < 0.01–0.005). However, hl followed by hw, bl, hb, el, cw and tl had more discriminant power than the others as shown by their higher R 2 and F-values. Then, the other traits (trl-sd) were removed from the final model. This suggests that taking these seven traits (hl, hw, bl, hb, el, cw and tl) would be more important in differentiating goats between areas. The canonical analysis identified two statistically significant (P < 0.005) canonical variables (CAN1 and CAN2). CAN1 and CAN2 accounted for 76 and 24 percent of the total variation, respectively. Figure 1 shows a bi-dimensional plot illustrating the relationship between body measurement on the x-axis, hl, hb and tl are well separated from the other linear traits. Although on the y-axis, hw is well separated from the other traits. The between environmental areas Mahalanobis distance matrix is given in Table 4. All pairwise distances were highly significant (P < 0.005). Therefore, a large variation is shown in the body measures. The largest distance was found between the Northern and the Southern areas (8.6), and 4.0 between the Centre and the South, while between the North and the Centre it was 2.8. The hypotheses that area's means are equal in the populations analysed were tested using Wilk's Lambda. This had a significant value (P < 0.005) of 0.43656191 (F = 41.52: degree of freedom = 14) showing clearly, that differences found between areas were statistically different from zero. Phenotypic differences are present among populations, which are separated by geographical locations.
Summary of stepwise selection of traits.

***P < 0.005; **P < 0.01.
Traits: Bl, body length; Cw, chest width; El, ear length; Hb, height at back; Hl, head length; Hw, hip width; Tl, tail length; Trl, trunk length; Sd, side depth.
Mahalanobis distance between goat populations sampled in each environmental area identified in Sétif.

***P < 0.005.
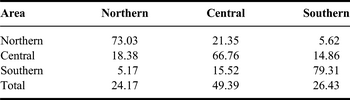
Adaptive divergence in morphological traits was higher between North goat-populations and South ones, and lower between North and Centre goat-populations. This indicates that the genetic exchange, through males, that has been used over time might have lowered the genetic distance between North and Centre and between Centre and South, which has been facilitated by geographic proximity. The values computed for CAN1 and CAN2 for each individual were plotted by environmental areas (Figure 2). All individuals, within the area, are spread and more or less clustered on the right of the X-axis. In this respect, the discriminant analysis carried out gave more information (Table 5). Most of the individuals within the area were classified into their source population (North: 73.0 percent; Centre: 66.8 percent; South: 79.3 percent).
Bi-dimensional representation of the canonical traits associated with individuals sampled in each of the environmental areas of Sétif. Traits: HW, hip width; CW, chest width; TL, tail length; BL, body length; EL, ear length; HB, height at back; HL, head length.

Percentage of classification into environmental area for Setif goat individual sampled, according to the environmental area of sampling, using morphological structural traits and discriminant analysis.

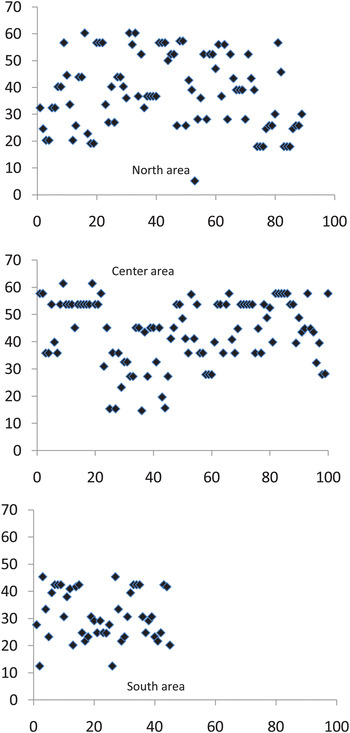
A small part of the individuals was “erroneously” cross classified. This indicates that each area-goat population has its own genetic constitution, which might be because of the lack of correction for age within population. Correspondence analysis carried out on the eight qualitative traits recorded showed that four of them (hc, ep, cc and lc) explained 75.0 percent of the inertia. Therefore, the analysis was re-run using only these four traits where Figure 3 shows the values computed for the two identified dimensions for each environmental area. The first and second dimensions identified explained, respectively, 56.5 and 43.5 percent of the total variation. The scenario identified for each environmental area was almost similar to that previously reported for the body measures, except for the South where the individuals were more clustered in the left. Although, North and Centre individuals are more spread in the X-axis rather than those of the South where they are more clustered to the left of the X-axis. As was declared earlier, there are no real differences between individuals within area in the qualitative traits (Table 2). Animal genetic resources are a part of biological diversity and are important in any development programme. Between breed diversity is considered as an important criterion to be considered when ordering priorities for conservation of breeds. As we know, phenotypes are an expression of genetic characteristics under environmental conditions; therefore, phenotypic variance is influenced by genetic variance and environmental one. To understand the phenotypic description under Algerian conditions would help, indeed, for an accurate comparison with other goat populations from the North to the South of the country. Further characterization using genetic analyses is helpful and necessary. The presented results showed significant morphological variation among all three goat populations in the three areas. This intra-area homogeneity found could be because of the environmental conditions in which goat populations are bred. This might indicate a certain relationship between phenotypic constitution intra area, adding to this the combination of the same set of genes and geographical differences.
Bi-dimensional representation of the individuals sampled in each of the environmental areas of Sétif via correspondence analysis for 8 qualitative traits.

Conclusion
A significant morphological variation was found among the three goat populations of Sétif, mainly because of geographical differences and mating procedure. It can be considered that there are three geographical goat populations, where each type has its own particularities. They exhibit large phenotypic diversity. They are bred at low selection intensity, and might be subject to high natural selection pressure; pedigrees are not known and genetic structure is mainly influenced by migrations drift and natural selection. This investigation showed that hl, hw, body length, hb, el, cw, tl and sd were the most discriminating variables to separate the three goat populations between areas. These results would aid further characterization, management and improvement of the Algerian small ruminant. However, more solid characterizations using protein and microsatellite markers are needed as complements.
Acknowledgements
The authors thank the management and the technicians of the state farm “Ben Aichouche” for carrying out this work.