Introduction
The protein composition of the maternal diet during lactation serves as a fundamental determinant of offspring feeding behavior and BM trajectory. Reference Martins, de Oliveira and Pavanello1,Reference Lisboa, Miranda, Souza and Moura2,Reference Cambraia, Vannucchi, Almeida and De-Oliveira3 While moderate variations in maternal protein intake (12–16%) appear not to overtly compromise offspring growth or BM gain, more pronounced restriction significantly alters appetite regulation and restricts somatic development. Reference Barbosa, Medina, Balbo and de Freitas Mathias4 These observations remain critically relevant, as maternal and infant undernutrition persists as a formidable global health challenge. Despite progress driven by international initiatives and globalization, socioeconomic disparities, Reference Black, Victora and Walker5 social instability, Reference Workie, Mackolil, Nyika and Ramadas6 conflict, Reference Osendarp, Verburg and Bhutta7 environmental seasonality, Reference Marshak, Venkat, Young and Naumova8 and infectious disease burdens Reference Narayan, John and Ramadas9 continue to exacerbate nutritional vulnerabilities. This persistent undernutrition contributes to a heightened risk of chronic disease in adulthood, a phenomenon central to the Developmental Origins of Health and Disease (DOHaD) framework. DOHaD posits that environmental insults during vulnerable developmental windows, specifically the first 1.000 days, including the critical perinatal period, can program persistent changes in metabolic regulation, thereby modifying susceptibility to cardiometabolic disorders in adulthood. Reference Mayneris-Perxachs and Swann10 Within this landscape, BAT has emerged as an important metabolic regulator. In humans, higher BAT activity has been associated with lower visceral adiposity and a more favorable cardiometabolic profile. Reference Becher, Palanisamy and Kramer11
Maternal protein restriction during lactation fundamentally alters the nutritional quality of breast milk, persistently reducing both protein and total energy content. Reference Passos, Ramos and Moura12 This nutritional deficit is a primary driver of the morphological, metabolic, and endocrine disturbances that impair offspring development. Reference Passos, Ramos and Moura12,Reference Martins, Vargas and Saavedra13 At the endocrine level, such malnutrition suppresses GH mRNA expression and anterior pituitary GH receptor mRNA, changes associated with reduced BM and linear growth until young adulthood. Reference de Moura, Lisboa, Custódio, Nunes, de Picoli Souza and Passos14 Furthermore, maternal protein restriction during lactation has been associated with reduced offspring WAT mass, Reference Martins, Vargas and Saavedra13 whereas generalized food restriction decreases lean mass. Reference Desai, Babu, Gayle, Day, Beall and Ross15 Collectively, these findings suggest that maternal deprivation does not merely attenuate growth but reshapes body composition and endocrine signalling during early postnatal development. These persistent changes in growth and body composition further suggest that lactational protein restriction may program long-term energy partitioning. Thus, altered nutrient delivery via milk represents an important mechanism through which maternal undernutrition programmed the metabolic trajectory of offspring and increased vulnerability to endocrine and metabolic alterations. Reference Martins, Vargas and Saavedra13,Reference Bautista, Bautista and Montaño16 Although maternal protein undernutrition delays offspring body growth, animals exposed to this nutritional insult exhibit improved glucose tolerance at the onset of the peripubertal period, reflecting greater efficiency in glucose clearance from the circulation. Reference do N de Rodrigues, Romano and Grassiolli17 Evidence from lactational protein-restriction models further indicates that these long-term effects extend beyond somatic growth to glucose homeostasis, insulin responsiveness, and liver lipid metabolism. Reference Fagundes, Moura and Passos18,Reference Bertasso, de Moura and Pietrobon19
iBAT participates in systemic energy homeostasis and interacts metabolically with the liver and WAT. In rodents, iBAT is a major thermoregulatory organ. Reference Enerbäck20 Its activation is initiated by the binding of sympathetic norepinephrine to β3-AR, which promotes mitochondrial uncoupling through UCP1 to generate heat. Reference Cero, Lea, Zhu, Shamsi, Tseng and Cypess21,Reference Natarajan, Plakkot and Tiwari22 As thermogenic capacity is age-dependent, Reference Cero, Lea, Zhu, Shamsi, Tseng and Cypess21,Reference Natarajan, Plakkot and Tiwari22 the consequences of early nutritional insults on iBAT may differ across developmental stages. Maternal caloric restriction has been shown to impair iBAT thermogenesis and alter offspring preference towards energy-dense diets. Reference Miranda, de Lima and de Costermani23 To the best of our knowledge, no studies have examined the long-term effects of a maternal 4% protein diet during lactation on iBAT β3-AR and UCP1 protein abundance in relation to the somatic and metabolic phenotype of the offspring.
Consequently, the present study sought to evaluate the long-term effects of maternal protein restriction during lactation on selected molecular components of iBAT and the somatic and metabolic phenotype of young adult male offspring. By assessing β3-AR and UCP1 protein levels, which are associated with adrenergic signalling and mitochondrial uncoupling, respectively, alongside somatic parameters and metabolic outcomes, including peripheral insulin sensitivity, we aimed to characterize the phenotype programmed by maternal protein undernutrition.
Materials and methods
Ethical approval
Wistar rats were obtained from the Central Animal Facility of the State University of Maringá and maintained at the Sectorial Animal Facility of the Laboratory of Experimental DOHaD (LexDoHAD). Animals were housed in a temperature-controlled environment (23 ± 2°C) under a 12-h light/dark cycle. All experimental procedures were approved by the Institutional Ethics Committee on Animal Use of the State University of Maringá (CEUA-UEM; protocol no. 8620070222/2022) and conducted in compliance with Brazilian Federal Law No. 11.794/2008 and the ARRIVE 2.0 guidelines. Reference Percie du Sert, Hurst and Ahluwalia24
Animal housing and dietary intervention
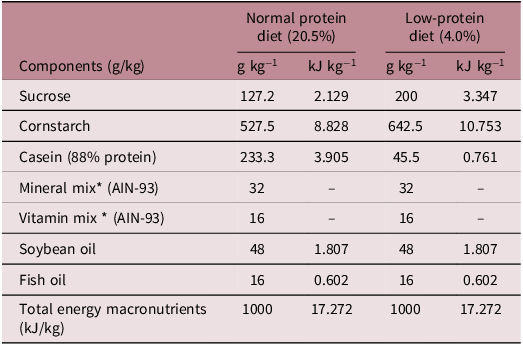
Following a 1-week acclimation period, 10 virgin female Wistar rats were mated with five adult males (2:1 ratio). Pregnancy was confirmed via vaginal smear analysis. Pregnant females were housed individually and provided ad libitum access to water and a standard normoprotein diet (20.5% protein) throughout gestation. The delivery was designated postnatal day (PND) 0. At delivery, dams were randomly assigned to either a normoprotein group (NP; n = 5), which received a balanced control diet (20.5% protein; Nuvital®, Curitiba, Brazil), or a low-protein group (LP; n = 5), which received an isocaloric low-protein diet (4% protein) from PND 0 until PND 14, according to Table 1. Thereafter, all dams were returned to the normoprotein diet (20.5% protein) for the final third of lactation. At PND 21, four male offspring per litter (n = 20 animals per group) were selected and maintained on a standard normoprotein diet until PND 90, when the final experimental procedures were conducted (Figure 1).
Experimental design timeline. After delivery (PND0), two groups were established (n = 5 dams per group). From PND1 to PND14 (the first 14 days of lactation), the dams received a normal-protein (NP, 20.5% protein) or low-protein (LP, 4.0% protein) diet. After PND14, all dams were switched to the NP diet. From weaning until young adulthood, all offspring (n = 20/group) were maintained on an NP diet with free access to food and water. Experiments were conducted at PND85, PND87, and PND90. Created with BioRender.com.

Figure 1. Long description
A diagram illustrating the experimental design timeline for studying the effects of maternal diet on offspring development. Panel A: The top section shows dams on a normal-protein (NP) diet from delivery until weaning. The timeline includes weaning at postnatal day (PND) 21 and young adulthood at PND 90. Offspring are maintained on an NP diet (20.5% protein) from weaning to young adulthood. Panel B: The bottom section shows dams on a low-protein (LP) diet from delivery to PND 14, then switched to an NP diet until weaning. The timeline includes weaning at PND 21 and young adulthood at PND 90. Offspring are maintained on an NP diet (20.5% protein) from weaning to young adulthood. Panel C: Experiments are conducted at PND 85, PND 87, and PND 90. The experiments measure somatic/biochemical parameters, corticosterone and insulin concentration, ipITT, and β3-AR and UCP-1 protein content in interscapular brown adipose tissue (iBAT). Panel D: The diagram shows the measurement of β3-AR receptor and UCP1 levels in interscapular brown adipose tissue (iBAT).
Nutritional composition of normal-protein and low-protein diets

Table 1. Long description
A table comparing nutritional composition of normal-protein and low-protein diets. The table has 8 rows and 6 columns. The columns are labeled Components (g/kg), Normal protein diet (20.5%), Low-protein diet (4.0%), with sub-columns g/kg^-1 and kJ/kg^-1. The rows are labeled with components and their respective values for both diets. Row 1: Sucrose, 127.2 g/kg^-1, 2.129 kJ/kg^-1, 200 g/kg^-1, 3.347 kJ/kg^-1. Row 2: Cornstarch, 527.5 g/kg^-1, 8.828 kJ/kg^-1, 642.5 g/kg^-1, 10.753 kJ/kg^-1. Row 3: Casein (88% protein), 233.3 g/kg^-1, 3.905 kJ/kg^-1, 45.5 g/kg^-1, 0.761 kJ/kg^-1. Row 4: Mineral mix (AIN-93), 32 g/kg^-1, 32 g/kg^-1. Row 5: Vitamin mix (AIN-93), 16 g/kg^-1, 16 g/kg^-1. Row 6: Soybean oil, 48 g/kg^-1, 1.807 kJ/kg^-1, 48 g/kg^-1, 1.807 kJ/kg^-1. Row 7: Fish oil, 16 g/kg^-1, 0.602 kJ/kg^-1, 16 g/kg^-1, 0.602 kJ/kg^-1. Row 8: Total energy macronutrients (kJ/kg), 1000 kJ/kg^-1, 17.272 kJ/kg^-1, 1000 kJ/kg^-1, 17.272 kJ/kg^-1.
The ingredient contents are presented as g/100 g of diet.
* The vitamin and mineral salt mixtures used in the preparation of the diet, expressed in g/kg, and the energy value, expressed in kJ/kg, followed the AIN-93 recommendations Reference Nielsen57 .
Insulin sensitivity testing
At PND 87, rats (n = 10 animals per group) were subjected to a 6-h fast (commencing at 14:00 h) followed by an intraperitoneal insulin tolerance test (ipITT). The animals received an intraperitoneal injection of insulin (1U/kg BW; NovoRapid®, Novo Nordisk, Bagsværd, Denmark). Blood glucose levels were measured using a glucometer (FreeStyle Optium H, Abbott Laboratories, Abbott Park, IL, USA) at 0, 15, 30, 45, and 60 min post-administration. The glucose disappearance rate (Kitt), representing the rate of tissue glucose uptake, was calculated as previously described. Reference Akinmokun, Selby, Ramaiya and Alberti25
Body mass monitoring and food consumption measurements
Throughout the experimental period, BM gain and food consumption (FC) were monitored at two-day intervals until PND 87 and PND 85, respectively. The BM and FC of the offspring were measured between 08:00 and 09:00 every two days. FI values were calculated as the difference between the amount of food remaining (final diet, Df) and the total food available (initial diet, Di) divided by the number of days and the number of rats per cage: FI (grams) = (Fd final−Fd initial)/2 days/4 animals for male rats after weaning until young adulthood. The area under the curve (AUC) for BM and FC over time was calculated for the entire observation period: BM from PND 21 to PND 87 and FC from PND 21 to PND 85 in the offspring, as previously described. Reference Almeida, Simões and Saavedra26,Reference Martins, de Oliveira and Pavanello1
Euthanasia, biometry, and tissue collection
On PND 90, following a 12-h overnight fast with ad libitum access to water, all animals were BM recorded anesthetized with thiopental (45 mg/kg BM, i.p.) and euthanized via decapitation using a guillotine (Thomas Scientific, Swedesboro, NJ, USA), and naso-anal length (NAL) was recorded immediately postmortem. Whole blood was collected for biochemical profiling. Following laparotomy, the liver and specific retroperitoneal adipose depots (r-WAT), mesenteric adipose depots (m-WAT), perigonadal adipose depots (p-WAT), and interscapular brown adipose tissue (iBAT) were dissected and weighed. Relative organ mass was expressed as the organ-to-body mass ratio multiplied by 100. Liver samples (250 mg) were collected from the left lobe (n = 8–10 per group) for lipid content determination.
Serum biochemical analysis
Following decapitation, trunk blood samples were collected and centrifuged to obtain serum, which was immediately divided into aliquots; half were stored at −20°C, and the remainder were stored at −80°C to minimize sample degradation until analysis. Serum concentrations of fasting glucose (ref. 112), total cholesterol (ref. 460), high-density lipoprotein cholesterol (HDL-c, ref. 413), triglycerides (ref. 459), total protein (ref. 418), albumin (ref.419), aspartate aminotransferase (AST, ref.105), and alanine aminotransferase (ALT, ref. 109) were determined using enzymatic colorimetric assays with commercial kits (Gold Analisa®, Belo Horizonte, MG, Brazil) according to the manufacturer’s instructions. The De Ritis index was calculated as the AST/ALT ratio. β-Hydroxybutyrate (COD992390) concentrations were assessed using test strips and a portable meter (FreeStyle Optium Ketone, Abbott Laboratories) on blood collected. Insulin and corticosterone levels were quantified using enzyme-linked immunosorbent assay (ELISA) kits (Elabscience®, Houston, TX, USA; Cat. Nos. E-EL-R3034 and E-OSEL-R0002, respectively). A sandwich ELISA methodology was employed for insulin, while a competitive ELISA approach was used for corticosterone. All assays were performed following the manufacturer’s protocols. The intra-assay coefficients of variation (CV) were 5.29% for insulin and 5.43% for corticosterone, while the interassay CVs were 4.68% for insulin and 6.00% for corticosterone.
Calculated metabolic indices
The adiposity index, an estimate of total visceral fat accumulation, was calculated as the sum of the retroperitoneal, perigonadal, and mesenteric fat depots divided by body weight: adiposity index (%) = [(r-WAT + p-WAT + m-WAT, g)/BM (g)] ×100. Reference Leopoldo, Lima-Leopoldo and Nascimento27 The triglyceride-glucose (TyG) index, an indirect marker of insulin resistance, was calculated as follows: TyG index = ln [fasting triglycerides (mg/dL) × fasting glucose (mg/dL)/2]. Reference Dundar, Terzi and Arslan28 Pancreatic β-cell function was estimated using the HOMA-β index: HOMA-β (%) = [20 × fasting insulin (µU/mL)]/ [fasting glucose (mmol/L)−3.5]. Reference Bonadonna, Blonde and Antsiferov29 The De Ritis index was calculated as the AST/ALT ratio and the AST and ALT concentrations. Reference Botros and Sikaris30
Liver lipid content
Total lipid content in the left lobe of the liver was determined using the Folch method. Reference Folch, Lees and Sloane Stanley31 Briefly, approximately 250 mg of liver tissue was homogenized in 10 mL of a chloroform:methanol solution (2:1, v/v) for lipid extraction. The total lipid content is expressed as a percentage (g/100 g of wet liver weight). Subsequently, liver triglyceride (TG) and cholesterol (CHOL) concentrations were quantified in the total lipid extract diluted in isopropyl alcohol using commercial enzymatic colorimetric kits (Gold Analisa) according to the manufacturer’s instructions and expressed as mg/g of liver. Reference Vargas, Martins and Souza32
Protein immunocontent analysis in iBAT
Protein extraction: iBAT samples (50 mg per sample) were homogenized in RIPA lysis buffer supplemented with 25 mM Tris/HCl (pH 7.6), 150 mM NaCl, 5 mM EDTA, 1% Triton X-100, 1% sodium deoxycholate, 1% SDS, and a cocktail of protease and phosphatase inhibitors (1 mM PMSF, 1 mM sodium orthovanadate, 2 mM sodium pyrophosphate, 10 mM sodium fluoride, 1 mM EGTA, and 2 µg/mL aprotinin). Lysates were subjected to two sequential centrifugations at 12.000 × g for 15 min at 4°C. The supernatants were collected for analysis, and the total protein concentration was quantified using the Pierce™ BCA Protein Assay Kit (Thermo Fisher Scientific, Waltham, MA, USA).
Western blot procedures: Equal protein amounts (50 mg/sample) were denatured in Laemmli loading buffer (50 mM Tris-HCl, pH 6.8; 10% glycerol, 2% SDS, 0.025% bromophenol blue, and 5% β-mercaptoethanol) by boiling at 98°C for 5 min. Proteins were separated via electrophoresis and electrotransferred onto polyvinylidene difluoride (PVDF) membranes at 100 V for 60 min. To block nonspecific binding, membranes were incubated with 5% (w/v) nonfat dry milk in Tris-buffered saline containing 0.25% Tween-20 (TBS-T) for 1 h at room temperature. Membranes were then probed overnight at 4°C with primary antibodies (1:1.000 dilution): anti-UCP1, anti-β3-AR, and anti-calnexin (Sigma–Aldrich and Santa Cruz Biotechnology; Cat. Nos. sc-515763 and sc-23,954). Following three 10-min washes in TBS-T, membranes were incubated for 2 h at room temperature with a horseradish peroxidase-conjugated anti-goat secondary antibody (Sigma–Aldrich, Cat. No. A5420) diluted 1:5.000. Immunoreactive bands were detected using enhanced chemiluminescence (Amersham™ ECL Prime, GE Healthcare, Chicago, IL, USA) and visualized with an ImageQuant LAS 500® system. Densitometric analysis was performed using ImageJ software (NIH, Bethesda, MD, USA), with calnexin serving as the loading control for normalization. Reference Saavedra, Raposo and Assakawa33
Statistical analysis
The results are expressed as the mean ± standard error of the mean (SEM). Statistical analyses were performed using GraphPad Prism (version 8.4). Data normality was confirmed using the Shapiro–Wilk and D’Agostino–Pearson tests, indicating a parametric distribution for all variables analyzed. All data were screened for potential outliers using Grubbs’ test. Comparisons between two groups were performed using Student’s T test. For time-course analyses, differences between groups at each time point were assessed using repeated-measures analysis. Statistical significance was set at P ≤ 0.05.
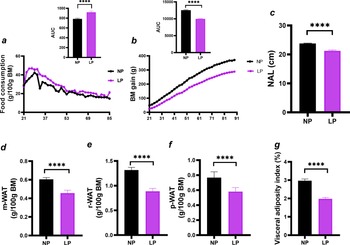
Somatic parameters in young adult male offspring. (a) Food consumption; (b) BM gain; (c) NAL; (d) m-WAT; (e) r-WAT; (f) p-WAT; (g) visceral adiposity index. Data are expressed as the mean ± SEM (n = 8-16 rats/group) and were derived from five independent litters. The upper panels, shown as insects in each graph, illustrate the area under the curve (AUC). Statistical analysis was performed using Student’s T test. Significant differences between the NP and LP offspring are indicated by ****p < 0.0001. NP, offspring of dams fed a normal-protein diet; LP, offspring of dams fed a low-protein diet.
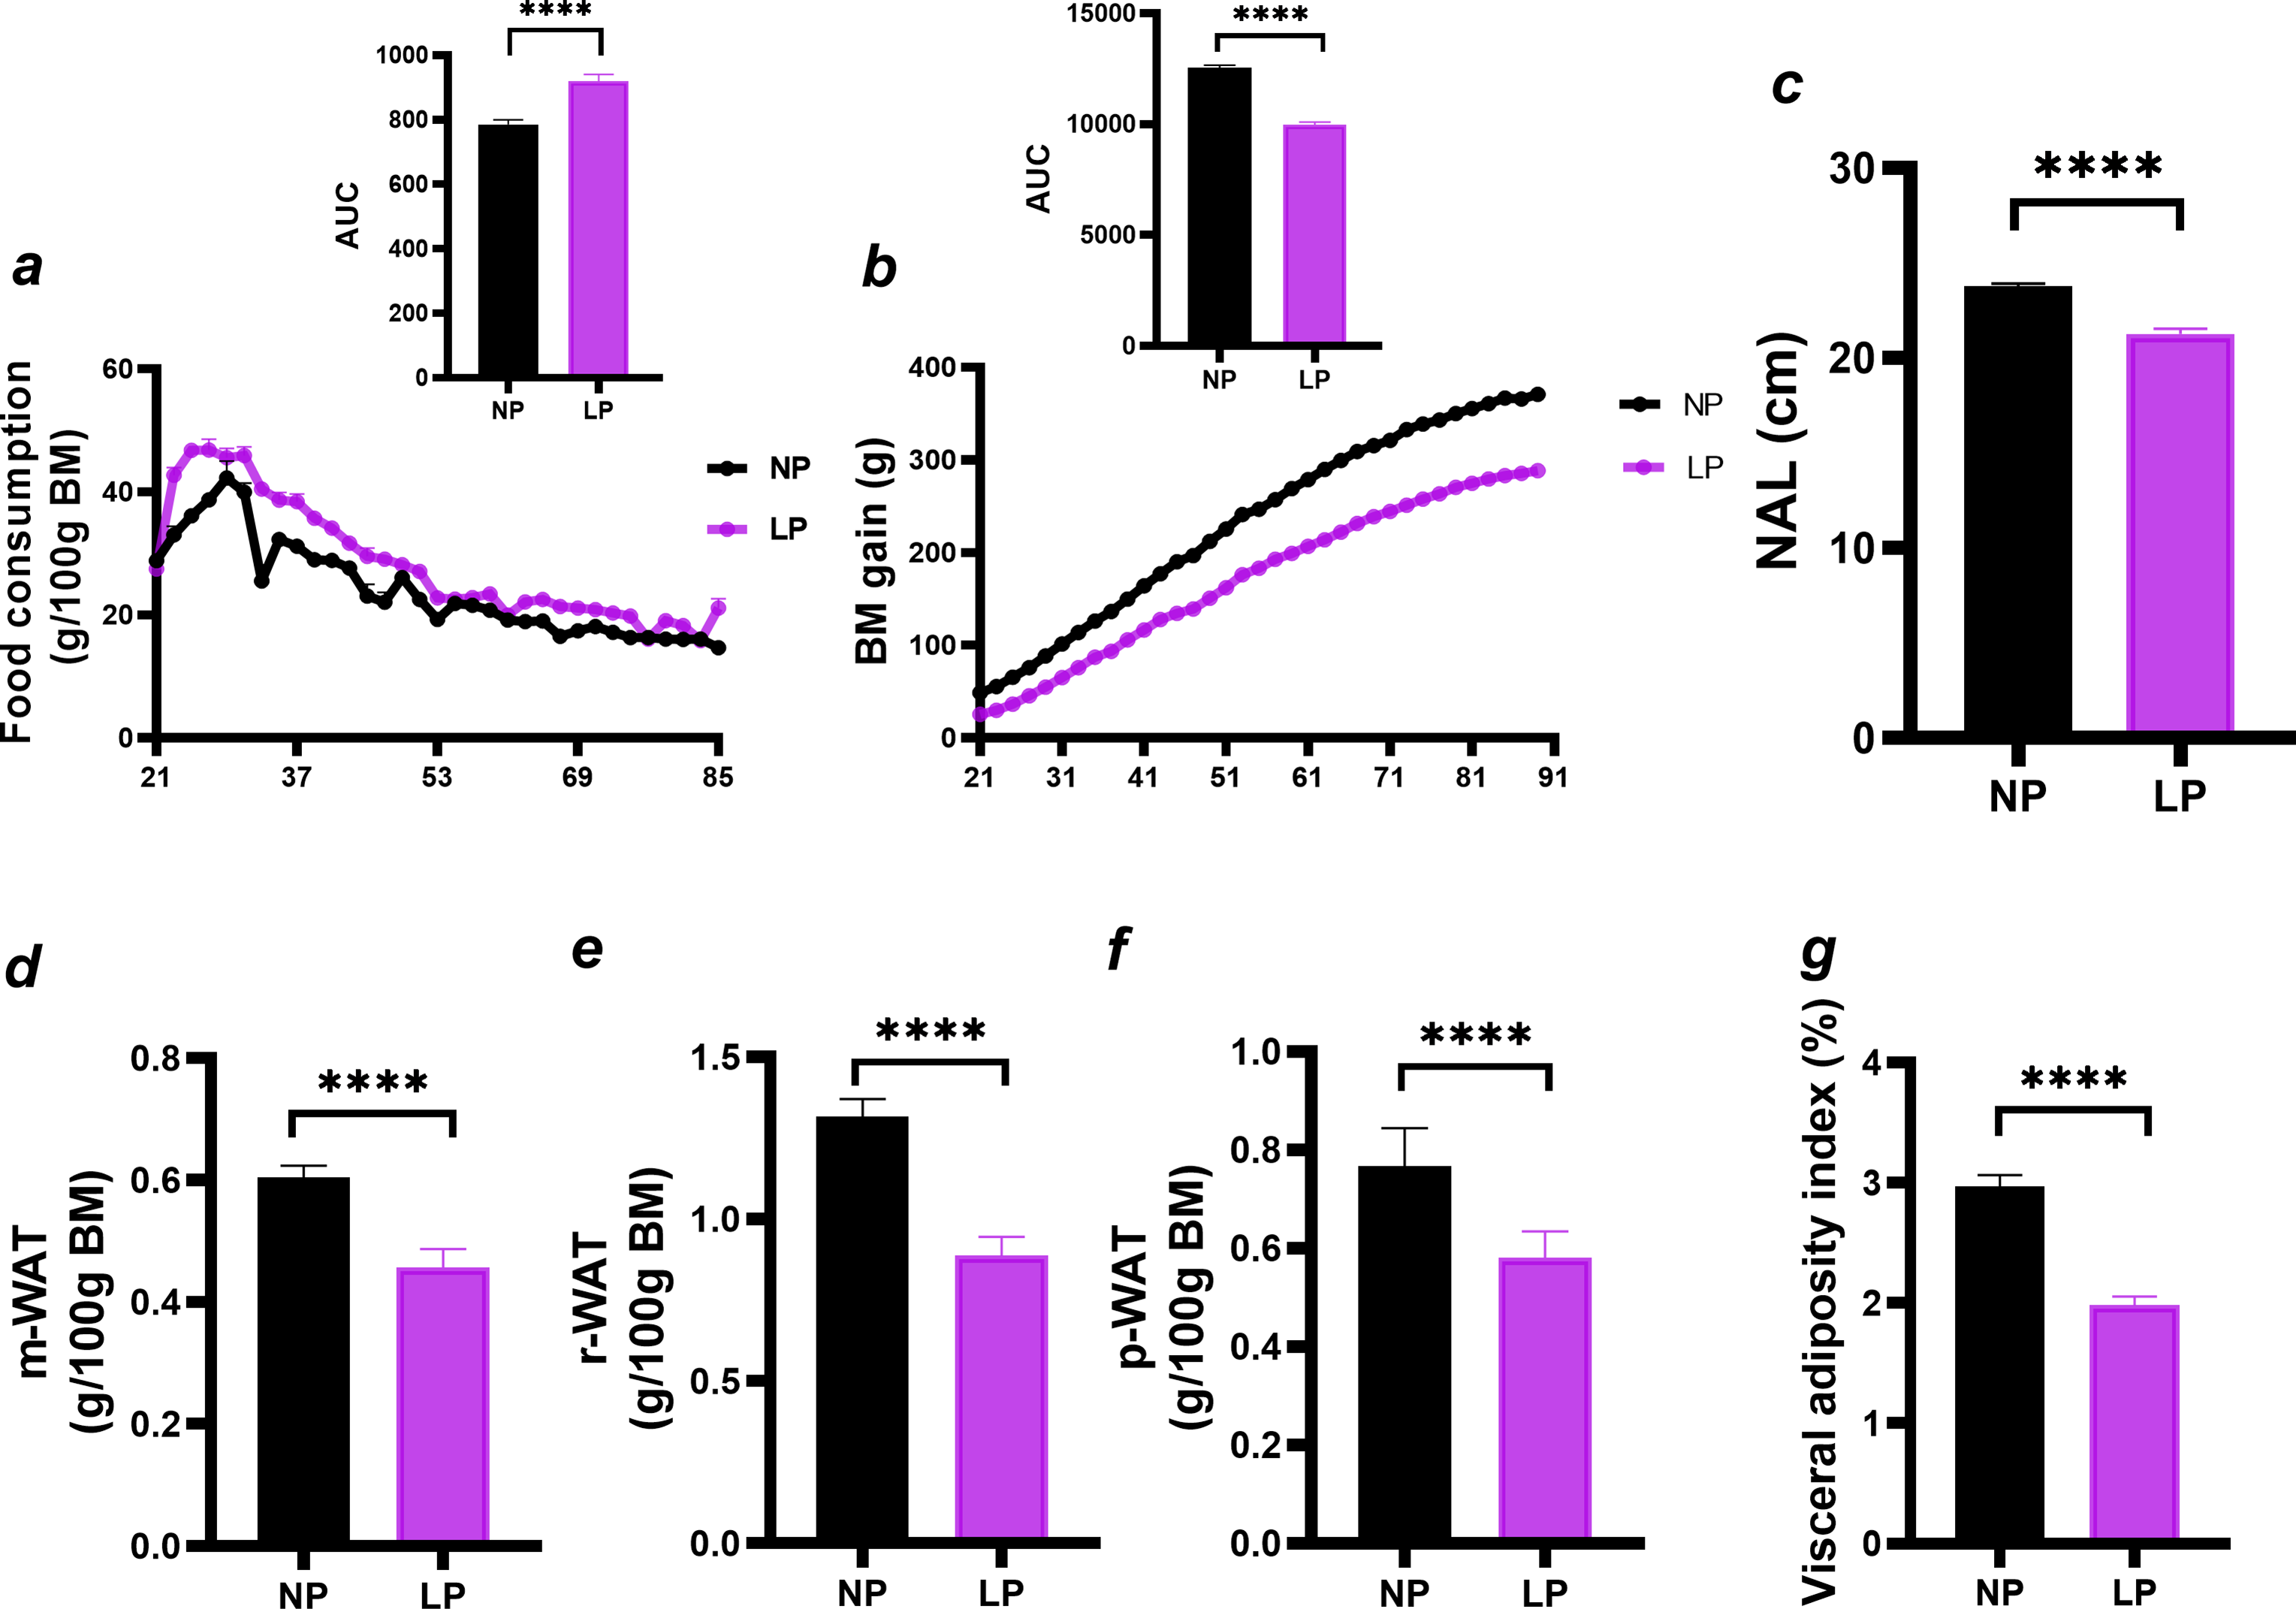
Figure 2. Long description
Panel a: A line graph shows food consumption over time, with the horizontal axis representing days and the vertical axis representing food consumption in grams per 100 grams of body mass. The inset bar graph shows the area under the curve (AUC) for food consumption, with NP (offspring of dams fed a normal-protein diet) in black and LP (offspring of dams fed a low-protein diet) in purple. Panel b: A line graph displays body mass gain over time, with the horizontal axis representing days and the vertical axis representing body mass gain in grams. The inset bar graph shows the AUC for body mass gain. Panel c: A bar graph compares nose-anal length (NAL) in centimeters between NP and LP groups. Panel d: A bar graph shows mesenteric white adipose tissue (m-WAT) in grams per 100 grams of body mass. Panel e: A bar graph depicts retroperitoneal white adipose tissue (r-WAT) in grams per 100 grams of body mass. Panel f: A bar graph illustrates perirenal white adipose tissue (p-WAT) in grams per 100 grams of body mass. Panel g: A bar graph compares the visceral adiposity index as a percentage between NP and LP groups. Significant differences between NP and LP offspring are indicated by asterisks (****p < 0.0001).
Results
At PND 90, LP offspring exhibited higher food consumption (Figure 2a; +17.1%, p < 0.0001) but lower body mass gain (Figure 2b; −20.5%, p < 0.0001), NAL (Figure 2c; −11%, p < 0.0001), m-WAT mass (Figure 2d; −25%, p < 0.0001), r-WAT mass (Figure 2e; −32%, p < 0.0001), p-WAT mass (Figure 2f; −23%, p < 0.0001), and visceral adiposity index (Figure 2g; −33%, p < 0.0001) than NP offspring.
Biochemical parameters in young adult male offspring. (a) Total protein; (b) albumin (ALB); (c) triglycerides; (d) total cholesterol; (e) HDL-c; (f) β-hydroxybutyrate; (g) AST; (h) ALT; (i) AST/ALT ratio. Data are expressed as the mean ± SEM (n = 8–16 rats/group) and were derived from five independent litters. Statistical analysis was performed using Student’s T test. Significant differences between the NP and LP offspring are indicated by *p < 0.05 and ****p < 0.0001. NP, offspring of dams fed a normal-protein diet; LP, offspring of dams fed a low-protein diet.

Compared with NP offspring, LP offspring had lower serum albumin (Figure 3b; −6.5%, p < 0.05) and HDL-c levels (Figure 3e; −60%, p < 0.05) but higher AST levels (Figure 3h; +49%, p < 0.05) and AST/ALT ratios (Figure 3i; +32%, p < 0.05). Total protein, triglycerides, total cholesterol, β-hydroxybutyrate, and ALT did not differ between groups (Figure 3a, c, d, f, and g, respectively, ns).
Changes in liver fat content in young adult male offspring. (a) Liver BM; (b) total liver fat content; (c) liver TG content; (d) liver CHOL content. Data are expressed as the mean ± SEM (n = 8 animals/group) and were derived from five independent litters. Statistical analysis was performed using Student’s T test. Significant differences between the NP and LP offspring are indicated by **p < 0.01. NP, offspring of dams fed a normal-protein diet; LP, offspring of dams fed a low-protein diet.

Liver CHOL content was higher in LP offspring (Figure 4d, +44%, p < 0.01), whereas liver BM, total liver fat, and liver TG content did not differ between groups (Figure 4a-c, ns).
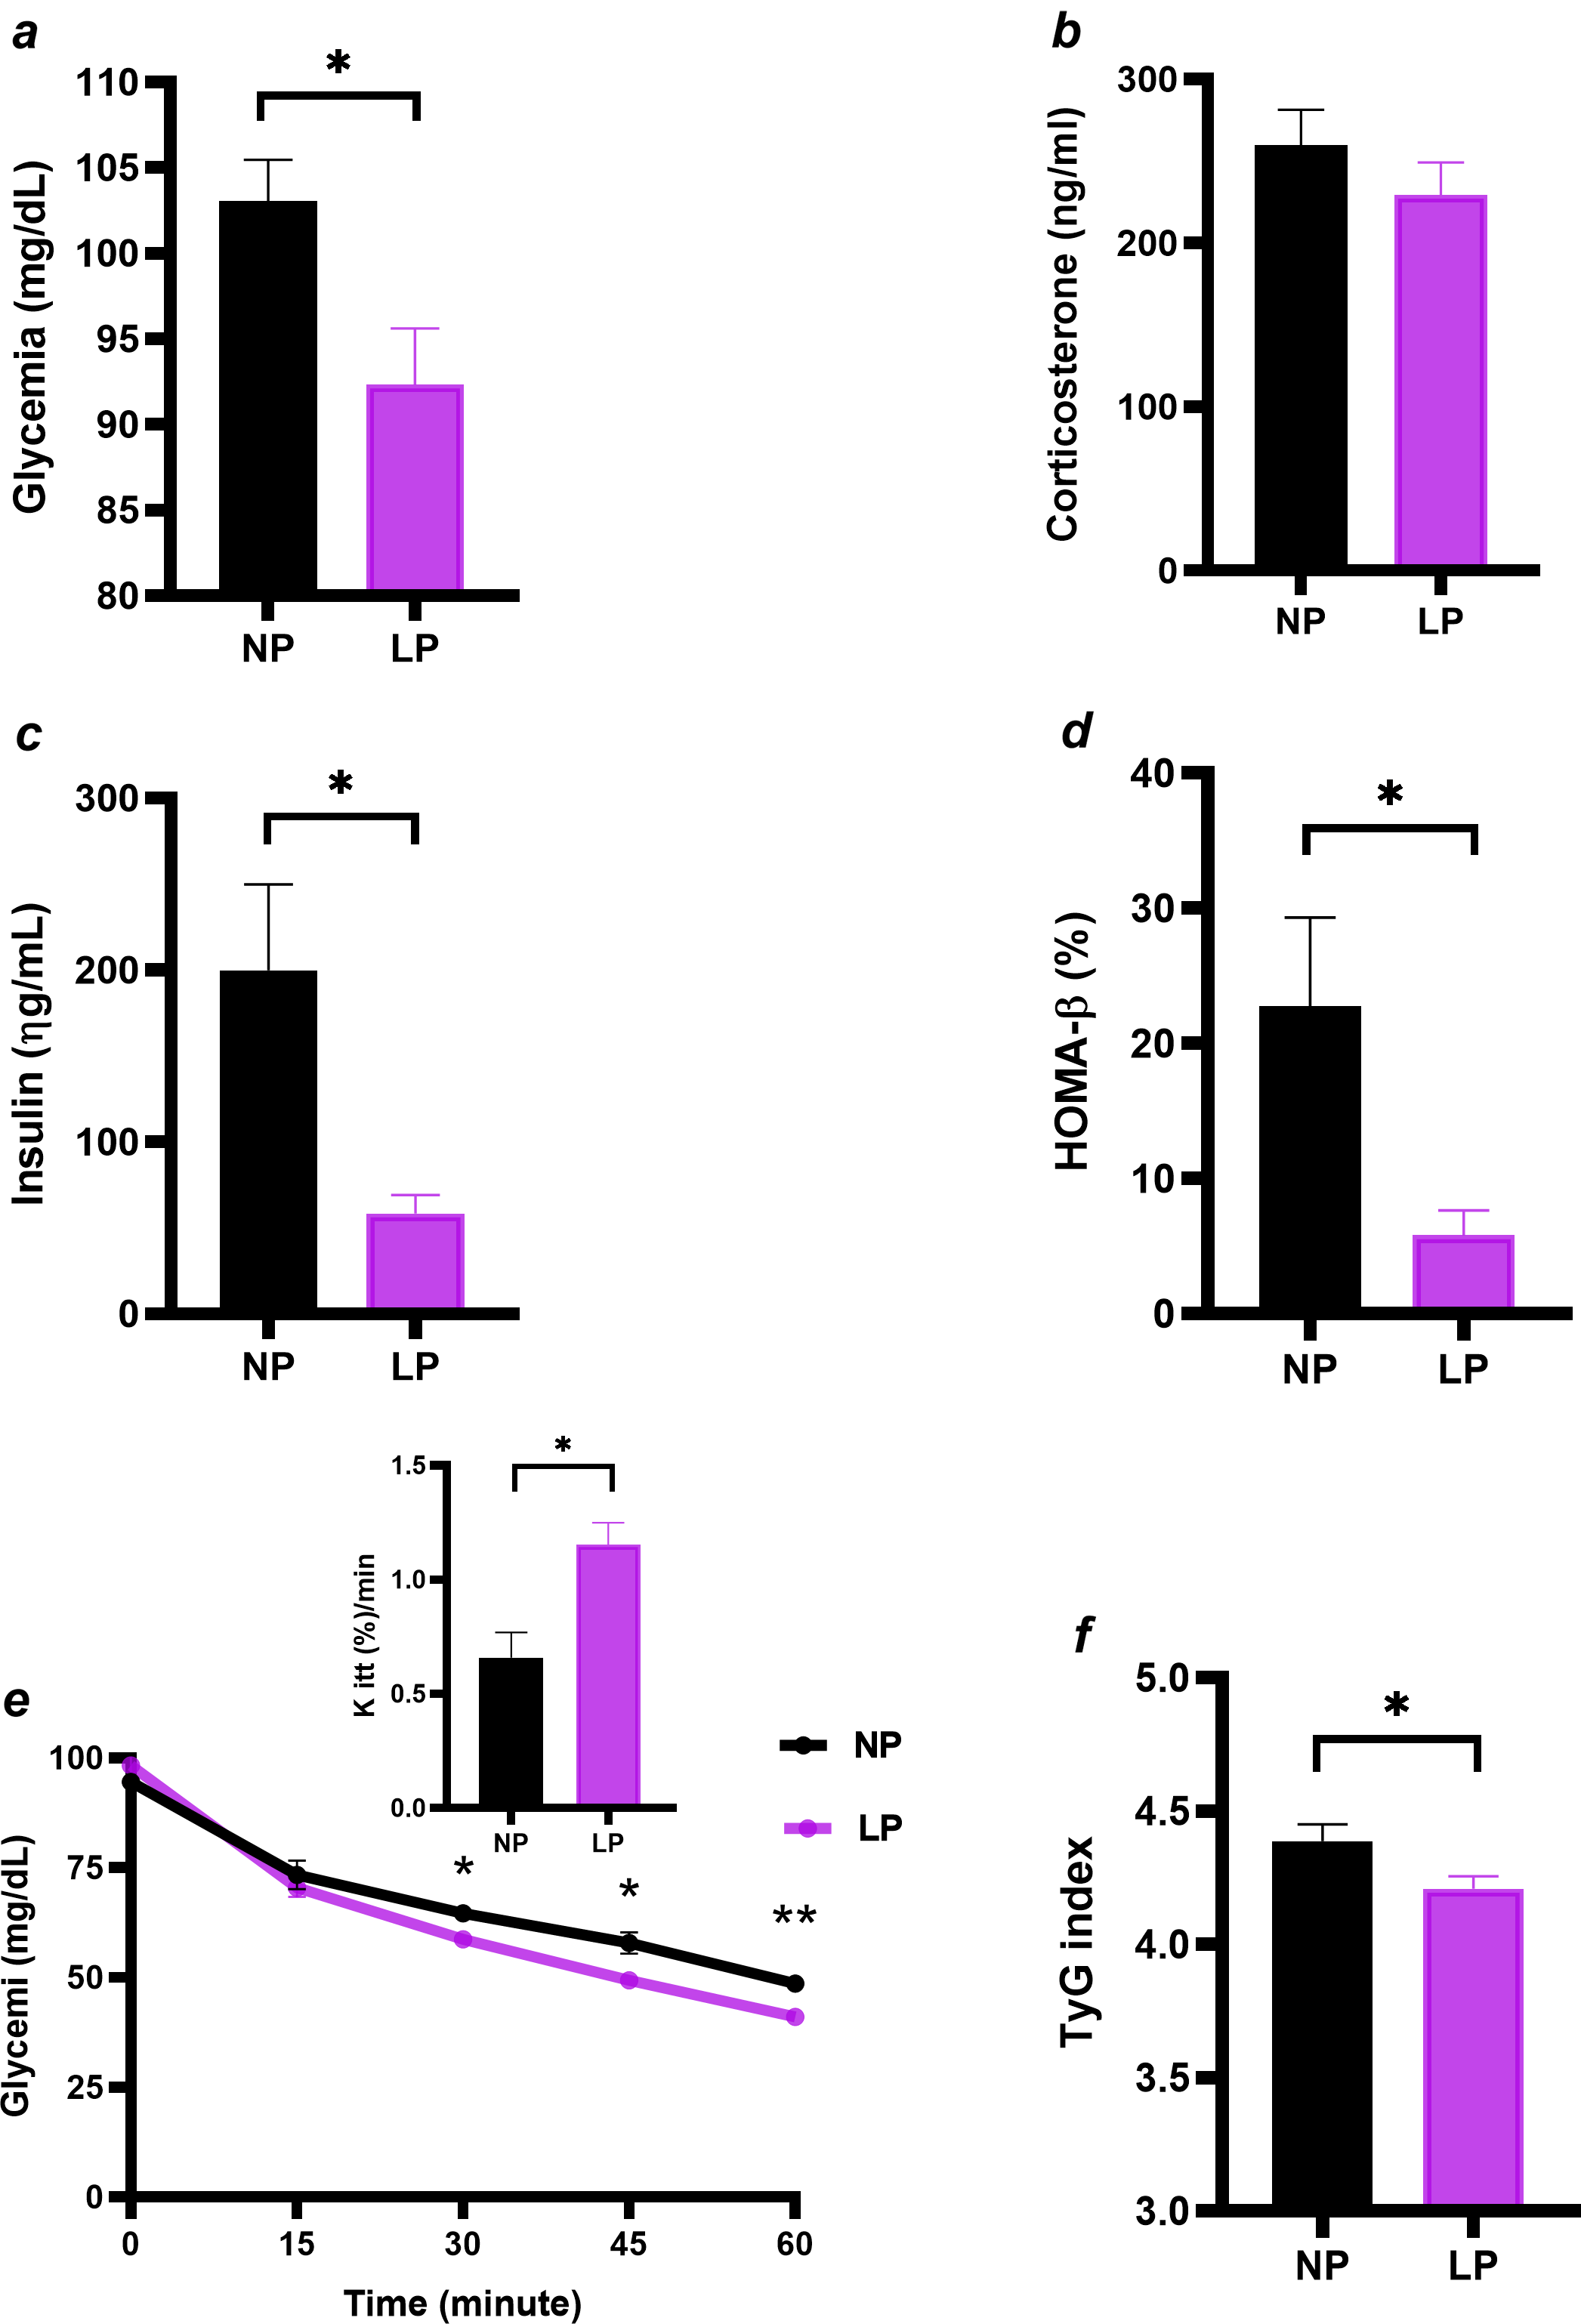
Maternal protein malnutrition alters glucose homeostasis in young adult offspring. (a) Glycemia; (b) insulin; (c) β-cell function index (HOMA-β); (d) ITT and kITT; (e) TyG index. Data are expressed as the mean ± SEM (n = 5-10 rats/group) and were derived from five independent litters. Significant differences between the NP and LP offspring are indicated by *p < 0.05 and **p < 0.01. NP, offspring of dams fed a normal-protein diet; LP, offspring of dams fed a low-protein diet.

LP offspring exhibited lower fasting glycemia (Figure 5a; −10%, p < 0.05), insulinemia (Figure 5c; −70%, p < 0.05), HOMA-β (Figure 5d; −74%, p < 0.05), and TyG index (Figure 5f; −5%, p < 0.05) than NP offspring, whereas corticosterone did not differ between groups (Figure 5b; ns). Blood glucose levels during the insulin sensitivity test are shown in Figure 5e, showing that LP offspring displayed approximately 140% greater insulin sensitivity (Figure 5e; p < 0.01).
Effects of maternal protein undernutrition during breastfeeding on key markers of iBAT. (a) iBAT mass; (b) iBAT UCP1 protein content; (c) iBAT β3-AR receptor protein content. Data are expressed as the mean ± SEM (n = 8–16 rats/group) and were derived from four independent litters. Statistical analysis was performed using Student’s T test. Significant differences between the NP and LP offspring are indicated by *p < 0.05. NP, offspring of dams fed a normal-protein diet; LP, offspring of dams fed a low-protein diet.

Figure 6. Long description
Panel A: A vertical bar graph shows iBAT mass in grams per 100 grams of body mass (BM) for two groups: NP (offspring of dams fed a normal-protein diet) and LP (offspring of dams fed a low-protein diet). The y-axis ranges from 0.00 to 0.08. The NP group has a slightly higher iBAT mass compared to the LP group. Panel B: Another vertical bar graph displays iBAT β3-AR receptor protein content as a percentage of control for the NP and LP groups. The y-axis ranges from 0 to 150 percent. The NP group shows higher β3-AR receptor protein content than the LP group. Panel C: A vertical bar graph illustrates iBAT UCP1 protein content as a percentage of control for the NP and LP groups. The y-axis ranges from 0 to 150 percent. The NP group has significantly higher UCP1 protein content compared to the LP group, indicated by an asterisk denoting statistical significance (p < 0.05).
Compared with NP offspring, LP offspring exhibited 35.6% lower UCP1 protein expression (Figure 6c; p < 0.05), whereas iBAT mass and β3-AR protein expression did not differ between groups (Figure 6a-b; ns).
Discussion
The present study investigated the long-term metabolic and somatic programming effects of maternal LP during lactation, with emphasis on insulin sensitivity and iBAT markers in young adult male offspring. LP offspring exhibited hyperphagia together with lower BM gain, reduced body size, and decreased visceral adiposity, demonstrating a dissociation between FC and energy storage. Because these alterations persisted despite postweaning nutritional recovery, the phenotype is consistent with long-lasting changes in energy utilization and partitioning. Similar reductions in BM and adiposity without reduced FC have been reported in male Wistar rats exposed to maternal LP during lactation. Reference Fagundes, Moura and Passos18 Hyperphagia may represent a compensatory response to reduced energy reserves or involve altered central regulation of feeding, as maternal LP exposure may affect hypothalamic NPY signalling and diencephalic circuits involved in feeding behavior. Reference Bouret34 However, energy expenditure, intestinal absorption, and central mechanisms were not assessed. This somatic phenotype provides the physiological context for the biochemical and tissue-specific alterations observed in LP offspring.
The serum biochemical profile did not indicate overt liver cell injury despite selective metabolic alterations. Albumin and HDL-c concentrations were reduced, and the AST/ALT ratio increased, whereas ALT remained within the normal range. Because AST is also present in extrahepatic tissues, including skeletal muscle, its elevation may reflect liver or muscular alterations that cannot be distinguished without additional markers. Unchanged total protein suggests preservation of the overall circulating protein pool but may conceal changes in specific fractions. In protein-restricted rats, plasma albumin may not reflect whole-body albumin mass because of altered distribution between vascular and extravascular compartments. Thus, lower albumin in LP offspring cannot be attributed exclusively to impaired liver synthesis. Albumin contributes to plasma oncotic pressure and transports hormones and other molecules, Reference Carvalho and Machado35 and lower circulating concentrations have been associated with increased cardiovascular risk in humans, Reference Ferreira, Ribeiro and Peres36,Reference Rahman and Begum37 although this does not establish causality. These findings therefore indicate altered circulating protein homeostasis or distribution rather than demonstrated loss of liver synthetic capacity.
Cholesterol homeostasis was also selectively affected. Total liver lipid and TG contents remained unchanged, whereas liver CHOL increased and circulating HDL-c decreased despite unchanged total serum CHOL. This pattern suggests altered CHOL distribution among lipoprotein fractions and liver CHOL handling without generalized liver lipid accumulation. The liver and intestine contribute to HDL biogenesis, Reference Brunham, Kruit, Pape, Parks, Kuipers and Hayden38 while the liver plays a central role in systemic CHOL homeostasis; Reference Alves-Bezerra and Cohen39 however, reduced HDL-c alone does not demonstrate impaired cellular CHOL efflux or reverse CHOL transport. In the context of hyperphagia, the selective increase in liver CHOL without increased adiposity further indicates that these changes were not accompanied by generalized excess energy storage.
Maternal LP also programmed a distinct pattern of glucose homeostasis, characterized by lower basal insulinemic and enhanced peripheral insulin responsiveness. LP offspring exhibited reduced fasting glucose and insulin, lower HOMA-β and TyG indices, and increased kITT. The concordance between lower TyG and higher kITT supports greater insulin responsiveness, which may be partly associated with reduced visceral adiposity, as lower visceral and ectopic lipid accumulation can limit lipid-mediated impairment of insulin action. Reference Alves-Bezerra and Cohen39 Conversely, lower fasting insulin and HOMA-β are compatible with reduced basal β-cell activity but do not demonstrate impaired pancreatic secretory capacity. This interpretation is consistent with studies showing that maternal undernutrition can alter pancreatic islet composition, reduce β-cell mass, and impair mTOR signalling Reference Calzada, Morales and Sosa-Larios40,Reference de Mathias PC, Miranda and Barella41,Reference de Oliveira, Miranda and Barella42 and with evidence that early nutritional insults program long-term changes in insulin production and β-cell function. Reference dos Reis Araujo, Alves, dos Santos, Gonçalves and Carneiro43,Reference King, Hill and Saha44 Lower insulin availability may also contribute to reduced somatic growth and fat deposition given the anabolic role of insulin. Reference Araki, Lipes and Patti45,Reference Blüher, Michael and Peroni46 Collectively, these findings support an insulin-sensitive phenotype with lower basal insulinemic rather than insulin resistance, although pancreatic secretory capacity was not directly assessed.
At the iBAT level, maternal LP reduced UCP1 abundance without altering β3-AR abundance or iBAT mass. Noradrenaline released by postganglionic sympathetic neurons stimulates brown adipocyte lipolysis and thermogenesis through β3-AR activation. Reference Cannon and Nedergaard47 Although BAT can increase energy expenditure through UCP1-mediated thermogenesis, its physiological roles are not restricted to adiposity regulation; Reference Kozak, Koza and Anunciado-Koza48] therefore, the reduced visceral adiposity of LP offspring cannot be attributed exclusively to BAT thermogenesis. At thermoneutrality, UCP1 ablation in C57BL/6 mice induced obesity through increased metabolic efficiency and adiposity without altering lean mass or basal metabolic rate. Reference Feldmann, Golozoubova, Cannon and Nedergaard49 Direct comparison is limited because the present rats were maintained at approximately 22°C and were not exposed to cold or dietary challenges. Previous nutritional programming models have also shown unchanged thermogenic activity in animals with visceral obesity Reference de Rodrigues W.N., Malta and Lucredi50 or increased activity in animals with low visceral adiposity, Reference Miranda, de Lima and de Costermani23 despite reduced β3-AR expression in both. These findings indicate that β3-AR abundance alone does not predict thermogenic activity. In the present model, reduced UCP1 therefore occurred despite unchanged β3-AR abundance, suggesting that regulation downstream of the receptor may have been altered, although the underlying mechanism remains unknown.
The reduction in UCP1 protein abundance should be interpreted within the environmental and physiological contexts that regulate BAT. UCP1 expression is highly responsive to external stimuli, such as cold exposure, and metabolic conditions, including diet and fasting, and is coordinated by adrenergic signalling pathways that integrate the thermogenic response of the organism. Because this pathway was not assessed, reduced UCP1 cannot be attributed directly to impaired intracellular signalling or fatty acid oxidation. Reference Inagaki, Sakai and Kajimura51 Reduced UCP1 has been associated with greater susceptibility to hypothermia during cold exposure, Reference Zhang, Xiao, Jiang, Phillips and Shi52 which is relevant because approximately 22°C represents a mild chronic cold challenge for rodents, Reference Miller, Pahlavani, Ramalingam, Scoggin and Moustaid-Moussa53,Reference Gordon54 whereas UCP1-mediated thermogenesis is minimized at thermoneutrality. Reference Desai, Torsoni, Torsoni, Eisaghalian, Ferrini and Ross55 Thus, whether the difference between LP and NP offspring persists or has functional consequences under thermoneutrality or acute cold exposure remains unknown. Measurements of thermogenic activity, mitochondrial respiration, body temperature, cold tolerance, and β3-AR responsiveness are required to establish its functional significance.
WAT and BAT responses to maternal LP may vary with tissue type, developmental stage, and sex. Previous work using this model reported reduced iBAT mass at weaning, Reference Martins, Vargas and Saavedra13 but thermogenesis, β3-AR, and UCP1 were not assessed at that stage, leaving the functional basis of this finding unresolved. At PND 90, LP offspring showed reduced visceral WAT and unchanged iBAT mass together with lower iBAT UCP1, indicating distinct responses of WAT and BAT compartments. The difference in iBAT mass between weaning and young adulthood is consistent with an age-dependent response, but the lack of longitudinal and functional measurements prevents mechanistic linkage. iBAT morphology was also not examined at PND 90. In addition, only males were evaluated. Previous observations from our group showed increased brown adipocyte size and number in female offspring exposed to maternal LP, Reference Vargas, Martins and Souza32 supporting the investigation of sexual dimorphism in iBAT remodeling. Direct male/female comparisons are required to establish sex-specific effects on β3-AR, UCP1, and BAT function.
Contrary to our initial hypothesis, maternal LP during lactation did not induce a metabolic syndrome-like phenotype in male offspring at PND 90. Despite nutritional recovery, LP offspring remained hyperphagic and displayed impaired somatic growth, reduced visceral adiposity, enhanced peripheral insulin responsiveness, selective alterations in circulating protein and CHOL homeostasis, and reduced iBAT UCP-1 despite unchanged β3-AR abundance and iBAT mass. This pattern defines a metabolically altered lean phenotype rather than an unaffected state or overt metabolic syndrome-like condition, as obesity, insulin resistance, hyperglycemia, generalized liver lipid accumulation, and overt liver cell injury were absent. Although PND 90 represents young adulthood, Reference Ghasemi, Jeddi and Kashfi56 this phenotype cannot be extrapolated across the lifespan. Metabolic outcomes may change with aging even under continued NP feeding. Longitudinal studies at later ages and under defined physiological challenges are therefore needed to determine whether this programmed phenotype remains stable or becomes maladaptive. Overall, the findings identify lactation as a critical developmental window whose metabolic consequences persist after nutritional recovery but remain dependent on age and physiological context.
Conclusion
Maternal protein restriction during lactation programmed a persistent, metabolically altered lean phenotype in adult male offspring, characterized by hyperphagia, impaired somatic growth, lower fat mass index and BM, enhanced peripheral insulin responsiveness, alterations in protein and cholesterol homeostasis, and reduced UCP1 abundance in iBAT, despite unchanged β3-AR abundance and iBAT mass. Therefore, early postnatal protein restriction did not induce a metabolic syndrome-like phenotype at PND 90 but produced persistent systemic and molecular effects in iBAT after nutritional recovery. Further functional and longitudinal studies are needed to determine whether these adaptations remain stable or become detrimental with aging.
Acknowledgments
The authors gratefully acknowledge researcher Renata Marino Romano for her valuable contribution to the English-language editing and grammatical revision of the manuscript.
Financial support
This work was supported by the Coordination for the Improvement of Higher Education Personnel (CAPES) under its 2020 Emergency Action, Finance Code 001; the National Council for Scientific and Technological Development (CNPq, Brazil), through INCT DOHaD Brazil, under grant 409165/2024-7 (INCT Call 46/2024); the Institute of Applied Medical Research (INSPAM); and the João Batista Sobrinho Foundation (JBS).
Competing interests
The authors declare that there are no conflicts of interest regarding this study.