1 Introduction
When a shock wave collides with a perturbed interface separating two different fluids, initial perturbations on the interface grow continuously with time, and later induce a flow transition to turbulent mixing. This type of hydrodynamic instability is referred to as the Richtmyer–Meshkov instability (RMI) since it was first theoretically analysed by Richtmyer (Reference Richtmyer1960) and later experimentally confirmed by Meshkov (Reference Meshkov1969). Over the past few decades, the RMI has become a subject of active research due to its fundamental significance in academic research – for example, compressible turbulence – as well as its important role in engineering applications such as supersonic combustion (Yang, Kubota & Zukoski Reference Yang, Kubota and Zukoski1993) and inertial confinement fusion (ICF) (Lindl et al. Reference Lindl, Landen, Edwards, Moses and Team2014).
Previous experiments on RMI mainly focused on the planar shock-induced case (Brouillette Reference Brouillette2002; Ranjan, Oakley & Bonazza Reference Ranjan, Oakley and Bonazza2011), and only few exceptions (Hosseini & Takayama Reference Hosseini and Takayama2005; Luo et al. Reference Luo, Zhang, Ding, Si, Yang, Zhai and Wen2018; Vandenboomgaerde et al. Reference Vandenboomgaerde, Rouzier, Souffland, Biamino, Jourdan, Houas and Mariani2018) were devoted to its converging counterpart because of great difficulties in producing stable converging shock waves and forming controllable material interfaces. Recently, a semi-annular converging shock tube was designed and the facility exhibited great merit in conducting converging RMI experiments (Luo et al. Reference Luo, Ding, Wang, Zhai and Si2015). Subsequently, the growth of a sinusoidal air/SF $_{6}$ interface subjected to a cylindrical shock was first measured in this tube (Ding et al. Reference Ding, Si, Yang, Lu, Zhai and Luo2017) and, in addition to the common physics in the planar RMI, such as baroclinic vorticity and pressure perturbation, the Bell–Plesset (hereafter BP) (Bell Reference Bell1951; Plesset Reference Plesset1954) and Rayleigh–Taylor (hereafter RT) (Lord Rayleigh Reference Rayleigh1883; Taylor Reference Taylor1950) effects were found to greatly influence the development of instability.
Note that the existing findings are applicable only to the convergent RMI on one sole interface, but may fail for situations such as ICF, where the instability occurs on both the inner and outer interfaces, and for which experimental studies are scarce. The presence of two interfaces introduces new physical mechanisms – for example, interface coupling and the influence of complex waves reverberating between two interfaces. Moreover, these new regimes couple with the BP and RT effects, making evolution of the instability much more complicated than that of a single interface. There are two fundamental configurations for a gas layer: heavy layer (the interior gas is denser than the exterior) and light layer (vice versa). Such two types of layers usually exhibit distinct evolution processes due to the opposite Atwood numbers ( $A=(\unicode[STIX]{x1D70C}_{2}-\unicode[STIX]{x1D70C}_{1})/(\unicode[STIX]{x1D70C}_{2}+\unicode[STIX]{x1D70C}_{1})$, with
 $\unicode[STIX]{x1D70C}_{1}$ and
 $\unicode[STIX]{x1D70C}_{2}$ being the gas densities on the left and right sides of the interface, respectively) across each interface (Lombardini, Pullin & Meiron Reference Lombardini, Pullin and Meiron2014). Recently, we have examined the evolution of a heavy gas layer with a sinusoidal perturbation on its outer surface subjected to a cylindrical shock by shock-tube experiments (Ding et al. Reference Ding, Li, Rui, Zhai and Luo2019). It was found that the interface coupling effect, the distorted transmitted shock and the geometric constraint greatly affect the development of instability. However, the problem of a light gas layer accelerated by a converging shock has not yet been well investigated – which is more relevant to the so-called double-shell implosion (Montgomery et al. Reference Montgomery, Daughton, Albright, Simakov, Wilson, Dodd, Kirkpatrick, Watt, Gunderson and Loomis2018). This motivates the current study.
In this work, a controllable light gas layer with a sinusoidal outer interface and a uniform inner surface is produced by the soap film technique and then examined in a semi-annular converging shock tube. We shall first focus on development at the inner interface caused by the transmitted shock. Then, influences of the layer thickness and the outer perturbation amplitude on development of the instability are addressed.
2 Experimental method
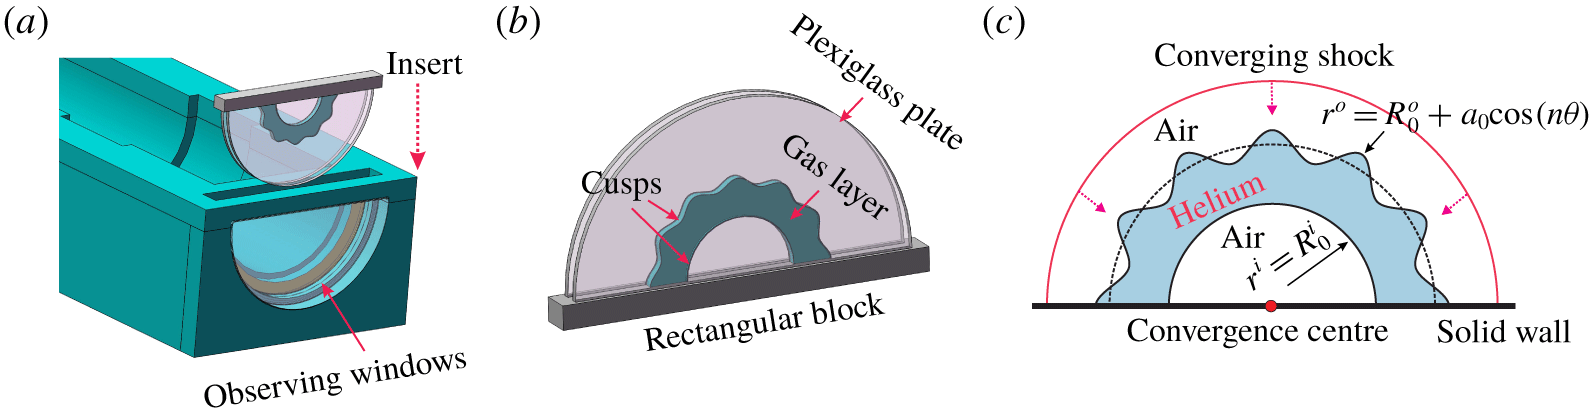
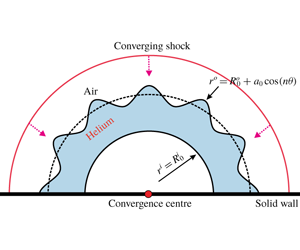
The experiments are conducted in a semi-annular converging shock tube, which has exhibited excellent feasibility and reliability for producing stable converging shock waves (Luo et al. Reference Luo, Ding, Wang, Zhai and Si2015). The overall structure of the shock tube as well as the principle of cylindrical shock formation has been detailed in previous work (Luo et al. Reference Luo, Ding, Wang, Zhai and Si2015; Ding et al. Reference Ding, Si, Yang, Lu, Zhai and Luo2017), and thus is not presented here. Benefiting from the open test section, a removable interface formation device is designed, in which gaseous interfaces can be readily formed using the existing methods. As shown in figure 1(b), the device consists of two semi-circular Plexiglas plates inserted in a rectangular block. Two pairs of cusps with a special (sinusoidal or circular) shape are mounted on the internal surfaces of the plates to produce the desired constraint. In experiments, a thin pipe with its leading end dipped with some soap solution (made of 78 % distilled water, 2 % sodium oleate and 20 % glycerine by mass) is first inserted in the device (located at the region enclosed by the cusps). As the test gas (helium) is supplied through the pipe, a gas bubble is immediately formed. Later, the bubble expands continuously and contacts the cusps. Then, the soap film (bubble surface) moves along the cusps, and finally a gas layer with a designed shape is formed. Subsequently, the whole device is inserted into the test section and equipped tightly with optical windows such that the experiment can be done. Figure 1(c) schematically shows the experimental configuration, where a cylindrically converging shock moves inwards and impacts the perturbed helium layer. In a cylindrical coordinate system, the outer surface of the layer is parameterized as  $r^{o}=R_{0}^{o}+a_{0}\cos (n\unicode[STIX]{x1D703})$ and the uniform inner surface as
 $r^{i}=R_{0}^{i}$. Here,
 $R_{0}$ is the radius of the initial interface,
 $a_{0}$ is the initial amplitude and
 $n$ is the azimuthal mode number. Superscript
 $o$ (
 $i$) denotes the outer (inner) interface.
Drawings of (a) the open test section, (b) the interface formation device and (c) the experimental configuration corresponding to a cylindrical shock impacting a helium layer. The single-mode outer interface is described by  $r^{o}=R_{0}^{o}+a_{0}\cos (n\unicode[STIX]{x1D703})$ and the uniform inner interface by
 $r^{i}=R_{0}^{i}$, where
 $R_{0}$ is the radius of the initial interface,
 $a_{0}$ is the initial amplitude and
 $n$ the azimuthal mode number. Superscripts
 $o$ (
 $i$) denotes the outer (inner) interface.

Due to the wide-open inner core, a Z-fold high-speed schlieren system can be readily adapted to the facility, which greatly facilitates flow diagnostics for convergent RMI. The frame rate of the high-speed video camera is set to 54 250 f.p.s. with a shutter time of  $1~\unicode[STIX]{x03BC}\text{s}$. The pixel resolution of the schlieren images is approximately
 $0.27~\text{mm}~\text{pixel}^{-1}$. The incident cylindrical shock has a strength of
 $M_{s}=1.25$ when it reaches the mean position of the outer surface. The ambient pressure and temperature are 101.3 kPa and 289.15 K, respectively.
3 Results and discussion
3.1 Unperturbed case
The evolution of an unperturbed helium layer ( $r^{o}=55$ mm,
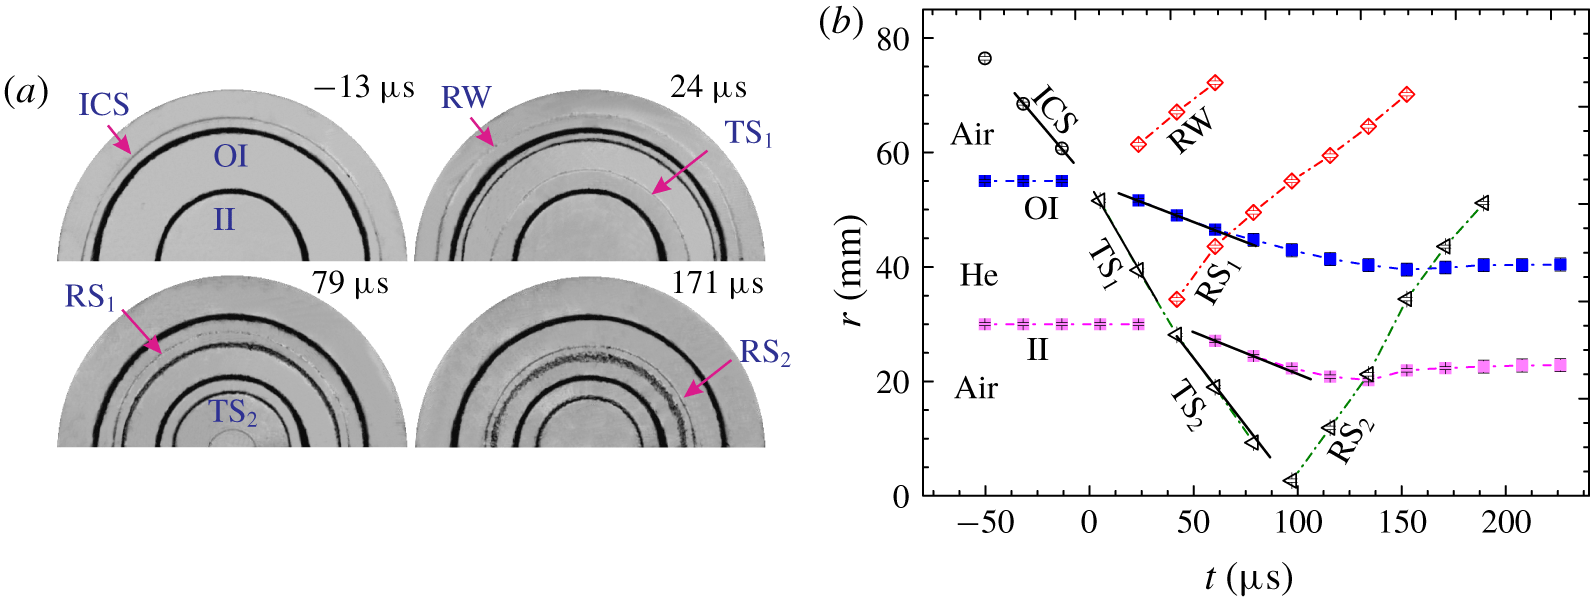
 $r^{i}=30$ mm) impacted by a convergent cylindrical shock is first considered to obtain the movements of the waves and the interfaces. As shown in figure 2(a), an incident cylindrical shock (ICS) together with the outer and inner boundaries of the gas layer can be clearly discerned in the schlieren images, which demonstrates the excellent feasibility of the current experimental methods. The ingoing ICS first collides with the outer interface (OI), generating an outward-moving rarefaction wave (RW) and an inward-moving transmitted shock (
 $\text{TS}_{1}$). After the shock impact, the OI moves inwards following
 $\text{TS}_{1}$. Later, the imploding
 $\text{TS}_{1}$ encounters the inner interface (II) and a second transmitted shock (
 $\text{TS}_{2}$) together with a reflected shock (
 $\text{RS}_{1}$) is produced. At approximately
 $90~\unicode[STIX]{x03BC}\text{s}$,
 $\text{TS}_{2}$ focuses at the geometric centre and an outgoing reflected shock (
 $\text{RS}_{2}$) is immediately generated. Later, the outgoing
 $\text{RS}_{2}$ re-accelerates the evolving outer and inner interfaces successively, producing complex wave patterns.
(a) Development of an unperturbed helium layer surrounded by air accelerated by a cylindrical shock and (b) the trajectories of the interfaces and the waves. ICS, incident cylindrical shock; OI, outer interface; II, inner interface; RW, rarefaction wave;  $\text{TS}_{1}$, transmitted shock;
 $\text{TS}_{2}$, second transmitted shock;
 $\text{RS}_{1}$, reflected shock;
 $\text{RS}_{2}$, second reflected shock.

Trajectories of the waves and the interfaces extracted from the schlieren images are plotted in figure 2(b). Note that the dynamic range of our digital camera (FASTCAM SA5, Photron Limited) is 0–255 in pixel counts, and the shock and interface locations are measured by the central position of the layers (pixel count  ${<}40$). The ICS located initially at
 $r=60~\text{mm}$ propagates at a nearly uniform speed of
 $426~\text{m}~\text{s}^{-1}$ in air, corresponding to a Mach number of 1.25. After the collision between ICS and OI the shock
 $\text{TS}_{1}$ is generated and moves at a speed of
 $636~\text{m}~\text{s}^{-1}$ initially. According to one-dimensional gas dynamics theory, the volume fraction of helium inside the layer is estimated to be approximately 64 %. After shock impingement, both the OI and II implode uniformly initially and later undergo a considerable deceleration prior to the reshock. The speed of the OI is measured to be approximately
 $143~\text{m}~\text{s}^{-1}$ at early times, which agrees reasonably with the one-dimensional gas dynamics prediction (
 $148.6~\text{m}~\text{s}^{-1}$) considering the gas contamination. Re-accelerated by the shock
 $\text{RS}_{2}$, the II and the OI slow down quickly and then evolve at nearly fixed radial positions, which indicates a negligible influence of the BP and RT effects on the late-time growth of instability. The movements of the interfaces and the waves obtained here provide a basic flow history of the shock–gas layer interaction, which facilitates analysis of the development of distorted layers. The time origin in this work is defined as the moment when the incident shock arrives at the mean position of the outer surface.
3.2 Perturbed light gas layer of different thickness
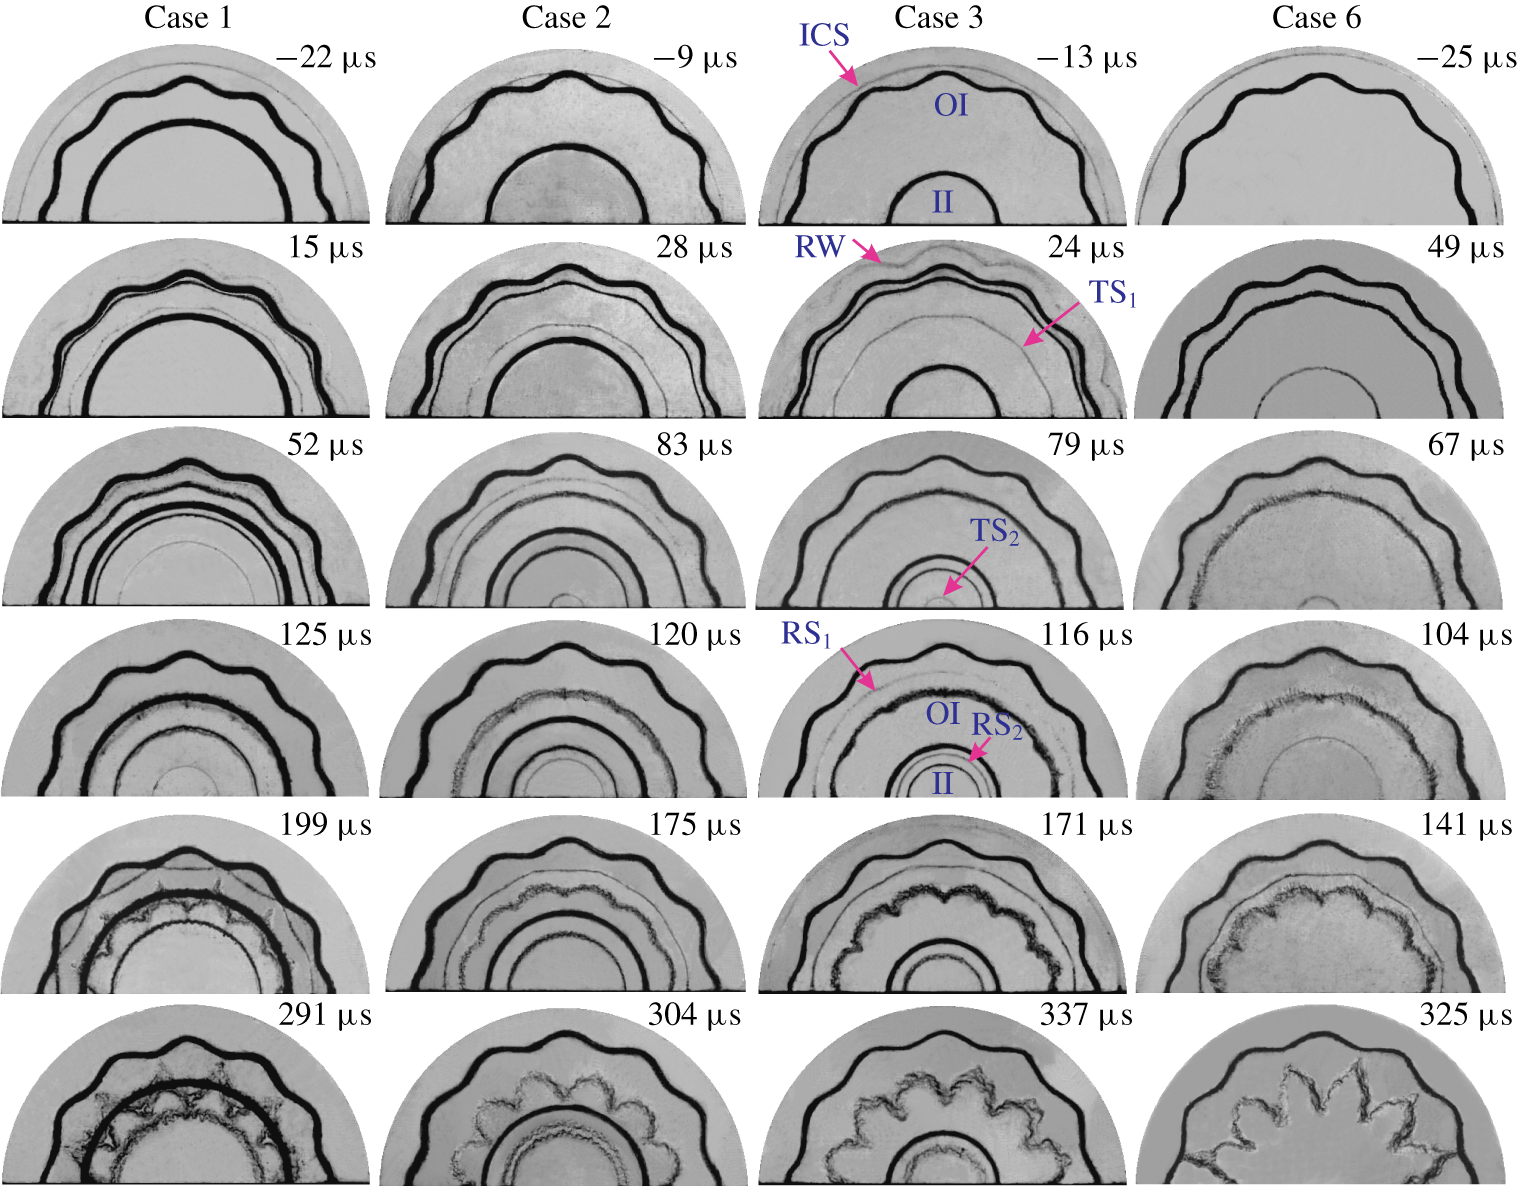
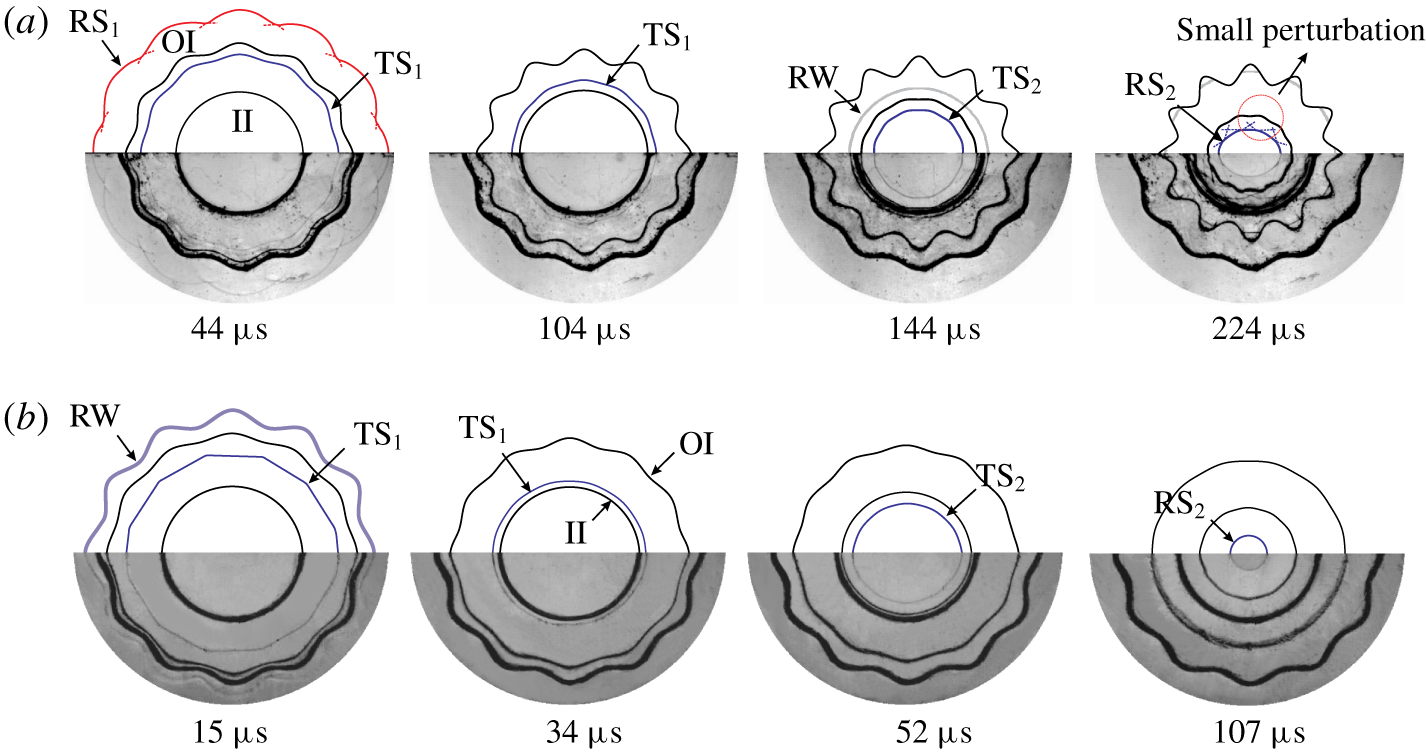
Typical schlieren images showing the evolution of the interfaces and the waves for perturbed layers of different thicknesses (Cases 1–3). A single-interface case (Case 6) is also given for comparison. Symbols are the same as those in figure 2.

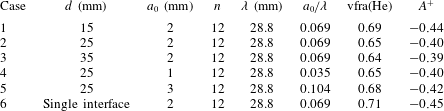
Parameters corresponding to the initial conditions for all cases. Note that Case 6 denotes the RMI at one sole interface.  $d=R_{0}^{o}-R_{0}^{i}$ is the layer thickness,
 $a_{0}$ and
 $\unicode[STIX]{x1D706}$ are, respectively, the initial perturbation amplitude and wavelength, vfra(He) is the helium volume fraction within the layer and
 $A^{+}$ is the post-shock Atwood number.

Three perturbed helium layers are then considered. For the three layers, the outer interface is located at a fixed position and the inner interface position is varied to change the layer thickness. Parameters corresponding to the initial conditions of three cases (Cases 1–3) are listed in table 1. Here  $n=12$ is adopted to ensure symmetric evolution of the interface in the semi-cylindrical geometry. Note that in our experiments it is very difficult to generate perturbed interfaces with
 $n>12$ because of the greater surface tension required. The discrepancy in helium concentration among different cases is within acceptable levels, which ensures a good repeatability of the present experiments. As shown in figure 3, the evolution processes for these cases are qualitatively similar, and we shall take Case 3 as an example to elucidate the layer evolution. As ICS passes across the single-mode outer interface, a distorted
 $\text{TS}_{1}$ together with an RW is immediately produced, and both present a sine wave-like shape. This indicates that initial distortions on the material interface can be transferred to the refracted waves during the shock–interface interaction. Later,
 $\text{TS}_{1}$ moves inwards, with its perturbation amplitude decaying continuously. Note that the propagation behaviour of
 $\text{TS}_{1}$ here is completely different from that in a heavy gas layer (Ding et al. Reference Ding, Li, Rui, Zhai and Luo2019), where the shock perturbation decays far more slowly and even grows in some situations (Schwendeman & Whitham Reference Schwendeman and Whitham1987). As
 $\text{TS}_{1}$ encounters the II, both
 $\text{RS}_{1}$ and
 $\text{TS}_{2}$ are generated. The shock
 $\text{RS}_{1}$ is indistinguishable in helium and becomes visible after it passes across the OI (
 $116~\unicode[STIX]{x03BC}\text{s}$). It is seen that the amplitude of
 $\text{TS}_{1}$ is nearly zero shortly before its collision with the II, and thus no evident perturbations are seeded on the II by the shock impact (
 $79~\unicode[STIX]{x03BC}\text{s}$). This differs greatly from the situation in heavy gas layers, where the distorted transmitted shock introduces visible perturbations on the II (Ding et al. Reference Ding, Li, Rui, Zhai and Luo2019).
Representative wave patterns and interfacial morphologies for (a) heavy and (b) light gas layers with the same geometric parameters. Symbols are the same as those in figure 2.

Typical wave patterns and interfacial morphologies for the shock–light gas layer interaction are depicted in figure 4(b), where the evolution of a heavy layer with the same initial shape is also given for comparison (figure 4a). It is seen that  $\text{TS}_{1}$ propagating in the heavy layer maintains evident distortion and then seeds visible perturbations on the II after their collision (
 $144~\unicode[STIX]{x03BC}\text{s}$). Nevertheless, for the light gas layer (figure 4b), the perturbation amplitude of
 $\text{TS}_{1}$ decays quickly, becoming almost zero before its contact with the II, and thus no evident perturbations are seeded on the II following the impact of
 $\text{TS}_{1}$. Such distinct propagations of
 $\text{TS}_{1}$ inside heavy and light layers are a primary reason for the different evolution of the two layers. Specifically,
 $\text{TS}_{1}$ inside the light layer is much weaker than that in the heavy layer, and thus much more easily recovers to an equilibrium state. Moreover, as suggested by Bates (Reference Bates2004), the perturbation of a rippled shock propagating in a light gas decays more quickly than that in heavy gas. Bates (Reference Bates2004) suggested that a rippled shock amplitude would decay with
 $\unicode[STIX]{x1D700}^{-3/2}$, where
 $\unicode[STIX]{x1D700}=(W_{s}-U)kt$ is a dimensionless factor,
 $W_{s}$ is the speed of the rippled shock,
 $U$ is the post-shock flow velocity and
 $k$ is the wavenumber. Since the convergence effect is weak for flows far away from the geometric centre, Bates’s theory can be used to approximately assess the propagation of
 $\text{TS}_{1}$ here. Considering that
 $\text{TS}_{1}$ has travelled a distance
 $d$ when it meets the II, the dimensionless factor at the time of interaction between
 $\text{TS}_{1}$ and the OI can be calculated as
 $$\begin{eqnarray}\unicode[STIX]{x1D700}=n(1-U/W_{s})(\ln R_{0}^{0}-\ln R_{0}^{i}).\end{eqnarray}$$
The quantities  $n$,
 $R_{0}^{0}$ and
 $R_{i}^{0}$ are identical for both layers, and
 $U/W_{s}$ equals 0.23 for the light layer, which is nearly half that for an SF
 $_{6}$ layer (0.4) (Ding et al. Reference Ding, Li, Rui, Zhai and Luo2019). Hence, the dimensionless factor for the present light layer (5.6) is much larger than that of a heavy layer (4.4) (Ding et al. Reference Ding, Li, Rui, Zhai and Luo2019), which indicates a faster decay of the shock perturbation here. At late stages, the inner surface experiences an evident deceleration before the reshock, as shown in the unperturbed case. For heavy gas layers, the inner interface is of a heavy/light configuration and thus the flow deceleration triggers an RT instability, which promotes the development of instability. Afterwards, the outgoing reflected shock (
 $\text{RS}_{2}$) re-accelerates the evolving interface, causing rapid growth of instability (figure 4a). In contrast, for light gas layers, the II is of a light/heavy configuration and thus the flow deceleration causes RT stabilization, which suppresses the growth of instability. Moreover,
 $\text{TS}_{2}$ in light gas layers presents a nearly perfect cylindrical shape when it approaches the geometric centre, and thus the diverging
 $\text{RS}_{2}$ generated is almost uniform (
 $107~\unicode[STIX]{x03BC}\text{s}$). It means that the subsequent reshock process (between
 $\text{RS}_{2}$ and the II) is the problem of a cylindrically diverging shock interacting with an almost uniform interface, and thus no instability arises. The above analyses reasonably explain the experimental observation that the inner interface of the helium layer remains undisturbed during the experimental time although the outer interface deforms greatly (figure 4b). The different physical processes for heavy and light gas layers are the main reasons for the distinct evolution of two layers. This finding suggests that light gas layers may be used as a buffer to mitigate hydrodynamic instability in ICF (Montgomery et al. Reference Montgomery, Daughton, Albright, Simakov, Wilson, Dodd, Kirkpatrick, Watt, Gunderson and Loomis2018).
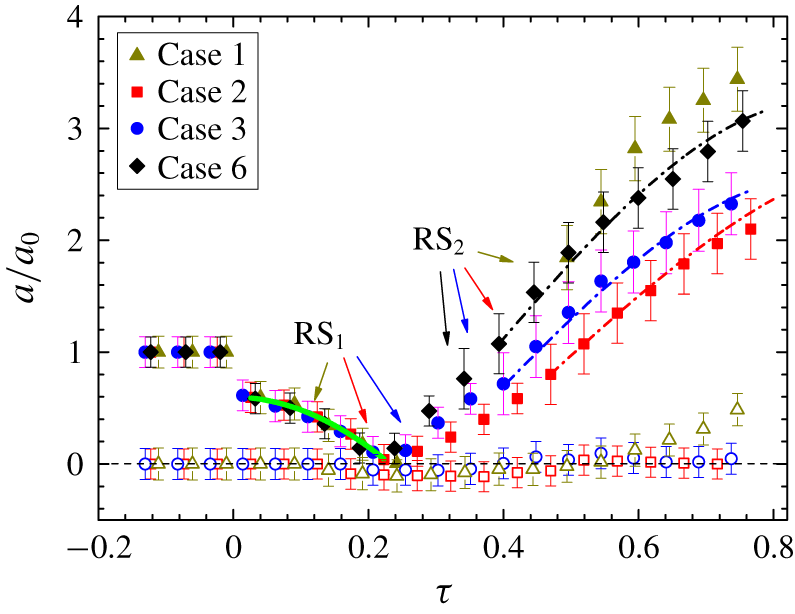
Dimensionless variations of the perturbation amplitude for both inner and outer interfaces versus time for Cases 1–3 are shown in figure 5. The time is normalized as  $\unicode[STIX]{x1D70F}=tV_{0}/R_{0}^{o}$, where
 $V_{0}$ is the jump velocity produced by the shock impact. As we can see, the distortion on the inner interface is almost zero during the time of interest, which supports the experimental observation. Here, we are mainly concerned with the outer interface development. After the shock impact, the perturbation amplitude of the outer interface first undergoes a sudden drop due to the shock compression and then decreases continuously due to the induction of baroclinic vorticity deposited on the outer interface (heavy/light). Later, the amplitude reduces to zero (
 $\unicode[STIX]{x1D70F}=0.24$), which indicates the occurrence of phase inversion. It is interesting that the phase inversion process here is unsteady, as indicated by the curved fitting line before
 $\unicode[STIX]{x1D70F}=0.24$. To the authors’ knowledge, such an ‘accelerated’ phase inversion is observed for the first time in convergent RMI experiments and is mainly ascribed to the geometric convergence (or BP) effect. It is known that the BP effect, which naturally increases (reduces) the perturbation of an inward-moving (outward-moving) interface, is proportional to the perturbation amplitude (Ding et al. Reference Ding, Si, Yang, Lu, Zhai and Luo2017). At an early stage of the phase reversal, when the perturbation amplitude is relatively larger, the BP effect is strong and greatly inhibits reduction of the perturbation. At late stages, when the perturbation amplitude is very small, the BP effect becomes weak, leading to an increasingly rapid phase reversal. After the phase inversion, the instability develops remarkably, resulting in a quick growth of the perturbation amplitude. Later, the outer interface is re-accelerated by
 $\text{RS}_{2}$ and presents a persistently rapid instability growth. As indicated in the unperturbed case, the outer interface evolves at a nearly fixed radial position after the reshock. Hence, the nonlinear theory of Liu et al. (Reference Liu, Yu, Ye, Wang and He2014), which assumes a fixed interface position in a cylindrical geometry, can be adopted to estimate the present instability growth. As shown in figure 5, the present results agree quite well with the theoretical prediction, which provides a direct demonstration of the model’s validity.
Temporal variations of the perturbation amplitudes of the outer (solid symbols) and inner interfaces (hollow symbols) for Cases 1, 2, 3 and 6. Time is scaled as $\unicode[STIX]{x1D70F}=tV_{0}/R_{0}^{o}$, where
 $V_{0}$ is the jump velocity produced by the shock impact. The solid line denotes the fitting of experimental data before the phase inversion and dash-dot lines give the nonlinear prediction of Liu et al. (Reference Liu, Yu, Ye, Wang and He2014).

To highlight the new physics introduced by two interfaces, an isolated single-mode air/helium interface (Case 6 in table 1) is also considered. The comparison between Cases 3 and 6 for the instability growth (figure 5) indicates that the presence of the inner interface of a gas layer produces an adverse effect for the development of the outer interface. Also, the growth in amplitude after reshock in Case 3 seems like a slight shift of the single-interface counterpart along the  $x$-axis. This is ascribed to the
 $\text{RS}_{1}$ arising from the shock–inner interface interaction re-accelerating the outer interface and hence postponing the phase reversal, causing a decay of subsequent perturbation growth after the phase inversion. When the inner and outer surfaces become closer (Case 2),
 $\text{RS}_{1}$ impacts the outer interface earlier and thus the perturbation growth after the phase reversal is delayed to a later time. To our surprise, when the layer thickness is reduced further to 15 mm (Case 1), the outer interface presents the fastest perturbation growth among all cases. The strong coupling effect between the nearby inner and outer interfaces in Case 1 is the primary reason for this. As has been demonstrated by Luo et al. (Reference Luo, Zhang, Ding, Si, Yang, Zhai and Wen2018), the convergence effect has only a minor influence on the early-stage evolution, and thus the coupling strength between the inner and outer interfaces of the present cylindrical shell can be approximately estimated by means of the coupling angle (
 $\unicode[STIX]{x1D6FC}$) proposed by Mikaelian (Reference Mikaelian1995):
 $$\begin{eqnarray}\sin \unicode[STIX]{x1D6FC}=(2W_{1}/W_{2})/[1+(W_{1}/W_{2})^{2}],\end{eqnarray}$$
 $$\begin{eqnarray}\displaystyle W_{1}/W_{2} & = & \displaystyle 1+\sinh (kd)\tanh (kd/2)\nonumber\\ \displaystyle & & \displaystyle +\,\sinh (kd)\frac{\unicode[STIX]{x1D70C}_{1}}{\unicode[STIX]{x1D70C}_{2}}\left\{1+\left[1+\left(\frac{\unicode[STIX]{x1D70C}_{_{2}}}{\unicode[STIX]{x1D70C}_{1}}\right)^{2}+2\left(\frac{\unicode[STIX]{x1D70C}_{2}}{\unicode[STIX]{x1D70C}_{1}}\right)\coth (kd)\right]^{1/2}\right\}.\end{eqnarray}$$
Here,  $k$ is the wavenumber, equal to
 $n/R$ for perturbation in a cylindrical geometry. Then, the perturbation growth rate for each interface of the gas layer can be expressed as
 $$\begin{eqnarray}{\dot{a}}^{o}=\frac{\unicode[STIX]{x0394}V\unicode[STIX]{x1D70F}^{2}}{\cos \unicode[STIX]{x1D703}}[a_{0}^{o}-a_{0}^{i}\sin \unicode[STIX]{x1D6FC}],\quad {\dot{a}}^{i}=\frac{\unicode[STIX]{x0394}V\unicode[STIX]{x1D70F}^{2}}{\cos \unicode[STIX]{x1D703}}[a_{0}^{i}-a_{0}^{o}\sin \unicode[STIX]{x1D6FC}],\end{eqnarray}$$
where  $\unicode[STIX]{x1D70F}^{2}=[k(\unicode[STIX]{x1D70C}_{2}/\unicode[STIX]{x1D70C}_{1}-1)]/[1+(\unicode[STIX]{x1D70C}_{2}/\unicode[STIX]{x1D70C}_{1})^{2}+2(\unicode[STIX]{x1D70C}_{2}/\unicode[STIX]{x1D70C}_{1})\coth (kd)]$,
 $\unicode[STIX]{x0394}V$ is the velocity jump produced by the shock impact and the superscript
 $o$ (
 $i$) denotes the outer (inner) interface. The coupling angles for Cases 1–3 are calculated to be 0.0218, 0.0026 and 0.0003, respectively. For Cases 2 and 3 with relatively larger thicknesses, the coupling angles are small, which indicates a very weak coupling effect. Although
 $\unicode[STIX]{x1D6FC}$ for Case 1 is relatively larger, the coupling effect is still too weak to influence the perturbation growth of each interface in the early stage (
 $\unicode[STIX]{x1D70F}<0.5$). Nevertheless, as the instability develops, the outer perturbation of the gas layer increases continuously, which makes the coupling effect increasingly strong (i.e. an increasing
 $a_{0}\text{sin}~\unicode[STIX]{x1D6FC}$ in (3.4)). This is the main reason for the faster growth of the outer perturbation than the single-interface case and the sudden rise of the inner perturbation after
 $\unicode[STIX]{x1D70F}=0.6$ for Case 1. The analysis here indicates that the evolution of gas layers with different initial configurations is dominated by different physical regimes.
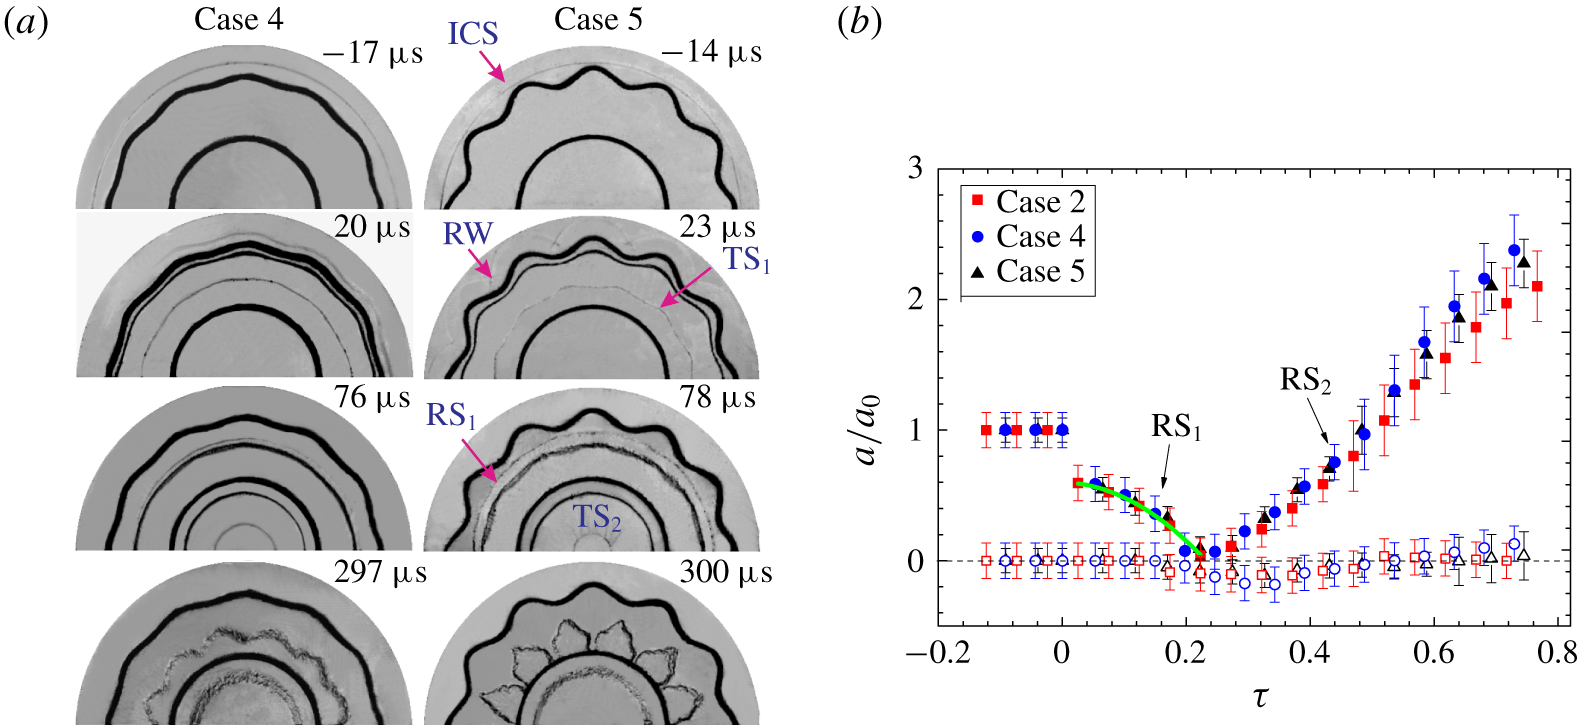
(a) Typical schlieren images showing the evolution of the interfaces and the waves and (b) dimensionless variations of the perturbation amplitude for the outer (solid symbols) and inner interfaces (hollow symbols) for Cases 2, 4 and 5. The solid line represents fitting of the amplitude variation before the phase inversion. Symbols are the same as those in figure 2.

3.3 Gas layers with different amplitudes of the outer interface
To investigate the dependence of instability growth on the initial outer perturbation amplitude, two additional helium layers (Cases 4 and 5) with their outer interface amplitudes different from that of Case 2 are examined. The initial parameters for Cases 4 and 5 are listed in table 1. Typical evolution of the interfaces and the waves for these cases is shown in figure 6(a). It is found that the larger the initial outer perturbation amplitude, the faster the instability growth at the outer interface. Also, the inner surface for Cases 2, 4 and 5 remains almost undisturbed during the time of interest, regardless of the large deformation of the outer interface. Interestingly, for Case 5, the bubble of the outer interface presents a spike-like structure ( $300~\unicode[STIX]{x03BC}\text{s}$), which is similar to the theoretical result of Wang et al. (Reference Wang, Wu, Ye, Zhang and He2013) considering the RT instability. Such a special bubble structure may be caused by the unique growth of high-order harmonics in a convergent geometry. Normalized variations of the perturbation amplitude versus time are plotted in figure 6(b). The data for three cases collapse quite well. The present findings suggest that for ICF capsule design, controlling the material density and the thickness of the central shell is more effective than smoothing the capsule surface to mitigate the hydrodynamic instability there.
4 Conclusions
In this work, the interaction of a cylindrically converging shock with a helium layer (sinusoidal outer surface and uniform inner surface) surrounded by air has been examined by shock-tube experiments. An extended soap film technique is adopted to generate light gas layers with a controllable shape. Evolution of the waves and the interfaces is captured well by a high-speed schlieren system.
Different from the case of heavy gas layers, where an evident instability arises at the inner interface, the inner surface of light gas layers remains almost undisturbed during the experimental time, regardless of the layer thickness and the outer interface amplitude. Three main factors are responsible for this. First, the transmitted shock is imprinted by the outer interface perturbation after the interaction, but recovers quickly to be nearly uniform before its collision with the inner surface when propagating in the helium layer. Hence, no evident perturbations are seeded on the inner interface during passage of the shock. Second, the inner interface of the light gas layer is of a light/heavy configuration, and thus interface deceleration before the reshock triggers RT stabilization, which inhibits development of instability. Third, the subsequent reshock process on the inner interface is the problem of a perfect diverging shock interacting with a cylindrically uniform interface, which produces no additional instability. This distinct phenomenon suggests that using a light layer as a buffer is an effective way to mitigate hydrodynamic instability in ICF.
Accelerated by the incident shock, the outer interface first undergoes an ‘accelerated’ phase inversion and then suffers a continuous deformation. Note this unsteady phase inversion is first observed in convergent RMI experiments and is mainly attributed to geometric convergence effect. The nonlinear model of Liu et al. (Reference Liu, Yu, Ye, Wang and He2014) provides a reasonable prediction of the post-reshock outer perturbation growth. In comparison with the evolution of an isolated interface, the inner interface of a light gas layer (Cases 2 and 3) produces an adverse effect for development of the outer interface due to the influence of waves arising from the interaction between the shock and the inner interface. Nevertheless, as the interface becomes very close (Case 1), the outer interface presents the fastest growth in perturbation among all cases, due to the strong coupling effect.
Acknowledgements
This work was supported by the National Natural Science Foundation of China (nos 11625211, 11802304, 11722222 and 11621202), the Science Challenge Project (no. TZ2016001), the Strategic Priority Research Program of the Chinese Academy of Sciences (no. XDB22020200) and the CAS Center for Excellence in Complex System Mechanics.