Introduction
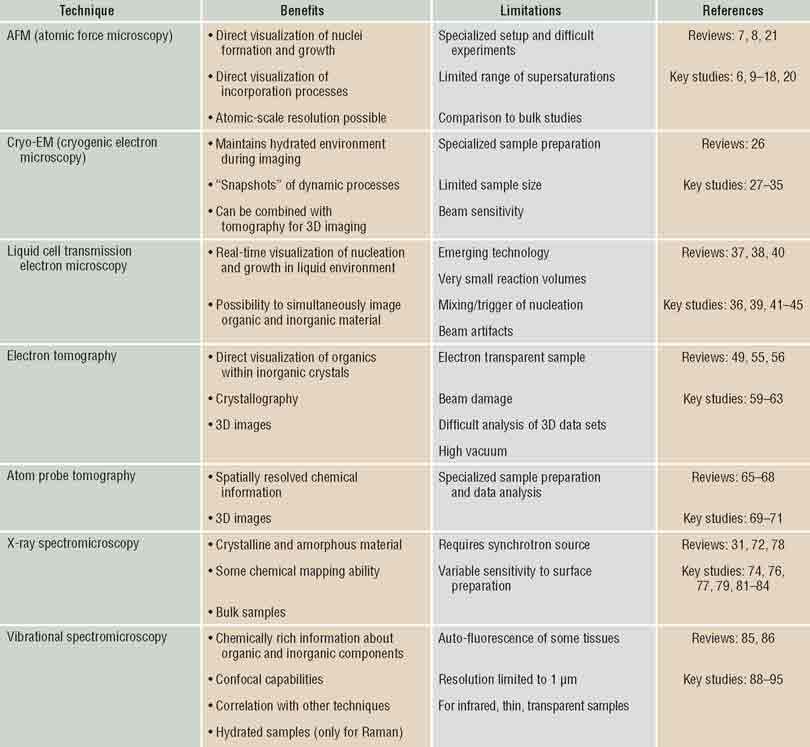
One of the universal characteristics of biomineralizing systems is that macromolecular constituents, such as proteins and polysaccharides, are found in close association with mineral constituents.Reference Lowenstam and Weiner1, Reference Dove, De Yoreo and Weiner2 Some of these organic components are water soluble, but others assemble to create an insoluble scaffold within which the minerals form. This intimate relationship between the matrix and mineral, along with the unusual morphologies of biominerals and the common occurrence of metastable mineral phases, suggests that the organic matrix actively controls mineral nucleation and growth. Moreover, significant quantities of the organic matrix are typically occluded within the resulting hierarchically structured tissuesReference Asenath-Smith, Li, Keene, Seh and Estroff3 (discussed further by Schenk and Kim in this issue of MRS Bulletin). This composite architecture endows biominerals with remarkable mechanical properties and, as a result, during the past few decades, biomineral systems have inspired developments in materials synthesis of new composite materials.Reference Nudelman and Sommerdijk4, Reference Arakaki, Shimizu, Oda, Sakamoto, Nishimura and Kato5 However, truly emulating biological processes for novel material creation has yet to be fully realized, because both the mechanisms by which the macromolecular matrix assembles and mineralizes and the principles underlying the structure–function relationships of mineralized tissues are poorly understood. Recent advances in the application of microscopy techniques to define both the processes of matrix assembly and mineralization and the hierarchical distribution of the matrix and mineral are beginning to fill the gaps in our understanding of both formation and properties. Here we review some of these advances, using examples from biological as well as bioinspired systems to illustrate the insights they have enabled. Table I provides a summary of the microscopy techniques discussed, including their benefits and limitations within the scope of analyzing biominerals and bioinspired systems.
Summary of discussed techniques.

Visualizing matrix assembly and mineral formation
What mechanisms and energetic factors control nucleation and growth?
In recent years, investigations of matrix assembly and mineralization have been performed to better understand the in vivo mechanisms that control these processes. In situ methods have been particularly important, because dynamic behavior occurs in response to differences in energy states and the barriers that separate those states; thus, such studies provide an opportunity to probe the energy landscape across which matrix assembly and mineralization take place. For both processes, the important length scales range from the molecular scale to tens of nanometers. Consequently, atomic force microscopy (AFM) and transmission electron microscopy (TEM) have been the most significant techniques used, though the information gained is typically augmented with other types of data, both in situ and ex situ.
In situ AFM: Real-time imaging of assembly processes on surfaces
AFM is a type of scanning probe microscopy that uses a sharp tip on the end of a cantilever to sense changes in sample topography. When the tip is brought within the range of the interatomic potential between the tip and surface, variations in the potential with position lead to vertical deflections of the cantilever. Thus, the topography of the surface can be mapped by measuring the deflection of cantilever as the tip is raster-scanned over the surface. Typically, this deflection is measured by reflecting a laser from the top of the cantilever onto a photodiode array, giving a vertical resolution of less than an Angstrom.
AFM can be applied to organic matrices and mineral surfaces exposed to fluid, which is either static or flowing.Reference Franz and Muller6–Reference Rashkovich, De Yoreo, Orme and Chernov8 Consequently, it enables direct observations of matrix assembly on substrates,Reference Cisneros, Hung, Franz and Muller9–Reference Narayanan, Gilmer, Tao, De Yoreo and Ciobanu11 mineral nucleation on organic matrices,Reference Habraken, Tao, Brylka, Friedrich, Bertinetti, Schenk, Verch, Dmitrovic, Bomans, Frederik, Laven, van der Schoot, Aichmayer, de With, De Yoreo and Sommerdijk12, Reference Hamm, Giuffre, Han, Tao, Wang, De Yoreo and Dove13 and post-nucleation growth and interaction with organic constituents.Reference De Yoreo7, Reference Rimer, An, Zhu, Lee, Goldfarb, Wesson and Ward14–Reference Friddle, Weaver, Qiu, Wierzbicki, Casey and De Yoreo18 These measurements can be complemented by a number of other techniques to obtain a comprehensive picture of chemical interactions, energetic drivers, and mechanisms of formation. The first, cryogenic electron microscopy (cryo-EM), is a form of TEM in which a sample of solution is frozen so rapidly in liquid N2 or liquid ethane that it forms a thin layer of vitrified water. Cryo-EM enables the observation of specimens in their native environment without any staining or fixation, thus providing high-resolution structural information. The second, in situ dynamic force spectroscopy (DFS), is a special application of AFM that records the force required to break the bond between a functionalized AFM tip and surface. When this rupture force is measured as a function of the bond extension rate, the resulting relationship provides characteristic parameters of the intermolecular and mineral–matrix bonds, such as the binding free energy per molecule. Vibrational and electronic spectroscopy can be used to reveal the functional groups responsible for observed changes in free energies and barriers, and molecular simulations can be employed to test proposed mechanisms and determine underlying structural reasons for the dominant interactions.
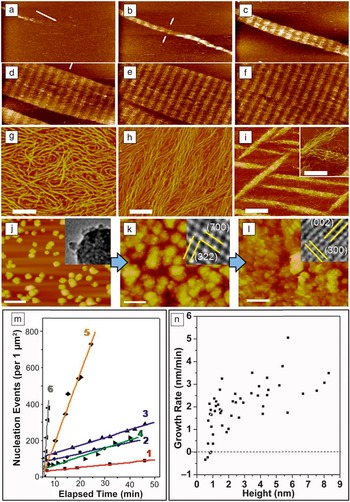
AFM has been used to investigate the assembly of protein matrices by introducing aqueous solutions of protein into a sample chamber referred to as a fluid cell, which contains substrates that promote assembly.Reference Cisneros, Hung, Franz and Muller9, Reference Chung, Shin, Bertozzi and De Yoreo10 In vivo, collagen molecules, which form the organic matrix of bone, align and intertwine to form microfibrils containing “hole zones,” where there are gaps between the N- and C-termini of successive collagen molecules.Reference Orgel, Irving, Miller and Wess19 Observations of collagen assembly on mica revealed formation of ordered fibrils via two distinct steps that resulted in the same periodicity observed in collagen fibrils formed in vivo (Figure 1a–f).Reference Cisneros, Hung, Franz and Muller9 First, three single strand collagen molecules associated with one another to form 1.5 nm-high triple-helices called tropocollagen molecules. These then assembled into ordered, 3 nm-high microfibrils, which formed the building blocks of larger scale fibrils. Other studies recorded development of alternative architectures that depended strongly on the choice of pH and salt concentration (Figure 1g–i). For example, while the ordered structure seen in Figure 1a–f is obtained at pH 9.0 for K+ concentrations of 200 mM and above, at pH 4.0 the architecture evolves from a monolayer of randomly oriented molecules to a monolayer of co-aligned molecules to three-dimensional (3D) bundles of co-aligned molecules as the K+ concentration is increased 100–300 mM.Reference Narayanan, Gilmer, Tao, De Yoreo and Ciobanu11 Comparing the in situ results with coarse-grained molecular models of assembly provided insights into the energetic underpinnings of collagen architecture.Reference Narayanan, Gilmer, Tao, De Yoreo and Ciobanu11 Predictions based on variations of the relative strengths of the inter-collagen and collagen-substrate binding through a periodic set of strong and weak inter-collagen binding sites provided the observed evolution in collagen architecture.
In situ atomic force microscopy (AFM) can be used to investigate matrix self-assembly and mineralization. (a–f) Self-assembly of Type I collagen on mica into an ordered array with a periodicity of 67 nm found in natural collagen. Times (min) are: (a) 12.9, (b) 25.8, (c) 43.0, (d) 55.9, (e) 60.2, and (f) 77.4. (g–i) Architecture of collagen on mica at pH 4.0 for K+ concentrations (mMol) of (g) 100, (h) 200, and (i) 300. (j–l) Nucleation of calcium phosphate on collagen at a solute concentration above the amorphous calcium phosphate (ACP) solubility limit. (j) ACP at 24 min transforms to octacalcium phosphate at 64 min (k) and then hydroxyapatite (HA) at 98 min (l). Time zero corresponds to the moment solution injected into AFM the fluid cell. Insets show transmission electron microscopy images collected on samples taken from the three stages of development. (m) Dependence of nucleation rate on time at six different supersaturations σi. Analysis of the data gives interfacial energies αi of αACP = 40 mJ • m–2 and αHA = 90 mJ • m–2. (n) Relationship between growth rate and particle height on surface of collagen with σHA = 3.31, σOCP = 1.71, σACP = –0.02. A critical size of 0.7 nm is determined from the zero crossing of the average growth rate (dashed line) All scale bars are 200 nm except in (i) where it is 500 nm in the main image only. (a–f) Adapted and reprinted with permission from Reference 9. © 2006 Elsevier. (g–l) Reprinted with permission from Reference 12. © 2013 Macmillan.
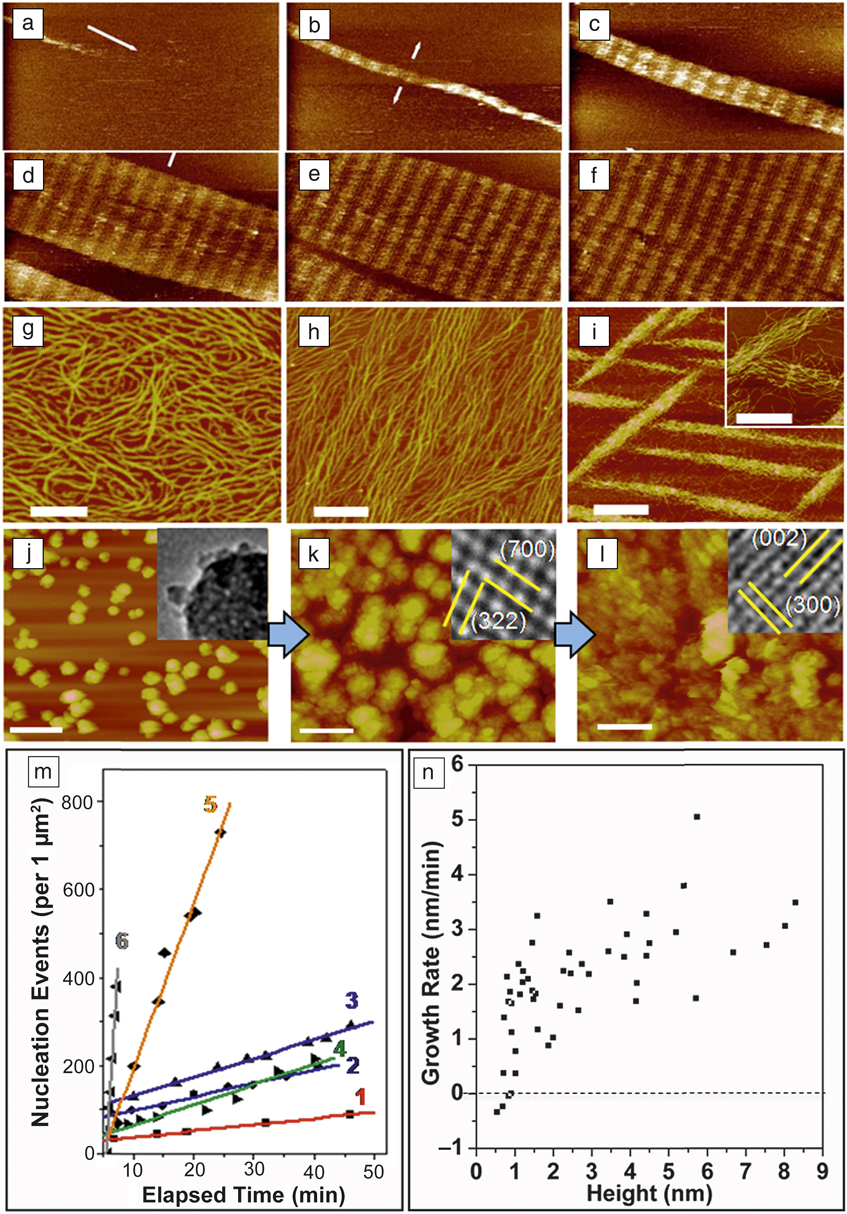
Mineral nucleation on organic matrices can also be visualized by AFM.Reference Habraken, Tao, Brylka, Friedrich, Bertinetti, Schenk, Verch, Dmitrovic, Bomans, Frederik, Laven, van der Schoot, Aichmayer, de With, De Yoreo and Sommerdijk12, Reference Hamm, Giuffre, Han, Tao, Wang, De Yoreo and Dove13 Organic matrices are first assembled on flat substrates. Aqueous solutions of the mineral phase are then passed through the fluid cell, and formation of mineral nuclei is observed (Figure 1j–l). If the nucleation process is arrested by switching from flow of reagents to a liquid in which the mineral has no solubility, such as alcohol, the sample can be collected and analyzed by TEM or Raman spectroscopy to determine the mineral phase at a single point in time.Reference Habraken, Tao, Brylka, Friedrich, Bertinetti, Schenk, Verch, Dmitrovic, Bomans, Frederik, Laven, van der Schoot, Aichmayer, de With, De Yoreo and Sommerdijk12 The use of DFS to measure the binding energy of the protein to single crystal substrates of the mineral allows one to correlate the interfacial energy with matrix-mineral binding free energy.Reference Hamm, Giuffre, Han, Tao, Wang, De Yoreo and Dove13,Reference Tao, Battle, Pan, Salter, Chien, Wierzbicki and De Yoreo20,Reference De Yoreo, Chung and Friddle21
In bone, nonstoichiometric hydroxyapatite (Ca10(PO4)6(OH)2; HA) crystals form within a highly organized matrix of collagen.Reference Weiner and Wagner22 There is an ongoing debate regarding the nucleating potential of collagen fibrils in the absence of any other proteins.Reference Landis and Silver23–Reference Olszta, Cheng, Jee, Kumar, Kim, Kaufman, Douglas and Gower25 Recently, AFM measurements of heterogeneous calcium phosphate nucleation rates on collagen showed that solutions stable for days in the absence of collagen produced nuclei in hours or less on collagen matrices.Reference Habraken, Tao, Brylka, Friedrich, Bertinetti, Schenk, Verch, Dmitrovic, Bomans, Frederik, Laven, van der Schoot, Aichmayer, de With, De Yoreo and Sommerdijk12 At supersaturations below the solubility limit of amorphous calcium phosphate (ACP), hydroxyapatite (HA) formed directly, but when the concentration was raised to slightly above the solubility limit of ACP, the amorphous phase formed first (Figure 1j) before transforming to octacalcium phosphate (Ca8H2(PO4)6 • 5H2O; OCP) (Figure 1k) and, finally, HA (Figure 1l). Analysis of nucleation rates (Figure 1m) gave interfacial energies two to three times less than those estimated for homogeneous nucleation and barriers that were smaller by more than an order of magnitude. Analysis of the size distribution of particles that, on average, grew versus those that dissolved (Figure 1n), provided an estimate of the critical nucleus size. However, neither the change from HA nucleation to ACP nucleation nor the small values of critical size could be understood within classical nucleation theory. Comparison to cryo-EM and titration analyses revealed a formation pathway involving assembly of multi-ion complexes, which offered a rationale for the unexpected formation of ACP precursor particles and the low value of the critical size.
Cryo-EM and tomography: High-resolution, three-dimensional imaging of hydrated samples
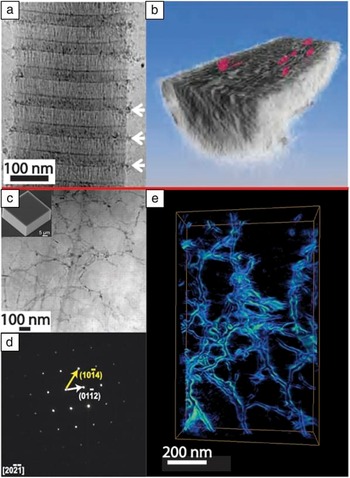
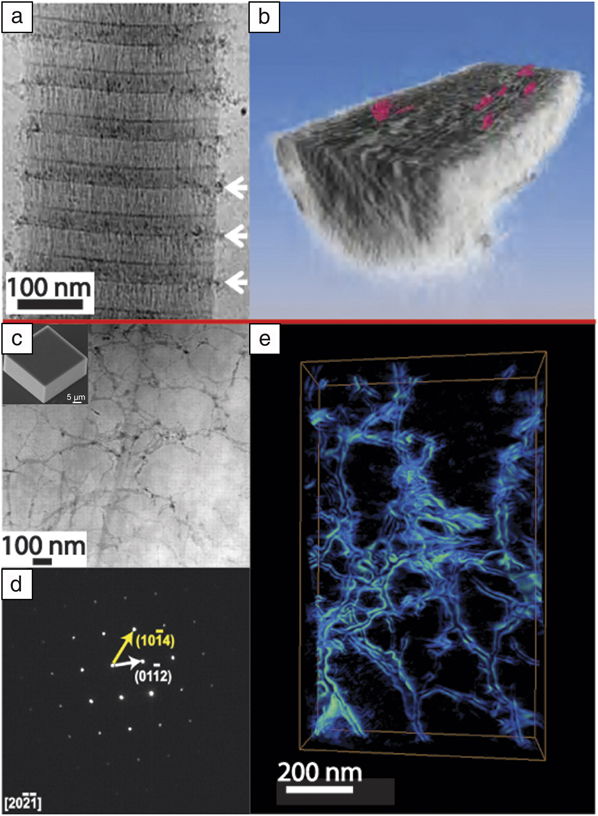
Cryo-EM techniquesReference Nudelman, de With and Sommerdijk26 can provide insights into tissue structures at close to native state.Reference Quan and Sone27, Reference Sone, Weiner and Addadi28 They also can be used to provide quasi-time-resolved studies of nucleation and growth processes.Reference Pichon, Bomans, Frederik and Sommerdijk29–Reference Fang, Margolis, Conway, Simmer and Beniash33 These studies can complement in situ AFM studies and provide a more detailed picture of mineralization occurring within an organic matrix. For example, cryo-EM studies of synthetic intrafibrillar HA formation in collagen fibrils revealed the early stages of infiltration of ACP particles at the hole zones in the fibrils (Figure 2a–b).Reference Nudelman, Pieterse, George, Bomans, Friedrich, Brylka, Hilbers, de With and Sommerdijk34 Cryo-EM tomography of the fully mineralized fibrils revealed embedded nm-thick plate-shaped HA crystals with their c-axis parallel to the fibril axis. Similar cryo-EM approaches have been taken to study other composite systems such as calcium carbonate nucleation under Langmuir–Blodgett monolayers.Reference Pichon, Bomans, Frederik and Sommerdijk29, Reference Pouget, Bomans, Goos, Frederik, de With and Sommerdijk35 In these studies, amorphous calcium carbonate (ACC) forms and then transforms to either calcite (in the absence of the monolayer) or vaterite and then calcite (with the monolayer present) by dissolution/reprecipitation.Reference Pichon, Bomans, Frederik and Sommerdijk29
(a–b) Cryogenic electron microscopy yields insights into the mineralization of hydrated samples. (a) Cryo-transmission electron microscopy of a collagen fibril (from horse tendon) with amorphous calcium phosphate particles collecting near the hole regions of the collagen (white arrows) after mineralization for 24 hrs in buffered CaCl2, KPO4, and 10 μg/mL of pAsp. (b) Tomographic reconstruction of the fibril after the apatite has been fully crystallized (72 hrs in buffered solution) reveals platelets (colored red) of mineral within the fibril itself. (c–e) Electron microscopy and tomography reveal details of incorporated macromolecular additives. (c) Annular dark field (ADF)-scanning transmission electron microscopy (STEM) of a thin section of a calcite crystal (scanning electron microscopy, inset) grown in a 1 w/v% agarose gel. Despite the well-developed rhombohedral crystal, agarose gel fibers are clearly visible (darker contrast) and randomly distributed within the thin section. (d) Selected-area electron diffraction of the area imaged in (c) demonstrating that the gel-grown crystal diffracts electrons as a single crystal. (e) ADF-STEM tomographic reconstruction of an area similar to (c), which emphasizes the network of agarose fibers incorporated within the crystal. (a–b) Adapted and reprinted with permission from Reference 34. © 2010 Macmillan. (c–d) Adapted with permission from Reference 63. © 2009 AAAS.
In situ TEM: Direct observation of nucleation in bulk solutions and within organic matrices
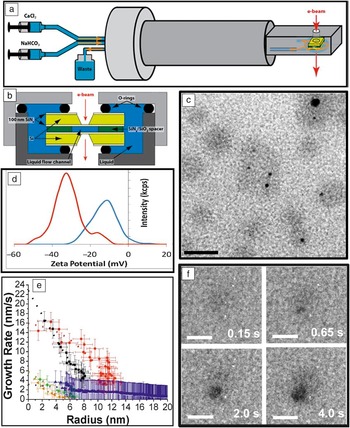
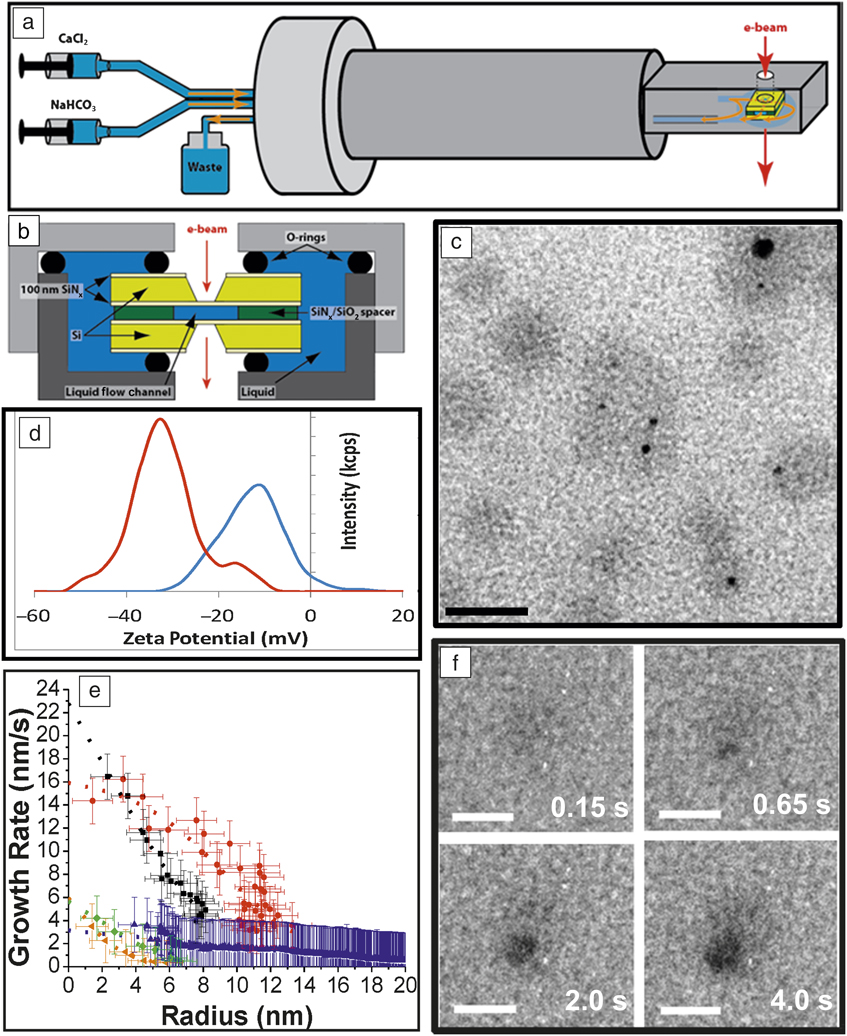
When nucleation occurs in bulk solution or within a biomimetic matrix, AFM cannot be used to observe the nucleation process. In situ liquid phase TEM provides a novel technique in these instances.Reference Williamson, Tromp, Vereecken, Hull and Ross36–Reference Nielsen, Li, Zhang, Aloni, Han, Frandsen, Seto, Banfield, Cölfen and De Yoreo41 A sealed liquid cell on a specialized TEM holder (Figure 3a–b) allows for mixing reagents at the entrance to the cell and flow of the mixture through the cell.Reference Nielsen, Aloni and De Yoreo42 Alternatively, the cell can be filled with one reagent through one of the two flow lines, and the second reagent can be introduced by gaseous diffusion through the second line.Reference Smeets, Cho, Kempen, Sommerdijk and De Yoreo43 To observe nucleation within a macromolecular matrix, the macromolecules are added to one of the two reagents and transferred into the cell prior to introduction of the second reagent. The appearance of mineral nuclei and the spatial relationship to an organic matrix can then be observed by TEM imaging. Electron diffraction is used to determine the phase of the mineral and its evolution. Low-dose methods, beam shuttering, and examination of regions not previously exposed to the beam are required to separate electron beam effects from intrinsic phenomena.Reference Woehl, Evans, Arslan, Ristenpart and Browning44, Reference Zhang, De Yoreo and Banfield45
In situ liquid phase transmission electron microscopy (TEM) enables observation of a nucleation and phase evolution for both mineral and organic components. Schematic of (a) TEM liquid cell holder and a (b) liquid cell. (c) Globules (gray) formed through Ca2+ counterion condensation on polystyrene sulfonate (PSS), some containing newly formed amorphous calcium carbonate (ACC) particles (black). (d) Zeta potential showing shift to more positive values due to Ca2+ binding to PSS to form globules (red—pure CaCl2 solution, blue—CaCl2 solution containing PSS). (e) Growth rates of vaterite particles (orange, green, blue) formed in the absence of PSS and ACC particles (black and red) within Ca-PSS globules. (f) Time series showing ACC nucleation and growth within a globule. In the absence of PSS, vaterite forms randomly (not shown). Scale bars: (c) 50 nm, (f) 20 nm. (a–b) Adapted and reprinted with permission from Reference 42. © 2014 AAAS. (c–f) Adapted and reprinted with permission from Reference 43. © 2015 Macmillan.
Liquid phase TEM was used to observe calcium carbonate (CaCO3) nucleation both in organic-free solutionsReference Nielsen, Aloni and De Yoreo42 and in the presence of an organic matrix.Reference Smeets, Cho, Kempen, Sommerdijk and De Yoreo43 Results on pure solutions produced by mixing two aqueous reagents demonstrated that multiple nucleation pathways can be simultaneously operative, including formation both directly from solution and indirectly through transformation of initially formed amorphous or crystalline precursors.Reference Nielsen, Aloni and De Yoreo42 When crystalline phases formed as secondary phases through transformation of primary ACC, the secondary nuclei appeared at the surface of the ACC particles and remained in direct contact until the ACC was consumed. When ACC dissolution was induced, the observed behavior suggested ACC comprises a spectrum of structures ranging from dense liquids to solids.
To investigate the role of macromolecular matrices in directing mineralization, liquid phase TEM was also used to observe the nucleation and growth of CaCO3 in the presence of poly(styrene sulfonate) (PSS).Reference Smeets, Cho, Kempen, Sommerdijk and De Yoreo43 This acidic macromolecule was chosen to mimic the polysaccharides believed to be important in the formation of certain marine biominerals.Reference Addadi, Moradian, Shay, Maroudas and Weiner46–Reference Schenk, Zlotnikov, Pokroy, Gierlinger, Masic, Zaslansky, Fitch, Paris, Metzger, Cölfen, Fratzl and Aichmayer48 In the PSS-free system, the configuration used for these experiments led to random nucleation with vaterite, a metastable CaCO3 polymorph, being the dominant phase. When PSS was first introduced in the CaCl2 reagent, calcium binding to the polymer resulted in formation of Ca-PSS globules with an average diameter of approximately 10 nm (Figure 3c). These observations were complemented by titration calorimetry, which showed that more than 50% of the Ca2+ ions were complexed by PSS, zeta potential measurements (Figure 3d), and in situ Fourier transform infrared spectroscopy, which demonstrated that the Ca2+ ions bound to the sulfate groups. Upon introduction of carbonate, ACC particles nucleated first, but only formed within the globules (Figure 3c–f). Vaterite appeared at much later times but only formed outside of the globules. Both phases grew at diffusion-limited rates (Figure 3e), from which the supersaturation at the time of nucleation could be determined. The findings demonstrated that ion binding can play a significant role in directing nucleation, independent of any control over interfacial free energy, and the acidic polymers redirect the nucleation pathway to ACC formation.
Macromolecular inclusions in biominerals and bioinspired materials
How are large additives incorporated into crystalline lattices?
Understanding the internal structure of biominerals, and the interactions between biomacromolecules and growing inorganic crystals, is of great interest for developing bioinspired synthetic materials with improved property profiles, as discussed in more detail in the article by Schenk and Kim in this issue of MRS Bulletin. One outstanding challenge is the compositional and structural characterization of hierarchically structured, hydrated, biomineralized tissues, which typically have significant quantities of organics, arranged nonperiodically within crystalline matrices. While in situ techniques provide insights into the very early stages of crystal nucleation and growth, due to sample size limitations of AFM fluid cells and in situ TEM, the final product cannot be structurally characterized. Additionally, for biological tissues, often only the final mineral product is available since we currently cannot image the formation processes in vivo.
Fortunately, in recent years, advanced characterization techniques have provided unprecedented resolution of the internal structure of biominerals and unique insights into the mechanisms of formation of these structures. The most useful techniques enable simultaneous imaging of the organic and inorganic components, with nanometer-scale resolution, and, when possible, chemically rich information.
Electron tomography: 3D structural information
Electron microscopy, in particular scanning TEM (STEM), is well-suited to simultaneously imaging organic and inorganic components with nanometer-scale resolution.Reference Sousa and Leapman49 In addition, local crystallographic information can be obtained by selected-area electron diffraction (SAED), and, where possible, high-resolution lattice imaging can provide additional insight into crystal structure.Reference Kabalah-Amitai, Mayzel, Kauffmann, Fitch, Bloch, Gilbert and Pokroy50 Immunogold labeling can be used in conjunction with TEM to visualize the locations of specific proteins within a tissue sample.Reference Osuna-Mascaró, Cruz-Bustos, Benhamada, Guichard, Marie, Plasseraud, Corneillat, Alcaraz, Checa and Marin51–Reference Seto, Zhang, Hamilton and Wilt54 Briefly, small (<10 nm) gold nanoparticles are functionalized with antibodies and allowed to bind to target proteins within tissue thin sections. The high electron density of the gold nanoparticles facilitates imaging by TEM.
More recently, electron tomography, in which a series of images of the sample are taken at varying tilt angles with respect to the electron beam and reconstructed into a 3D image of the sample,Reference Midgley and Weyland55, Reference Leary, Midgley and Thomas56 has emerged as a technique for obtaining additional spatial information about the distribution of organic inclusions within biominerals. Energy dispersive spectroscopy (EDS) and electron energy-loss spectroscopy (EELS) can provide additional chemical information about the samples, but both techniques require high accelerating voltages. One of the main challenges in performing these types of experiments on biomineralized tissues is that samples must be electron transparent, which often requires thinning the samples via focused ion beam (FIB) milling. As alternatives to FIB, other techniques can be used to obtain ultrathin sections such as cutting with a cryo-ultramicrotome or wedge polishing hard tissue samples.Reference Tao, Battle, Pan, Salter, Chien, Wierzbicki and De Yoreo20, Reference Voyles, Grazul and Muller57 Additionally, beam damage can be a problem for samples with high organic content, as it can introduce imaging artifacts such as amorphization of crystalline regions, crystallization of amorphous regions, and destruction of organic regions.
Mollusk shells are a model biomineral that have been extensively studied due to their dramatically higher hardness and fracture toughness as compared to geologic minerals.Reference Kunitake, Mangano, Peloquin, Baker and Estroff58 Electron microscopy and tomography have revealed details regarding the incorporation of biomacromolecules within the CaCO3 single crystals that make up both the prismatic (calcitic) and nacreous (aragonitic) layers.Reference Li, Xin, Kunitake, Keene, Muller and Estroff59–Reference Okumura, Suzuki, Nagasawa and Kogure61 In all of these studies, a common picture emerges of single-crystal components (from SAED) with nanoscale inclusions, which are often arranged along preferred crystallographic orientations (from electron tomography). In another study, a combination of annular dark field STEM, electron tomography, SAED, and EELS were used to analyze the remarkably structured calcite building blocks of coccolithophores (single-celled algae).Reference van de Locht, Slater, Verch, Young, Haigh and Kröger62
Inspired by biominerals such as mollusk shells, there have been several recent studies on the incorporation of nanoscale aggregates of organic macromolecules into synthetic single crystals of calcite (see Schenk and Kim article for additional discussion).Reference Li, Xin, Muller and Estroff63, Reference Kim, Ganesan, Yang, Kulak, Borukhin, Pechook, Ribeiro, Kröger, Eichhorn, Armes, Pokroy and Meldrum64 The internal structure of calcite crystals grown within an agarose gel was revealed by electron tomography (Figure 2c–e). Similar to biogenic crystals, the presence of nanoscale gel fibers within the crystal did not appear to disrupt the local crystalline structure. Even more interestingly, the cavities in which the fibers were encased appeared to be faceted and contained high-energy homocharged {012} facets as well as the expected {104} cleavage planes.
These studies emphasize the power of electron tomography for revealing the internal structure of biominerals and bioinspired crystals. What these static techniques cannot capture, however, are the mechanisms by which the organic macromolecules become trapped within the crystals without significantly disrupting the lattice. Future studies will aim to apply AFM, cryo-EM, or liquid cell TEM to visualize the growth of crystals in the presence of these nanoscale additives.
Atom probe tomography: Spatially resolved chemical information at the nanoscale
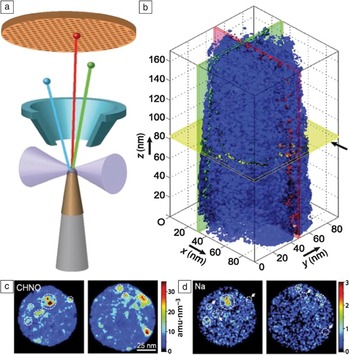
Atom probe tomography (APT) offers both 3D imaging and chemical composition measurements at the atomic scale (around 0.1–0.3 nm resolution in depth and 0.3–0.5 nm laterally).Reference Seidman65, Reference Miller and Forbes66 This technique is currently the only way to chemically map inclusions in biominerals, in detail, at the nanoscale. Using FIB and nanomanipulators, needle-shaped samples are milled and mounted to a Si post array. A pulsed ultraviolet laser sequentially triggers field evaporation of single atoms or small clusters from the surface of the tip. The resulting ions are projected onto a position sensitive detector (PSD), and their time-of-flight, and thus chemical identity is determined. The detector simultaneously measures: (1) the time between the laser flash and the arrival on the PSD to determine the mass to charge ratio of the ions and (2) the x–y position and the order of arrival of the ions on the PSD to reconstruct the original position of the atoms in the sample. By repeating this operation, the atoms are progressively removed from the sample, and a 3D image of the material can be reconstructed at the atomic scale (Figure 4a). The small size of the sample, however, limits the overall image size and since the ejected organic fragments tend to be larger than single ions, the resolution of their location is slightly reduced. Though this technique was originally developed for studies of metals and semiconductors, recent advancements have made studies of composite and biological materials possibleReference Miller and Forbes66–Reference Marquis, Bachhav, Chen, Dong, Gordon and McFarland68 and, despite challenges, the results reported so far are groundbreaking.
(a) Schematic of an atom probe tomography experiment in which the sample is ablated by a laser (forming ions) onto a mass spectrometer to determine the type of atoms within the removed section. (b) Tomographic reconstruction of an elephant dentin sample shows the isosurface for the organic fragment number density (blue surface is the threshold for dense organic) revealing fibers aligned along the z-axis. (c–d) Selected sections from the reconstruction in (b) with mass density for organic fragments (c) and Na+ (d) locations shown. The highest density regions for each are often, but not exclusively, the same, which implies that something in the organic macromolecules may bind the ions. Scale for (c) and (d) are the same as the (b) x–y plane. Adapted and reprinted with permission from Reference 70. © 2012 ACS.
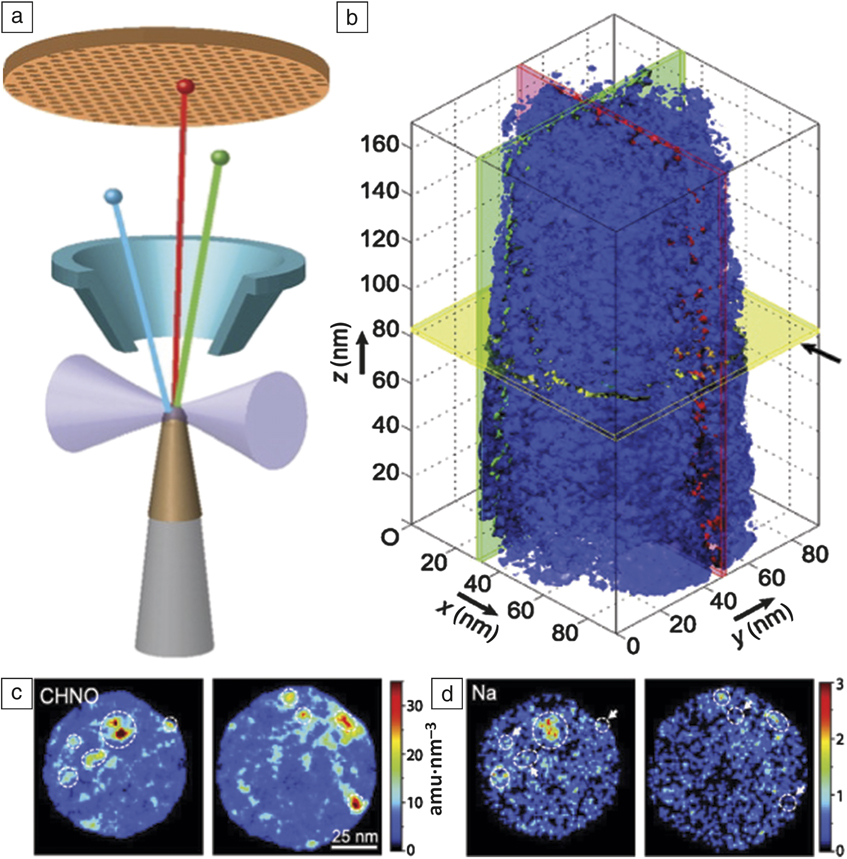
The first pioneering application of APT to the study of biomineral composites was to the tooth of a chiton, a small marine mollusk whose teeth are designed to scrape algae off of rocks.Reference Gordon and Joester69 Their teeth have a hard magnetite (Fe3O4) exterior and several organic-inorganic interfaces that are of interest. The APT revealed a 2–4 nm boundary-like region where the organic and inorganic materials are interspersed. The authors speculate that this interphase likely improves adhesion between the chemically disparate regions. A similar approach has been applied to dentin from elephant teeth.Reference Gordon, Tran and Joester70 APT revealed long organic fibers running parallel to the tooth direction with cross-sectional dimensions on the order of the width of a collagen microfibril (Figure 4b). Additionally, the fibers have locally increased concentrations of Mg2+ and Na+ ions (Figure 4c–d) and theorize that the exterior of the fibers may be coated with noncollagenous proteins, which selectively bind ions and may aid in mineralization. In other work, details of the chemical composition and spatial heterogeneity of rodent enamel have been elucidated using APT.Reference Gordon, Cohen, MacRenaris, Pasteris, Seda and Joester71 The unique chemical insights from APT allow for conclusions to be drawn about mechanisms of biomineral formation and function based on spatially resolved chemical information.
X-ray spectroscopy: Mapping amorphous to crystalline transformations
X-ray spectroscopy techniques, including extended x-ray absorption fine structure (EXAFS) and x-ray absorption near-edge spectroscopy, coupled with x-ray photoelectron emission microscopy (X-PEEM), have yielded many insights into the structures of biominerals.Reference Tamura and Gilbert72–Reference Ma, Aichmayer, Paris, Fratzl, Meibom, Metzler, Politi, Addadi, Gilbert and Weiner79 Sample preparation is relatively minimal compared to other techniques (typically embedding in resin and polishing), but some of the techniques are surface-sensitive (depending on the wavelength of x-rays used), requiring additional attention to avoid artifacts from surface-layers left by polishing.
EXAFS spectra contain information about local structure and therefore can distinguish between amorphous and crystalline phases. X-PEEM studies have provided a detailed picture of the amorphous to crystalline transformation in a variety of biomineralized tissues. The use of amorphous precursors in biomineralization has attracted much attention as a synthetic route to morphologically complex single crystals.Reference Weiner and Addadi80 For example, a recent study of larval sea urchin spicules, mineralized skeletal components, revealed that ACC nanoparticles unexpectedly persisted despite crystallization of the surrounding material.Reference Gong, Killian, Olson, Appathurai, Amasino, Martin, Holt, Wilt and Gilbert81 To date, most studies have focused on characterizing the inorganic component of biominerals; however, the organic component can also be probed by looking at the carbon K-edge in the EXAFS spectra, as shown in several recent studies.Reference Metzler, Tribello, Parrinello and Gilbert82–Reference Lam, Metzler, Gilbert and Beniash84
Vibrational spectromicroscopy: Chemically rich 3D maps of tissue composition
Vibrational (Raman and infrared) spectromicroscopy can non-destructively provide spatially resolved (0.5–1 µm) compositional information about the organic and inorganic components of biominerals.Reference Gamsjaeger, Mendelsohn, Boskey, Gourion-Arsiquaud, Klaushofer and Paschalis85, Reference Talari, Movasaghi, Rehman and Rehman86 These techniques consist of a spectrometer coupled to a standard or confocal optical microscope, with the excitation source focused on the sample through an objective lens. Two-dimensional images, with a spectrum at each pixel, are generated by raster-scanning the stage under the excitation source over a selected area.
Confocal Raman microscopy was recently used to analyze stomatopod raptorial appendages, which are used by the organism to “club” or “spear” prey (depending on the species) at very high velocities.Reference Weaver, Milliron, Miserez, Evans-Lutterodt, Herrera, Gallana, Mershon, Swanson, Zavattieri, DiMasi and Kisailus87, Reference Amini, Masic, Bertinetti, Teguh, Herrin, Zhu, Su and Miserez88 In this study, the authors constructed compositional gradient maps that revealed a transition from ACC to ACP at the bulk-impact interface and, finally, to highly crystalline sulfate-containing fluorapatite (FAP) along the actual impact surface.Reference Mahamid, Aichmayer, Shimoni, Ziblat, Li, Siegel, Paris, Fratzl, Weiner and Addadi77 Importantly, the sensitivity of the Raman technique allowed discernment of FAP from apatite, which could not be done on the basis of standard x-ray diffraction alone.
Confocal Raman spectromicroscopy can also be used to characterize compositional changes within 3D structures.Reference Lee, Wagermaier, Masic, Kommareddy, Bennet, Manjubala, Lee, Park, Cölfen and Fratzl89–Reference Lloyd, Wang and Donnelly92 In addition to 2D and 3D compositional maps, polarized Raman microspectroscopy can provide quantification of molecular and crystallographic orientation. For example, Masic et al. were able to observe multiscale orientational changes in rat tail tendon (Type I) collagen under stress.Reference Masic, Bertinetti, Schuetz, Galvis, Timofeeva, Dunlop, Seto, Hartmann and Fratzl93 Finally, one of the most promising applications of Raman is in vivo imaging and the capability to couple Raman microscopes with other techniques, such as fluorescence microscopy. For example, bone formation in zebrafish larvae was recently observed in vivo. Reference Bennet, Akiva, Faivre, Malkinson, Yaniv, Abdelilah-Seyfried, Fratzl and Masic94, Reference Akiva, Malkinson, Masic, Kerschnitzki, Bennet, Fratzl, Addadi, Weiner and Yaniv95 Anesthetized fish were analyzed under a water-immersion objective using a fluorescence-enabled modified Raman setup. Spectra were acquired along growing bones in the fin rays and showed a clear transition from little or no calcium phosphate to a predominance of calcium phosphate, correlated with calcein fluorescence (a calcium-binding marker). Furthermore, the mineral peaks suggested that OCP, or an OCP-like intermediate phase, may be present, a finding previously undocumented in vivo.
Conclusion
The development and application of advanced microscopy and spectroscopy techniques, some of which can be performed in situ, have been essential for understanding the structure and formation of biominerals and bioinspired materials. The information provided by these techniques about the chemistry, crystallography, phase distribution, structure, energetics, and kinetics of these materials forms the basis for a fundamental understanding of the diverse mechanisms by which natural systems can create structures. Yet we are only beginning to effectively mimic these processes synthetically. Fully understanding incorporated organic materials and the role they play in composite crystals will lead to further developments at the leading edge of characterization and synthesis.
Numerous recent advances in AFM imaging promise to provide new insights into biomineralization processes. High-speed imagingReference Ando, Kodera, Naito, Kinoshita, Furuta and Toyoshima96–Reference Kodera, Yamamoto, Ishikawa and Ando98 with image collection times below 100 ms should enable researchers to probe the conformational fluctuations and transformations that control the emergence of order during the assembly of an organic matrix. Frequency modulated AFMReference Fukuma and Jarvis99–Reference Fukuma, Higgins and Jarvis101 is capable of imaging the structure of the near-surface water layers at solid interfaces in solutions and measuring the small attractive force barriers between the tip and sample during the approach to the surface. These capabilities will lead to new insights into the role of solvation forces and solvent-mediated matrix–mineral interactions in directing biomineral formation.
Several of the other techniques described in this review, such as liquid phase TEM, are still in their infancy. Development of liquid cells for TEM instrumented for pH measurement, heating and cooling, and quantitative mixing will enable a wider range of experiments with well-defined solution saturation states. Solution supersaturation is a critical parameter to quantify in order for the resulting data regarding nucleation and growth modes to be interpreted in terms of theoretical predictions or compared to computer simulations. These and other developments will further enhance the applicability of liquid phase TEM for studying crystallization and matrix assembly.
New techniques are emerging, beyond those described here, that have the potential to provide even more detailed spatial and temporal resolution of biomineralization processes in hydrated (fluid) environments. For example, the recent implementation of scanning transmission x-ray microscopy end stations on synchrotron sources with resolution down to 10–20 nmReference Obst, Schmid and Kuo102 has enabled elemental mapping of hybrid organic/inorganic structures in fluid.Reference Cosmidis, Benzerara, Nassif, Tyliszczak and Bourdelle103, Reference Li, El Gabaly, Ferguson, Smith, Bartelt, Sugar, Fenton, Cogswell, Kilcoyne, Tyliszczak, Bazant and Chueh104 Another development is a new type of scanning electron microscope (e.g., airSEM) in which fully hydrated and uncoated samples can be imaged in air, allowing in situ observation of processes, such as calcium transport, in living organisms.Reference Akiva, Malkinson, Masic, Kerschnitzki, Bennet, Fratzl, Addadi, Weiner and Yaniv95, Reference Vidavsky, Addadi, Mahamid, Shimoni, Ben-Ezra, Shpigel, Weiner and Addadi105 The airSEM enables correlative imaging of tissues under ambient conditions by light and fluorescence microscopy and electron microscopy with elemental analysis by EDS.Reference Bennet, Akiva, Faivre, Malkinson, Yaniv, Abdelilah-Seyfried, Fratzl and Masic94, Reference Solomonov, Talmi-Frank, Milstein, Addadi, Aloshin and Sagi106 Finally, new sample preparation techniques such as cryo-FIB, in which cryogenically frozen samples are thinned by a focused ion beam, will enhance our ability to prepare electron-transparent samples of biological samples under near-native conditions.Reference Rigort, Bäuerlein, Villa, Eibauer, Laugks, Baumeister and Plitzko107
The future holds the promise of integrating several of these techniques to allow for correlative imaging and, for example, linking of structural and compositional variations to changes in properties, such as elastic moduli or hardness. Ultimately, the knowledge gained through such studies will enable materials scientists to reproduce the remarkable properties of biominerals through bioinspired approaches to materials synthesis.
Acknowledgments
The authors acknowledge support from the National Science Foundation (DMR 1210304) and the National Institutes of Health (CA173083). J.J.D.Y. and J.T. acknowledge support from the US Department of Energy, Office of Basic Energy Sciences, Division of Materials Science and Engineering J.J.D.Y also acknowledges support from the Laboratory Directed Research and Development Initiative on Materials Synthesis and Simulation across Scales at the Pacific Northwest National Laboratory (PNNL). PNNL is operated by Battelle for the US Department of Energy under Contract DE-AC05–76RL01830.