


Social media summary
Marmosets shown pale- or dark-eyed peers behaved no differently, challenging the self-domestication hypothesis.
Introduction
Eye contact in humans and other primates
In highly social species like primates, the functions of eye contact have diversified and are often embedded within social routines that extend beyond more basal functions (like predator detection and avoidance: Emery, Reference Emery2000; Gómez, Reference Gómez1996). Importantly, eye contact is not exclusively linked to threat; in some cases, it plays an affiliative role. In stump-tailed macaques and black howler monkeys, for instance, mutual gaze occurs during courtship or sexual contexts, possibly facilitating pair bonding or reinforcing familiarity (Emery, Reference Emery2000; Horwich, Reference Horwich1983; Linnankoski et al., Reference Linnankoski, Grönroos and Pertovaara1993; Zanoli et al., Reference Zanoli, Gamba, Lemasson, Palagi and Norscia2021).
Although the functions tied to eye contact are varied, they operate via deeply conserved pathways related to physiological arousal (Gómez, Reference Gómez1996; Hietanen, Reference Hietanen2018; Senju & Johnson, Reference Senju and Johnson2009). This arousal-related mechanism has been investigated in detail in humans – the effects of eye contact on social interactions are closely linked to physiological arousal (reviewed in Hietanen, Reference Hietanen2018). Experimental studies demonstrate that direct eye contact triggers heightened autonomic nervous system activity, evident in markers such as increased skin conductance (Hietanen et al., Reference Hietanen, Peltola and Hietanen2020), heart rate (Kiilavuori et al., Reference Kiilavuori, Sariola, Peltola and Hietanen2021), and pupil dilation, which are indicators of sympathetic nervous system activation (Hietanen, Reference Hietanen2018).
External eye appearance and perceived temperament
Hare (Reference Hare2017) suggested that low levels of peri-iridal pigmentation were a by-product of natural selection against aggression in humans – a process that they dub self-domestication (Hare et al., Reference Hare, Wobber and Wrangham2012) and speculate that could have characterized both the human and bonobo lineage. Sánchez‐Villagra and Van Schaik (Reference Sánchez‐Villagra and Van Schaik2019) later proposed that losses of pigmentation could function as honest signals of tame temperament. This proposal was based on the ‘domestication syndrome’ (Wilkins et al., Reference Wilkins, Wrangham and Fitch2014), the observation of the shared development of melanocytes and adrenal cells in early embryogenesis, which suggests a link between visual appearance and behaviour (e.g., why domesticates tend to present defects in pigmentation and be tamer than their wild counterparts). Early quantitative studies of external eye appearance in primates suggested that, specifically, pigmentation of the conjunctiva and sclera (the ‘white’ of the eyes – henceforth ‘peri-iridal tissues’) could indeed be a correlate of temperament. Perea-García et al. (Reference Perea-García, Kret, Monteiro and Hobaiter2019) found that bonobos (Pan paniscus) exhibit paler conjunctivae than chimpanzees (Pan troglodytes), consistent with their more egalitarian social tendencies (Hare et al., Reference Hare, Wobber and Wrangham2012). Mearing et al. (Reference Mearing, Burkart, Dunn, Street and Koops2022) later extended this idea to a broader, phylogenetically diverse primate sample, reporting that peri-iridal pigmentation was inversely correlated with proactive prosociality across 15 species and co-varied with lethal conspecific aggression across 108 species. Related findings suggest that reduced peri-iridal pigmentation may affect visual attention and social evaluation: orangutans look longer at the eyes of less-pigmented infants than at those of adults (Kano et al., Reference Kano, Call and Tomonaga2012; Perea-García, Reference Perea-García2016); human infants prefer primate faces edited to display human-like eyes over unedited faces (Dupierrix et al., Reference Dupierrix, De Boisferon, Méary, Lee, Quinn, Di Giorgio, Simion, Tomonaga and Pascalis2014); children prefer fictional characters with unpigmented peri-iridal tissues as cooperation partners (Wolf et al., Reference Wolf, Thielhelm and Tomasello2023); and adults judge hominin-like individuals with darker peri-iridal tissues as more aggressive (Wacewicz et al., Reference Wacewicz, Perea-García, Lewandowski and Danel2022). These studies suggest that peri-iridal tissues with relatively little amounts of pigment may reduce arousal during eye contact, allowing eye contact to be incorporated into other behavioural sequences, such as gaze following in conversation (Wohltjen & Wheatley, Reference Wohltjen and Wheatley2021).
It should be noted, however, that recent findings call into question the putative relationship between external eye appearance and temperament. For example, Mouginot et al. (Reference Mouginot, Wilson, Desai and Surbeck2024) and Brooker et al. (Reference Brooker, Webb, Van Leeuwen, Kordon, De Waal and Clay2025) recently refined the characterizations of bonobo social tolerance, and Clark et al. (Reference Clark, Lee, Poux, Langergraber, Mitani, Watts, Reed and Sandel2023) reported chimpanzees without visible peri-iridal pigmentation. Perea-García et al. (Reference Perea-García, Massen, Ostner, Schülke, Castellano-navarro, Gazagne, José-domínguez, Beltrán-francés, Kaburu, Ruppert, Micheletta, Gupta, Majolo, Maréchal, Pflüger, Böhm, Bourjade, Duran, Hobaiter and Monteiro2024) found no link between proxies of temperament (e.g. social grade) and external eye appearance in macaques. Chiefly, however, the relationship between eye appearance and selection against aggression was most rigorously tested in Caspar et al. (Reference Caspar, Hüttner and Begall2023). In their study, Caspar and colleagues compared the peri-iridal appearance of 13 domesticated species with their closest wild relatives and, although domesticates in some species pairs presented paler peri-iridal tissues, this did not apply to the global sample. While Caspar et al. (Reference Caspar, Hüttner and Begall2023) is a single study, it does not employ proxies of (self-) domestication as previous studies (Mearing et al., Reference Mearing, Burkart, Dunn, Street and Koops2022; Perea-García et al., Reference Perea-García, Kret, Monteiro and Hobaiter2019) do. Furthermore, Perea-García, Berris, et al. (Reference Perea-García, Berris, Tan and Kret2024) found no relationship between peri-iridal appearance and retaliatory aggression in a broad sample of macaque species. While previous studies employed variables that may intuitively approximate aggression or tameness (such as prosociality), those variables may ultimately lack a functional or mechanistic link with it (e.g., there is no evidence that domesticated species are more prosocial). In short, the previously proposed links between ocular appearance and temperament on the basis of correlational data are now being reevaluated (Perea‐García et al., Reference Perea‐García, Teuben and Caspar2025), and further testing is necessary, especially in experimental designs.
Pygmy marmosets as a study species
Callitrichids represent a valuable model for investigating the social and communicative functions of ocular morphology. As the only cooperatively breeding non-human primates, Callitrichids are unusually cooperative primates, which makes them a useful comparative reference for humans (Burkart & Finkenwirth, Reference Burkart and Finkenwirth2015). Furthermore, like humans, they exhibit among the lightest, most depigmented peri-iridal tissues in the primate order (Perea-García et al., Reference Perea-García, Ramarajan, Kret, Hobaiter and Monteiro2022). This feature, combined with their pronounced tolerance for eye contact (Miss & Burkart, Reference Miss and Burkart2018), makes them particularly suitable for testing the hypothesis that lighter depigmented eyes signal social tolerance or help attenuate arousal in gaze-mediated contexts (Harrod et al., Reference Harrod, Coe and Niedenthal2020). This behavioural profile has led to speculation that their ocular depigmentation may serve as a visual cue of tameness or reduced aggression (Mearing et al., Reference Mearing, Burkart, Dunn, Street and Koops2022). Their tolerance for experimental procedures involving eye-directed stimuli without adverse reactions further reinforces the suitability of pygmy marmosets as a model species for this kind of research.
Pygmy marmosets are also known for exhibiting complex vocal behaviours that appear to serve social functions. Their acoustic repertoire is highly flexible and context-dependent, reflecting strategic call usage. For example, they engage in antiphonal ‘conversational’ calling with clear sequential patterns (Snowdon & Cleveland, Reference Snowdon and Cleveland1984), and they adjust the type and frequency of calls depending on the distance between group members to minimize interference from habitat noise (De La Torre & Snowdon, Reference De La Torre and Snowdon2002). These vocalizations serve multiple functions, including maintaining contact with group members, coordinating social interactions, and advertising reproductive status, highlighting the cognitive sophistication of pygmy marmoset communication.
Study rationale
This study investigates whether lack of peri-iridal pigmentation affects behavioural arousal in marmosets, testing the broader hypothesis that ocular pigmentation may signal temperament. This idea is grounded in the domestication syndrome framework, which proposes that selection against aggression in social species leads to correlated traits, including lack of pigmentation (Sánchez‐Villagra & Van Schaik, Reference Sánchez‐Villagra and Van Schaik2019). Notably, self-domesticated species like humans and bonobos exhibit paler peri-iridal tissues compared to more aggressive relatives, such as chimpanzees (Hare, Reference Hare2017; Hare et al., Reference Hare, Wobber and Wrangham2012; Perea-García et al., Reference Perea-García, Kret, Monteiro and Hobaiter2019). In humans, darker peri-iridal tissues are associated with higher perceived aggression (Wacewicz et al., Reference Wacewicz, Perea-García, Lewandowski and Danel2022; Wolf et al., Reference Wolf, Thielhelm and Tomasello2023), though such effects may reflect perceptual biases given the rarity of this trait in human populations. Using a non-human model with natural variation in ocular pigmentation (brightness range: ∼18 to ∼78: Perea-García et al., Reference Perea-García, Ramarajan, Kret, Hobaiter and Monteiro2022) helps address this limitation.
Marmosets offer such a model, but existing evidence linking lack of ocular pigmentation to aggression is mixed. For example, Mearing et al. (Reference Mearing, Burkart, Dunn, Street and Koops2022) findings were undermined by methodological issues, including small sample sizes and tissue misidentification. Nonetheless, their interpretation of the results provided a rationale to motivate our study. Other studies have found no consistent differences in ocular pigmentation between domestic and wild forms (Caspar et al., Reference Caspar, Hüttner and Begall2023) or no correlation with social structure (which was assumed as a proxy of aggression: Perea-García, Berris, et al., Reference Perea-García, Berris, Tan and Kret2024). These inconsistencies underscore the need for more rigorous testing. In sum, our study addresses that gap by using marmosets (primates with eyes naturally lacking pigment and tolerant gaze behaviour, with crucial similarities to human sociality) to test whether peri-iridal pigmentation influences behavioural responses to eye contact under controlled conditions.
Methods
Materials
The study involved four female pygmy marmoset (Cebuella pygmaea) individuals: a 5-year-old mother and her three daughters, aged 3, 2, and 1. All were in good health throughout the study. Although we could not perform proper colourimetric measurements, the marmosets’ peri-iridal tissues were intermediately pigmented (compared with other members of their own species). The research took place during the winter at the Toruń Zoobotanical Garden in Poland, where the marmosets were housed exclusively indoors in a spacious 3 × 4 m enclosure, which was equipped with various enrichments, including toys, branches, windows, and food placed in multiple locations. It also featured several hiding spots, enabling the marmosets to exhibit natural behaviours and seek shelter as needed. The study was conducted in Poland per local laws, which do not require ethical approval for low-stress and non-invasive research that can be considered enrichment. Approval was granted by the Zoo authorities in Toruń, where the study took place, and all procedures followed relevant ARRIVE guidelines (Percie Du Sert et al., Reference Percie Du Sert, Hurst, Ahluwalia, Alam, Avey, Baker, Browne, Clark, Cuthill, Dirnagl, Emerson, Garner, Holgate, Howells, Karp, Lazic, Lidster, MacCallum, Macleod and Würbel2020). Researchers maintained regular communication with zoo staff throughout the testing period.
Procedure
The study was pre-registered at osf.io/e37bq (Perea-Garcia et al., Reference Perea-Garcia, Szala, Wacewicz, Matzinger and Szczepańska2023). Prior to data collection, the marmosets underwent a 7-day habituation period to the experimental apparatus. During this phase, they were exposed to the set-up without any stimuli being presented. The study was conducted between 9 November and 27 December 2022, spanning 36 non-consecutive days. Data were collected during morning sessions between 8:00 and 10:00 a.m., before the zoo’s opening hours. The researcher (A.S.) arrived at the facility around 7:45 a.m., and data collection began at approximately 8:00 a.m. Around 8:30 a.m., food was provided, consistently attracting the marmosets to a designated feeding area where they could clearly view the stimulus presentation screen. Sessions concluded shortly before 10:00 a.m.
Each day was assigned to one of three experimental conditions: bright, or dark peri-iridal tissues, or closed eyes (control). For each session, the marmosets viewed a looped sequence of 10 faces, all displaying the same condition. Each face was shown sequentially for 30 seconds, preceded by 30 seconds of a neutral grey screen and a brief white flash used to attract attention. One full sequence (10 faces) lasted approximately 10 minutes and was repeated for the duration of the session. These conditions were counterbalanced across the 36 sessions, with each condition occurring on 12 days. This resulted in a total of 2095.88 minutes of recordings. Although the marmosets were exposed to ambient zoo sounds and had visual access to a nearby enclosure, these elements were part of their typical daily environment. Non-daily distractions were logged and accounted for during data analysis.
Set-up
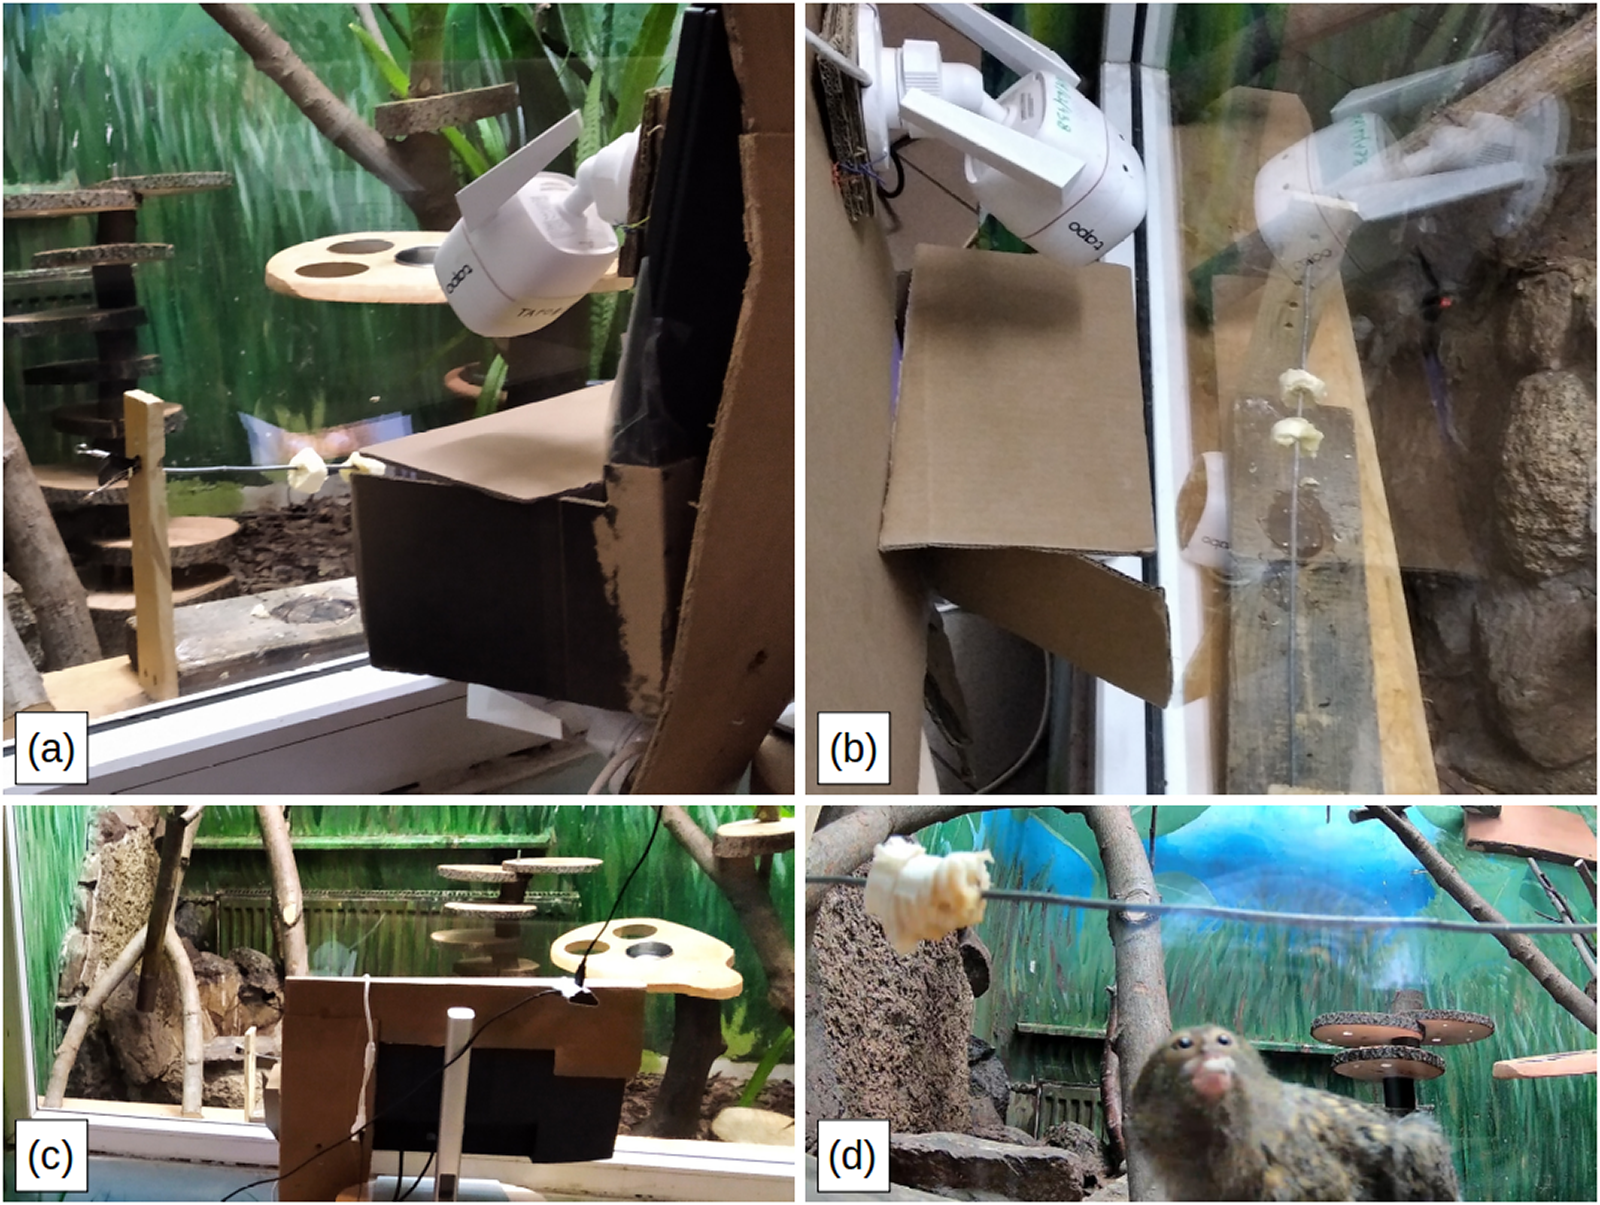
The marmosets viewed stimuli on a 21-inch LCD screen, of which only a small portion was visible through a cut-out in a colourless cardboard covering; the remainder of the screen was obscured. The visible stimulus area matched the approximate size of a real marmoset’s head. The screen was placed directly behind a glass barrier, approximately 5 cm away, which separated the marmosets from the experimental equipment. The marmosets typically sat on a ledge situated directly adjacent to the plexiglass, with the bottom of the visible screen at a height of roughly 15 cm. The viewing distance ranged from approximately 10 to 30 cm, depending on individual positioning along the ledge (Figure 1).
Test set-up: (a) view from the side, (b) view from above, (c) view from behind, (d) a marmoset viewing the stimulus while feeding.

Figure 1 Long description
Four-panel image of the experimental setup. Panel (a) shows a side view of the ledge where marmosets are recorded. To the right of the photo is the experimental apparatus, including the screen used to display marmoset stimulus photos and two cameras mounted above and below the screen. Panel (b) shows the same setup from above, with the feeding platform clearly visible. Panel (c) shows the view from behind the apparatus, from the researchers' perspective. Panel (d) shows the view from the bottom-mounted camera: a marmoset feeds on a banana while looking up towards the stimulus screen, and the photo of a marmoset can be seen reflected in the glass, confirming what the marmoset itself sees.
Food was placed on an elevated platform on the ledge so that the participants’ face direction aligned with the screen. Two Tapo C-310 cameras were positioned below and to the sides of the screen to record behavioural responses, and a Mantis Trust GXT 232 microphone was mounted behind a grate within the enclosure to record vocalizations. This set-up minimized interference from external sounds. Notable interruptions (e.g., the presence of zookeepers or maintenance staff, or visitors who entered before official opening times) were logged with corresponding timestamps for later control in analysis.
Stimuli
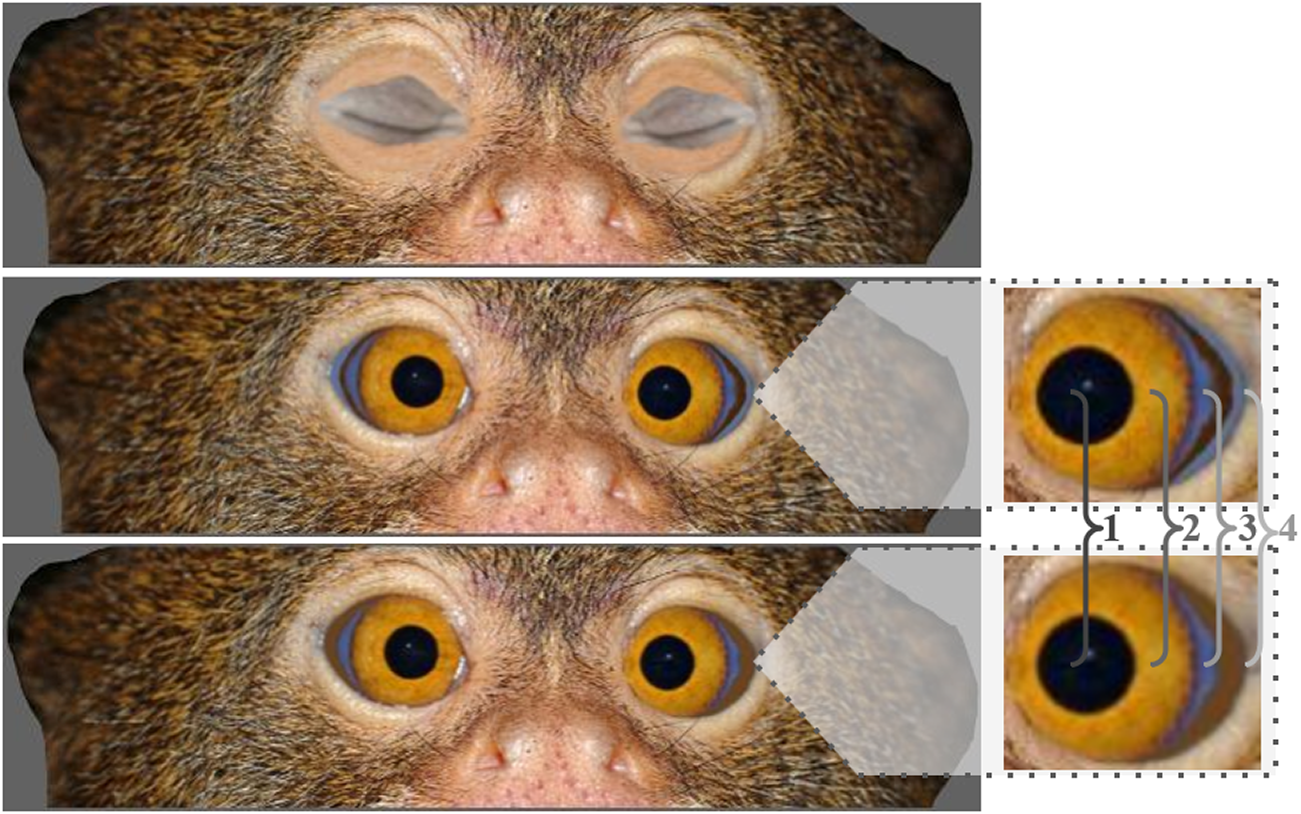
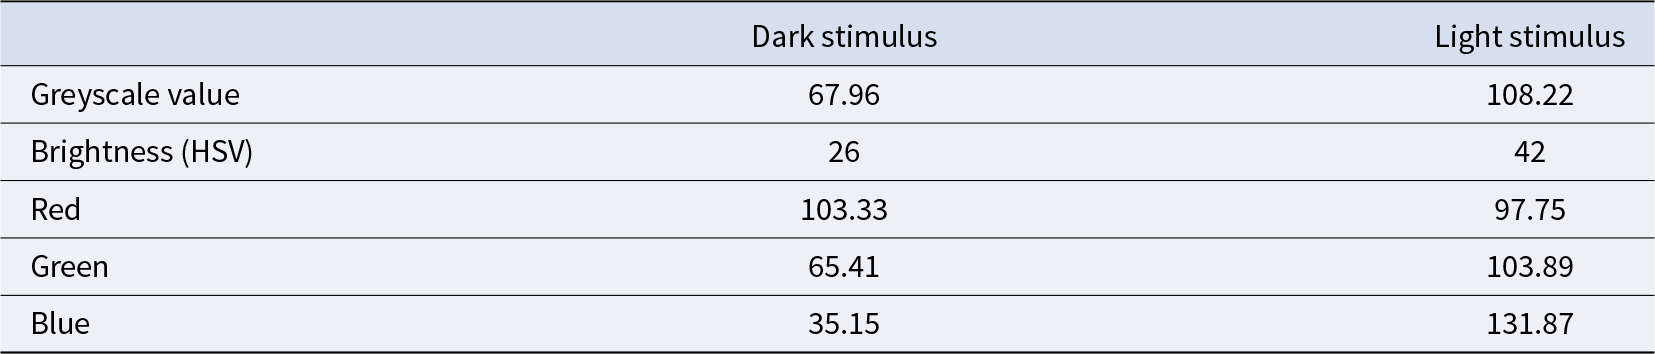
Stimuli consisted of photographs of 10 individual marmoset faces, digitally manipulated to fit the 3 experimental conditions. Brightness and contrast were standardized across all stimuli. These portraits were obtained from publicly available images on the internet. We had access to very few conspecific images of sufficient quality that were also front-facing. We could only obtain permission to reproduce the one in Figure 2. We can only confirm that the conspecifics were adults, but we have no access to their history of interaction with conspecifics, precise age or sex. To standardize eye appearance, a pair of eyes was reconstructed from a photograph. The same eyes were placed behind a cropped version of all the photographs in the stimulus, for the dark and bright conditions. Only the area surrounding the iris and temporal wedge (Perea-García et al., Reference Perea-García, Danel and Monteiro2021) was altered to look either dark or bright. We report the greyscale and Red, Green, Blue (RGB) values for the manipulated area in Table 1 (measured with ImageJ; Ferreira & Rasband, Reference Ferreira and Rasband2011). For comparison with studies reporting values in Hue, Saturation, Value (HSV) brightness (e.g., Perea-García et al., Reference Perea-García, Ramarajan, Kret, Hobaiter and Monteiro2022; Smith, Reference Smith1978), greyscale values were converted to brightness with the peko-step online colour converter tool (Peko-step, n.d.). After converting to HSV brightness, the values in our stimuli approximate the minimum (∼18) and mean (∼41.8) values reported by Perea-García et al. (Reference Perea-García, Ramarajan, Kret, Hobaiter and Monteiro2022) for pygmy marmosets. For the closed condition, we pasted a pair of closed eyelids on top of the eye area. Thus, the only change between conditions was the appearance of the eye area. This decision was to ensure that any changes in behaviour were solely due to differences in ocular appearance.
An example of the relevant part of the facial stimuli used in the experiment, shown in all three experimental conditions. From top to bottom, closed eyes (control), bright, and dark. Each image depicts the same marmoset individual with digitally manipulated eye regions. The most visible parts of the eye are labelled in the zoomed-in version: 1: pupil; 2: iris; 3: temporal wedge (Perea-García et al., Reference Perea-García, Danel and Monteiro2021); and 4: peri-iridal tissues. Photo by Bo Jonsson (2005), used with permission.

Figure 2 Long description
Three photographs of the same marmoset’s face (only the eyes part) are stacked vertically, identical except for the eye region. The top image shows the eyes closed (control condition). The middle image shows the eyes with bright, pale peri-iridal tissue. The bottom image shows the eyes with dark peri-iridal tissue. A zoomed-in inset labels four parts of the eye: 1, the pupil; 2, the iris; 3, the temporal wedge; and 4, the peri-iridal tissue, the pale or dark area that was digitally manipulated between conditions.
The greyscale, the brightness (HSV), and the RGB values for the manipulated area of the eyes

Table 1 Long description
The table has two columns, dark stimulus and light stimulus, and five rows. Greyscale value: 67.96 for dark, 108.22 for light. Brightness (HSV): 26 for dark, 42 for light. Red: 103.33 for dark, 97.75 for light. Green: 65.41 for dark, 103.89 for light. Blue: 35.15 for dark, 131.87 for light. Overall, the light stimulus has higher greyscale, brightness, green, and blue values than the dark stimulus, while red is similar between the two, slightly higher in the dark stimulus.
Audio and video annotation
Audio files were first marked as either happening while there was a disruption (such as the keeper entering the enclosure to place the food, or a visitor unexpectedly entering before visiting times) or not. Several recordings were made for each day, and their durations varied; they were automatically segmented into files of up to 20 minutes, reflecting the maximum length supported by the recording software. This segmentation did not affect the continuity or coverage of the recorded sessions. Recordings started before the caretakers placed the feeding platform inside the enclosure, so most days include a period of recording during which the caretaker enters the enclosure. Most days also include recordings during which disruptions were recorded by the researcher. The aggregated duration of recordings with and without disruptions is variable; descriptive statistics are reported in Table SXDurationRecordings (Supplement 1: Table S1). Audio files were then imported into Audacity, and their respective spectrograms were visually inspected by E.D., after training with M.S. We noted J-calls, clicks, trills, whistles (Pola & Snowdon, Reference Pola and Snowdon1975), and ‘others’. The ‘others’ category includes less frequent or harder to interpret vocalizations – tonal squeaks, Type A alert calls, infant calls, and long infant calls (Pola & Snowdon, Reference Pola and Snowdon1975; Snowdon & Hodun, Reference Snowdon and Hodun1981). We could not assign specific calls to specific individuals, as the coding of visible behaviours and vocalizations was conducted separately. From the recordings, it was evident that vocalizations were directed towards the direction of the stimulus. Examples of these calls and descriptions of the calls in our sample are included in Supplement 2.
Several behaviours in the pygmy marmoset repertoire can be interpreted as responses to unfamiliar conspecifics, motivational conflict (e.g., feeding versus responding to a potential intruder), or heightened arousal. Initially, we classified behaviours such as light scratch, heavy scratch, self-grooming, yawning, tongue flick, piloerection, and swaying as displacement or stress-related behaviours based on literature from other primate taxa (Baker & Aureli, Reference Baker and Aureli1997; Diezinger & Anderson, Reference Diezinger and Anderson1986; Easley et al., Reference Easley, Coelho and Taylor1987; Hennessy et al., Reference Hennessy, Deak, Schiml-webb, Wilson, Greenlee and McCall2004; Schino et al., Reference Schino, Perretta, Taglioni, Monaco and Troisi1996; Troisi, Reference Troisi2002) and a manual for common marmoset care (University of Stirling, n.d.). However, these studies primarily concern great apes and Old World monkeys, and such behaviours are not consistently validated indicators of stress in New World monkeys. In marmosets specifically, scent-marking, piloerection, and increased locomotion are more commonly described as stress- or arousal-related (e.g., Bassett et al., Reference Bassett, Buchanan-Smith, McKinley and Smith2003), and tongue flick is frequently reported in sexual contexts (Kemp & Kaplan, Reference Kemp and Kaplan2013). Accordingly, while these behaviours were included in our analyses, they should be interpreted cautiously and not as definitive markers of stress. Rather, we report them as part of a broader behavioural repertoire that may reflect arousal, vigilance, social signalling, or motivational conflict – in general, contexts that may give rise to displacement activities.
Prior to manual annotation of the video recordings, these were edited to facilitate the task (see the protocol for video pre-processing in Supplement 3). Because we only annotated behaviour that happened when the marmosets were on the feeding platform, for each day we trimmed the recordings (1) 5 seconds before the first marmoset landed on the feeding platform, and (2) 5 seconds after the last marmoset left the feeding platform. To ensure that disruptions (such as visitors entering unexpectedly or caretakers talking with the researcher) did not cause the behaviour we observed, we also trimmed (3) 30 seconds before and after any disruption that was noted by the researcher during data collection. This resulted in a total of 913.94 minutes.
Video recordings were analysed on a frame-by-frame basis in BORIS (Friard & Gamba, Reference Friard and Gamba2016) by J.O.P.G. and T.M. An ethogram of relevant behaviours was elaborated on the basis of the information published by the University of Stirling (n.d.), especially those considered displacement behaviours in primates, in addition to general behaviours such as eating or moving. While the information published by the University of Stirling (n.d.) pertains specifically to common marmosets, it can also be applied to the target species in our study (C. pygmaea). The behavioural categories included in the ethogram were (1) point behaviours: anogenital tail present; pounce; scent-marking; light scratch; heavy scratch; self-groom; jump startle; tongue flick; yawn; piloerection; open mouth stare; ears flattened; frown; bare teeth; withdrawal; leg stand; and swaying, and (2) continuous behaviours: eating; moving; gouging; and inactive. We assigned proxy labels for individuals for the purposes of coding. To do so, we assigned a label to the first marmoset to appear on the platform. We applied subsequent labels to individuals as they appeared on the platform. Thus, the same label may have been applied to different individuals within and across sessions. As a result, we were not able to account for individual variation. We excluded one observation (25 December 2022) because the camera was not centred on the feeding platform, so it was not possible to code all the behaviours. Because some categories were too infrequent, they were either dropped (e.g., yawn) or, when possible, merged to form a broader category (e.g., light and heavy scratch were merged into ‘scratch’). A full table with descriptions of the behaviours specifically for this study (including the behaviours that were eventually dropped or merged) can be found in Supplement 4: Table S3.
Analyses
All statistics were carried out in R (4.4.2; R Core Team, 2020). We used the ‘brms’ package (Bürkner, Reference Bürkner2018) for our regression analyses. Confidence intervals (CIs) and coefficients for fixed effects were extracted using the tab_model function from the ‘sjPlot’ package (Lüdecke, Reference Lüdecke2018), and CIs for random effects were extracted using base R. Marmoset vocalizations were analysed using Bayesian models, with call type as the dependent variable, visual stimulus condition as the fixed effect, and recording duration included as an offset to account for variable session lengths. The models were formulated as:
 \begin{equation*}{\text{DV }}\left( {{\text{Type of call}}} \right) \sim {\text{Condition + offset}}\left( {{\text{log}}\left( {{\text{DurationMinute}}} \right)} \right){\text{ + }}\left( {{\text{1 | Date}}} \right)\end{equation*}
Visible behaviours were analysed using Bayesian models, with each behaviour type as the dependent variable, visual stimulus condition as the fixed effect, and Coder nested within Observation ID included as random effects. The models were formulated as:
 \begin{equation*}\text{DV (Behaviour} \sim \text{Condition + }\left( {{\text{1 | Coder/Observation ID}}} \right)\end{equation*}
Outcome variables were modelled with likelihoods that match their data-generating processes. Counts of discrete events, such as facial expressions and self-directed behaviours, were modelled using a Poisson likelihood, reflecting the integer-valued, non-negative nature of these observations. Continuous proportions, such as the proportion of time spent on the feeding platform, were modelled using a beta likelihood, appropriate for bounded, continuous measurements with heteroskedastic and potentially skewed distributions. Average eating bouts, measured in minutes, were strictly positive and right-skewed; therefore, they were modelled using a lognormal likelihood. Facial expressions and self-directed behaviours, which were count variables with many zeros, were modelled using a zero-inflated negative binomial likelihood.
Because our sampling period was prolonged, habituation in the latter sessions could diminish differences between conditions. Thus, we ran a series of models that also included the session number and its interaction with condition. Models were implemented using variations of the brm function with the same distributions as the previous analyses, with the exception of the model estimating the occurrence of self-directed behaviours, which could not converge – we used a negative binomial instead. Analyses were conducted on aggregated behaviour across individuals, which represents a primary limitation of the study. We centred day of exposure to improve model convergence. Model diagnostics indicated satisfactory convergence and fit. All R̂ values were 1.00, trace plots showed stable mixing across chains, and posterior predictive checks demonstrated close correspondence between observed and simulated data distributions (assessed visually with the pp_check function). Cohen’s Kappa for manual annotation of visible behaviours was calculated with the built-in tool in BORIS (v. 8.24.1).
Results
For all behavioural analyses, results are reported as incidence rate ratios (IRRs) for count-based measures or as estimated values for continuous measures. In each model, the intercept corresponds to the baseline condition, which is the closed-eyes condition, and all other conditions are expressed relative to this reference. Reported 95% CIs indicate the uncertainty around the estimates. Random effects Intraclass Correlation Coefficients (ICCs) and R 2 values are included to quantify between-observation variability and the proportion of variance explained by fixed and random factors.
Vocalizations
Overall, the models accounted for very little of the variance in vocalizations. Effects of visual stimulus were minimal and uncertain, as indicated by 95% credible intervals that included 1, whereas external disruptions were associated with consistent reductions in call rates. Variation in vocalization rates was therefore primarily influenced by external disturbances rather than visual manipulations. The pattern observed for J-calls was consistent with previous analyses, but certainty was low due to wide credible intervals.
Overall call rate
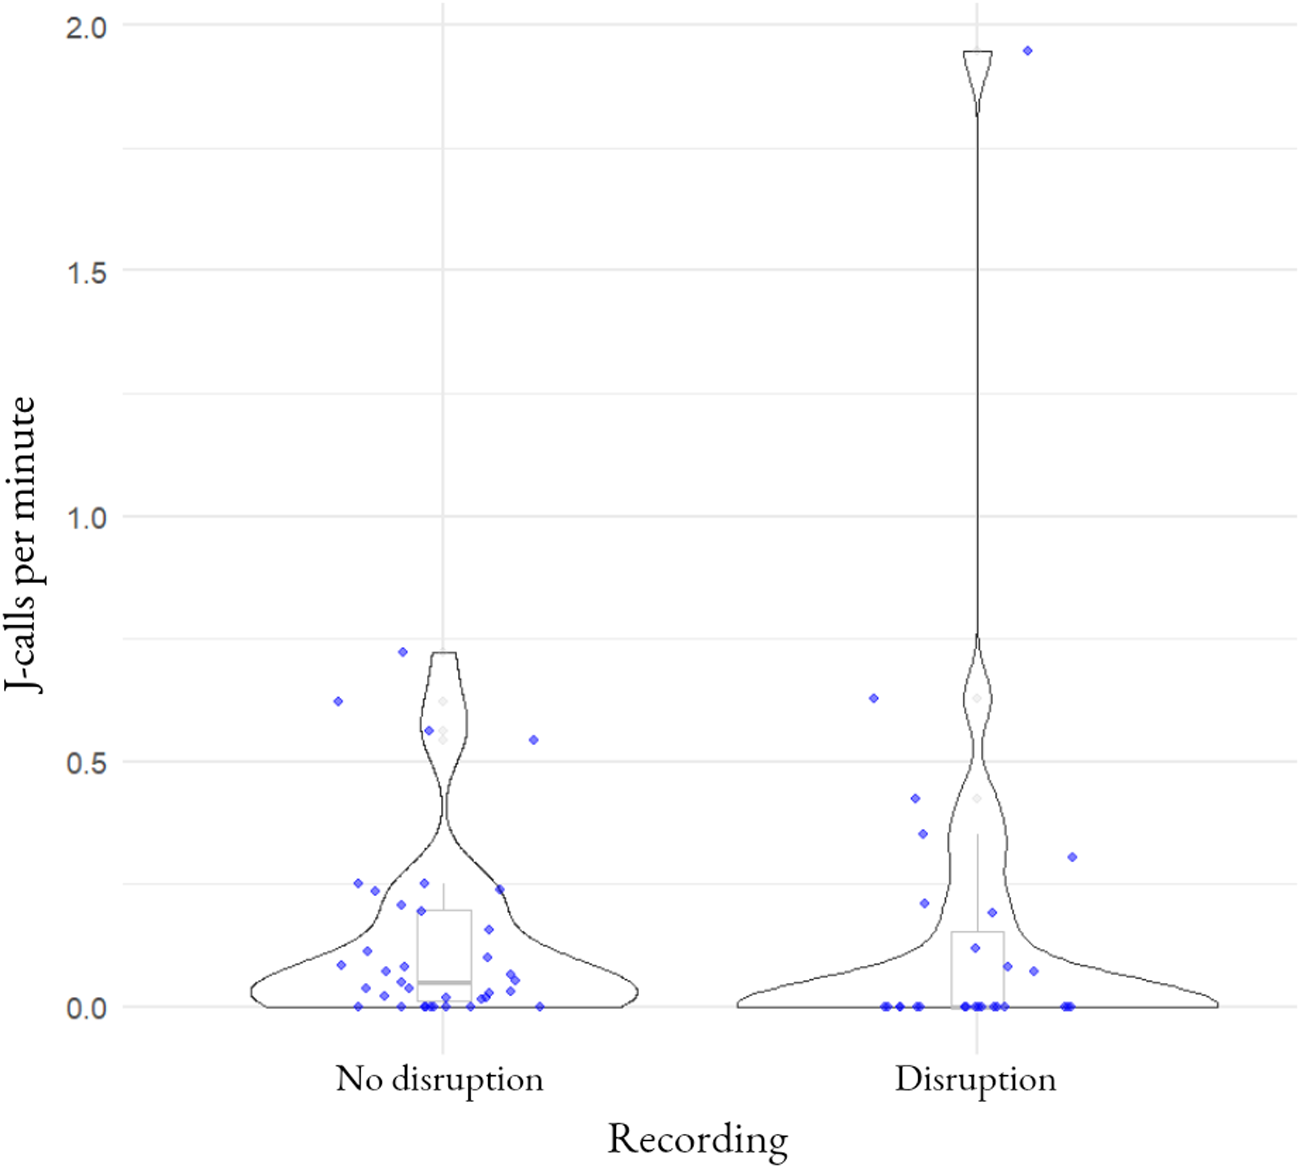
Across all recordings, marmosets produced a mean rate of 0.07 vocalizations per second (IRR = 0.07, 95% CI [0.05–0.09]). Vocalization rate was significantly affected by disruptions, such as the presence of keepers or visitors. When disruptions occurred, call rates were reduced (IRR = 0.84, 95% CI [0.79–0.89]). This corresponds to a decrease from approximately 0.07 to 0.06 vocalizations per second (an absolute reduction of ∼0.01 calls per second), indicating that external disturbances transiently suppressed vocal activity (Figure 3). Random effects of date accounted for a large proportion of variance (ICC = 0.73), and model fit was strong (marginal R 2 = 0.318; conditional R 2 = 0.966), suggesting that disruptions were the main driver of observed variation.
Effects of stimulus condition and disruptions on vocalization rate. Vocalizations were lower when external disruptions occurred. Data points represent recording sessions. Because individual marmosets could not be reliably identified, analyses were conducted on aggregated group-level data, and the contribution of specific individuals to each data point is unknown.

Figure 3 Long description
A graph comparing marmoset vocalisation rate (J-calls per minute) between recording sessions with and without external disruptions, such as keepers or visitors entering the enclosure. Each data point represents one recording session. Sessions with disruptions show a lower vocalisation rate than sessions without disruptions, though there is overlap and spread within each group.
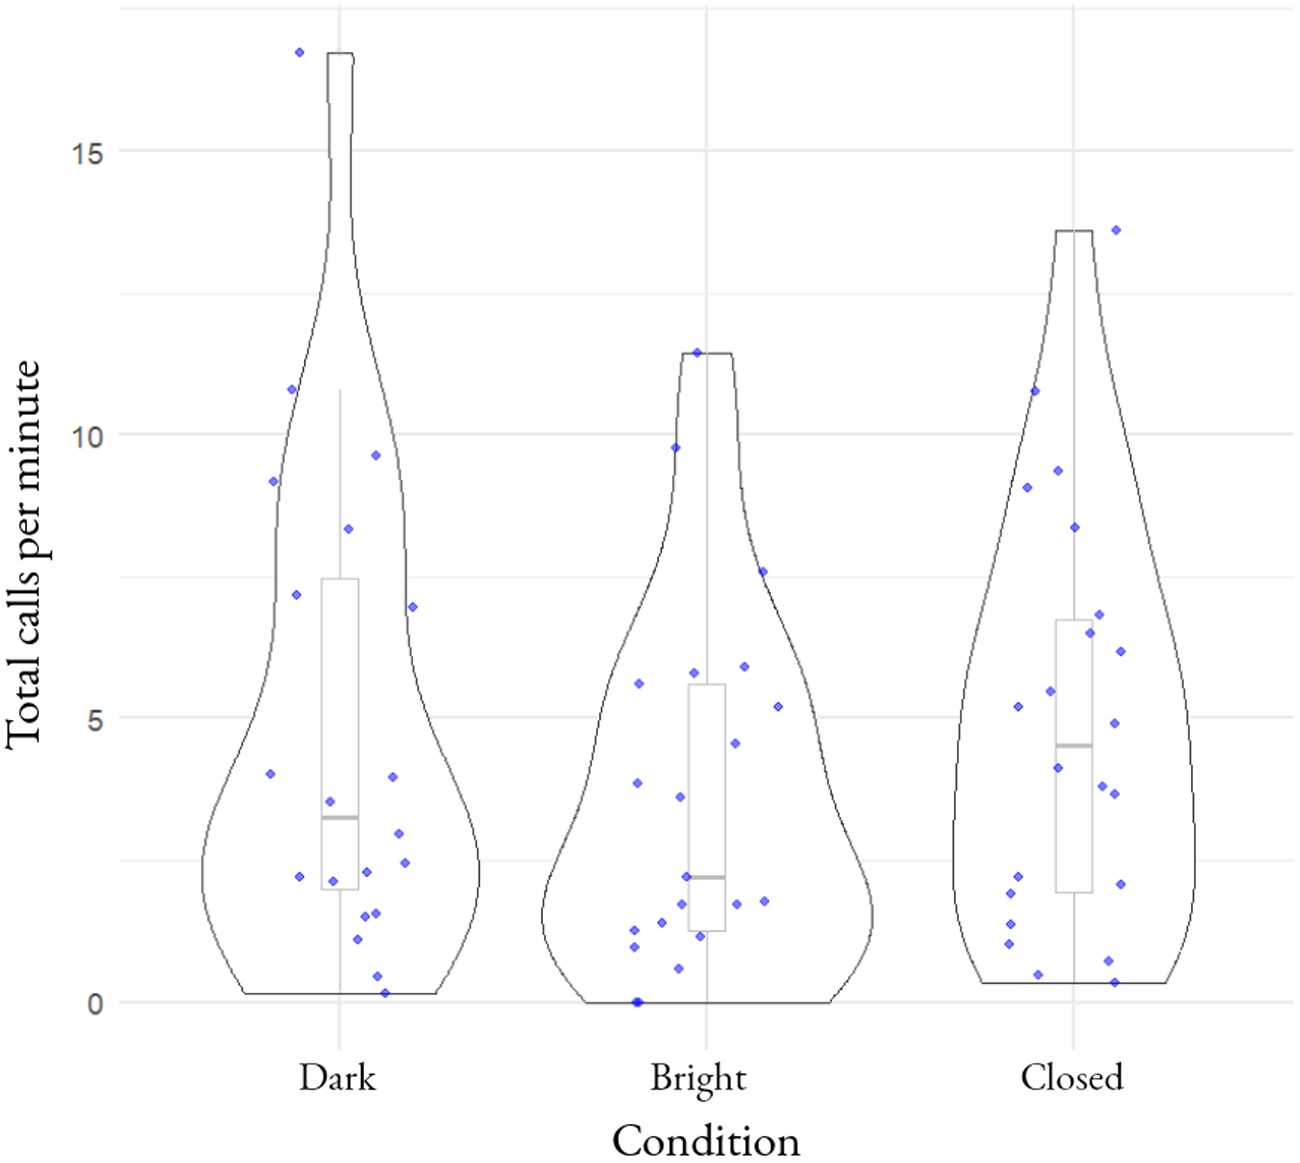
In recordings with no disruptions, total vocalizations did not differ substantially across visual stimulus conditions. Relative to the reference condition, call rates were slightly lower in the dark condition (IRR = 0.87, 95% CI [0.43–1.62]). This corresponds to a decrease from approximately 0.07 to 0.06 vocalizations per second (an absolute reduction of ∼0.01 calls per second). Call rates were somewhat lower in the bright condition (IRR = 0.62, 95% CI [0.31–1.20]). This corresponds to a decrease from approximately 0.07 to 0.04 vocalizations per second (an absolute reduction of ∼0.03 calls per second), although CIs overlapped 1 in both cases. Between-session variability remained high (ICC = 0.75). While the conditional R 2 was extremely high (0.995), the marginal R 2 was modest (0.274), indicating that most of the explained variance was attributable to random effects rather than condition. Overall, visual stimulus condition had little impact on total call rates (Figure 4).
Effects of stimulus type on vocalization rate. Vocalization rates did not differ substantially across stimulus conditions. Data points represent recording sessions. Because individual marmosets could not be reliably identified, analyses were conducted on aggregated group-level data, and the contribution of specific individuals to each data point is unknown.

Figure 4 Long description
A graph comparing marmoset vocalisation rate (total calls) across the three stimulus conditions: bright eyes, dark eyes, and closed eyes. Each data point represents one recording session. The spread of points across the three conditions is similar, with substantial overlap between them, indicating no clear difference in vocalisation rate by condition.
J-calls
Production of J-calls did not show clear condition effects. Compared to the reference condition, rates were slightly higher in the dark condition (IRR = 1.15, 95% CI [0.28–4.36]). This corresponds to an increase from approximately 0.01 to 0.01–0.02 calls per second (an absolute increase of ∼0.001 calls per second). Rates were lower in the bright condition (IRR = 0.33, 95% CI [0.07–1.49]). This corresponds to a decrease from approximately 0.01 to 0.003 calls per second (an absolute reduction of ∼0.007 calls per second), though credible intervals were wide and included 1. Between-session variability was very high (ICC = 0.92). The marginal R 2 was low (0.052), indicating that condition explained very little variation in J-call production.
Other call types
No consistent condition effects were observed for other call categories. Clicks: dark (IRR = 1.13, 95% CI [0.22–4.51]), corresponding to an increase from ∼0.002 to ∼0.002–0.003 calls per second (absolute ∼0.0002 calls per second); bright (IRR = 1.11, 95% CI [0.25–4.97]), ∼0.002 to ∼0.002–0.003 calls per second (absolute ∼0.0002 calls per second); ICC = 0.92; marginal R 2 = 0.029. Trills: dark (IRR = 0.84, 95% CI [0.34–1.92]), from ∼0.06 to ∼0.05 calls per second (absolute ∼0.01 reduction); bright (IRR = 0.43, 95% CI [0.18–0.98]), from ∼0.06 to ∼0.03 calls per second (absolute ∼0.03 reduction); ICC = 0.78; marginal R 2 = 0.248. Notably, trill production was lower in the bright condition, with the CI narrowly excluding 1. Whistles: dark (IRR = 0.66, 95% CI [0.14–2.90]), from ∼0.01 to ∼0.006 calls per second (absolute ∼0.004 reduction); bright (IRR = 0.19, 95% CI [0.02–1.08]), from ∼0.01 to ∼0.002 calls per second (absolute ∼0.008 reduction); ICC = 0.77; marginal R 2 = 0.062. Although whistles appeared reduced in the bright condition, uncertainty was high. Across models, ICC values were consistently large, indicating that between-session variability accounted for most of the variance in vocal production.
Visible behaviours
Inter-rater reliability
Cohen’s Kappa for manual annotation of visible behaviours was calculated on three separate sessions chosen at random, and ranged from substantial to almost perfect agreement (0.631, 0.738, and 0.905, respectively; Landis & Koch, Reference Landis and Koch1977).
Proportion of observation time spent on the platform
Across all sessions, marmosets spent between 5.89 and 60.26 minutes on the platform (mean = 26.11), of which they spent between 3.9 and 45.62 minutes eating (mean = 20.52). These data in full can be found in Supplement 1: Table S2. The proportion of time that marmosets spent on the platform did not differ substantially across visual stimulus conditions. The baseline (closed-eyes condition; intercept = 0.20, 95% CI [0.05–1.93]) represents the estimated proportion of observation time spent on the platform. Compared to the closed-eyes baseline, the proportion was slightly higher in the dark condition (estimate = 1.28, 95% CI [0.78–2.15]), corresponding to an increase from 0.20 to ∼0.26 of observation time (absolute ∼0.06), and in the bright condition (estimate = 1.20, 95% CI [0.71–2.05]), corresponding to an increase from 0.20 to ∼0.24 (absolute ∼0.04). Random effects were very high (ICC = 1.00), indicating most variance was attributable to differences between coders and observations. The fixed effect of stimulus type explained very little variance (marginal R 2 = 0.016; conditional R 2 = 0.041), indicating that stimulus type had no meaningful effect on platform use.
Average length of eating bouts
The duration of eating bouts was similar across conditions. The baseline (closed-eyes condition; intercept = −1.07, 95% CI [−2.80 to 0.74]) represents the estimated bout length in minutes when no other stimulus is present. Compared to this baseline, bout length was 0.01 minutes (95% CI [−0.37 to 0.38]) in the dark condition, an absolute change of ∼0.01 minutes, and 0.17 minutes (95% CI [−0.22 to 0.54]) in the bright condition, an absolute increase of ∼0.17 minutes. Between-observation variability was moderate (ICC = 0.46), indicating substantial differences between coders and observation sessions. Fixed effects explained very little variance (marginal R 2 = 0.011; conditional R 2 = 0.172), suggesting that visual stimulus did not substantially alter intrinsically motivated feeding behaviour.
Agonistic facial expressions
Rates of open-mouth stares and bare-teeth displays were not significantly affected by condition. The baseline (closed-eyes condition; intercept = 0.69, 95% CI [0.04–4.18]) represents the expected number of expressions per observation hour. Compared to this baseline, IRRs were 1.68 (95% CI [0.55–6.96]), corresponding to an increase from ∼0.69 to ∼1.16 expressions per hour (absolute ∼0.47), in the dark condition and 1.27 (95% CI [0.41–5.02]), corresponding to an increase from ∼0.69 to ∼0.88 expressions per hour (absolute ∼0.19), in the bright condition. Random effects were high (ICC = 0.75), indicating that most variance occurred between observations and coders. Fixed effects explained very little variance (marginal R 2 = 0.007; conditional R 2 = 0.062), indicating that visual stimulus had minimal influence on agonistic facial expressions.
Displacement/self-directed behaviours
Scratches and self-grooming were combined into a single ‘displacement/self-directed’ category. The baseline (closed-eyes condition; intercept = 0.15, 95% CI [0.01–2.22]) represents the expected number of these behaviours per observation hour. No meaningful differences were observed across conditions, with IRRs of 1.49 (95% CI [0.21–11.18]), corresponding to an increase from ∼0.15 to ∼0.22 behaviours per hour (absolute ∼0.07), for dark and 0.75 (95% CI [0.08–6.57]), corresponding to a decrease from ∼0.15 to ∼0.11 behaviours per hour (absolute ∼0.04), for bright. Random effects were very high (ICC = 0.96), indicating that most variance occurred at the level of coder and observation. Fixed effects explained essentially no variance (marginal R 2 = 0.000; conditional R 2 = 0.118), indicating that visual stimulus had no influence on these behaviours.
Extra analyses assessing habituation
Visual inspection suggested that there may be a trend towards habituation in visible behaviours (Supplement 6: Figures S1–S4) and vocalizations (Supplement 6: Figures S5–S9). Analyses, however, found no reliable differences, nor could they estimate habituation effects. Nonetheless, there were weak trends towards a greater number of J-calls, trills, and whistles over sessions. For visible behaviours, R 2 values remained extremely low, and conditional R 2 remained low as well, with a maximum of 0.17 for eating bout duration, indicating that most variance in platform use, feeding, agonistic, and displacement behaviours was attributable to random effects rather than stimulus condition or session. For vocalizations, fixed effects explained more variance (marginal R 2 up to ∼0.42), but conditional R 2 values were very high (≥0.75), reflecting substantial between-date and observation-level variability. Overall, these results suggest that any apparent changes over sessions are weak and dominated by random clustering rather than systematic habituation effects. The full results are in the supplementary materials (Supplement 5).
Discussion
This study set out to test the hypothesis that lack of peri-iridal pigmentation attenuates behavioural arousal in eye contact contexts, based on the broader proposal that ocular pigmentation may function as a cue to temperament (Mearing et al., Reference Mearing, Burkart, Dunn, Street and Koops2022; Sánchez‐Villagra & Van Schaik, Reference Sánchez‐Villagra and Van Schaik2019). However, our findings do not support this idea: marmosets displayed similar behavioural responses to all stimulus types: light eyes, dark eyes, and closed eyes. Across all analyses, model performance indicated that the fixed effect of visual condition explained minimal variance in behavioural outcomes. While random effects captured some day-to-day variability, particularly in vocalizations, the overall explanatory power of the models was consistently low (marginal R 2 values generally below 0.05). This suggests that the observed behavioural variation was largely unrelated to the appearance of the eye stimuli. In other words, whatever drives marmoset behaviour in this context does not appear to be influenced by the peri-iridal pigmentation manipulations used here. These findings point to a potential mismatch between the task and the cognitive or perceptual mechanisms underlying marmoset social responses, a possibility discussed in light of recent arguments about ecological relevance in animal cognition research (Howard, Reference Howard2025). Several possible explanations may account for this apparent lack of differentiation.
Firstly, it is possible that ocular pigmentation does not, in fact, modulate arousal or temperament perception, at least not in a consistent or biologically meaningful way. There is ample consensus that reduced pigmentation is part of a (self-)domestication syndrome (Darwin, Reference Darwin1868; Hare et al., Reference Hare, Wobber and Wrangham2012; Sánchez‐Villagra & Van Schaik, Reference Sánchez‐Villagra and Van Schaik2019; Wilkins et al., Reference Wilkins, Wrangham and Fitch2014). Earlier studies that intended to employ proxies of domestic-like phenotypes suggested that this may extend to lack of pigment in peri-iridal tissues (Mearing et al., Reference Mearing, Burkart, Dunn, Street and Koops2022; Perea-García et al., Reference Perea-García, Kret, Monteiro and Hobaiter2019), but more recent empirical work has failed to confirm a robust link between ocular pigmentation and aggression. For example, Caspar et al. (Reference Caspar, Hüttner and Begall2023) found no consistent significant differences in ocular pigmentation between actually domesticated species and their wild counterparts. Similarly, Perea-García, Berris, et al. (Reference Perea-García, Berris, Tan and Kret2024) reported no association between peri-iridal pigmentation and retaliatory aggression in macaques. These findings converge with our own results, suggesting that the proposed link between peri-iridal colouration and social temperament may be overstated. Importantly, it should be noted that the relationship between ocular and dermal melanocytes is more complex than often assumed. With the exception of the retinal pigment epithelium, melanocytes in ocular tissues and the skin ultimately derive from neural crest cells. However, neural crest-derived melanocyte lineages diverge during development into distinct precursor populations, including those that give rise to uveal melanocytes (e.g., in the iris, choroid, and sclera) and those that give rise to dermal melanocytes (Boissy & Hornyak, Reference Boissy, Hornyak, Nordlund, Boissy, Hearing, King, Oetting and Ortonne2006). Thus, ocular and dermal melanocytes share more distant embryonic origins, although they do not arise from the same immediate precursor populations. We lack data regarding the embryonic origins of conjunctival melanocytes (those that predominantly alter the appearance of peri-iridal tissues; Kobayashi & Kohshima, Reference Kobayashi and Kohshima2001) – which could explain why ocular tissues may not be depigmented in domesticates (Caspar et al., Reference Caspar, Hüttner and Begall2023). The putative connection between ocular pigmentation and temperament (Hare, Reference Hare2017; Perea-García et al., Reference Perea-García, Kret, Monteiro and Hobaiter2019) thus rests on the assumption that conjunctival melanocytes share embryonic precursors with dermal melanocytes.
Secondly, even if some subtle perceptual or affective effects of pigmentation exist, our method may not have been sensitive enough to detect them, or marmosets may not be responsive to this cue in the way that had been predicted. For instance, Harrod et al. (Reference Harrod, Coe and Niedenthal2020) describe marmosets as highly tolerant of eye contact, often showing muted arousal or stress responses even under direct gaze conditions. It is therefore plausible that, in this species, ocular pigmentation is not a salient social cue, or that eye contact itself is not perceived as threatening or arousing to begin with. Supporting this, cross-species evidence suggests that gaze sensitivity and responsiveness to ‘being watched’ vary substantially across primates. Nettle et al. (Reference Nettle, Cronin and Bateson2013), for example, found that while humans reliably modify behaviour in response to stylized eyes or face cues, chimpanzees showed no consistent attentional or behavioural changes when presented with similar stimuli. These results align with our own findings and support the broader view that non-human primates may not treat eye-like stimuli as indicative of social monitoring in the same way humans do. Because we are interested in behaviour as an indicator of arousal, it could be that measuring more direct consequences of arousal, such as physiological changes, could reveal effects. For example, future studies could incorporate measures such as pupil dilation (Kuraoka & Nakamura, Reference Kuraoka and Nakamura2022), cortisol levels (Ash et al., Reference Ash, Smith, Knight and Buchanan-Smith2018), or temperature changes detected via thermography (Bhattacharjee et al., Reference Bhattacharjee, Guðjónsdóttir, Chova, Middelburg, Jäckels, De Groot, Wallner, Massen and Pflüger2024) to assess whether ocular pigmentation influences physiological arousal in the absence of overt behavioural responses.
Relatedly, it is important to consider the extent of ecological relevance of our study. We aimed at reproducing a naturalistic situation in which our group ‘runs into’ unfamiliar individuals. Nonetheless, our design, stimulus, or apparatus may not have fully captured aspects of cognition or behaviour that are consistently relevant to pygmy marmosets, or to the developmental stage of the participants (Howard, Reference Howard2025). It is also possible that our experimental manipulation was too subtle to elicit measurable responses, even though it was modelled on naturalistic stimuli. Nonetheless, the values in our stimuli correspond roughly to the minimum (dark condition) and mean (bright condition) reported for the peri-iridal tissues of pygmy marmosets in Perea-García et al. (Reference Perea-García, Ramarajan, Kret, Hobaiter and Monteiro2022). Stimuli approximating the minimum and maximum values may have been more effective. At least one previous study on chimpanzees suggests that non-human primates may not be sensitive to pictorial eye-gaze cues of conspecifics (Kano et al., Reference Kano, Kawaguchi and Hanling2022), although this could have been due to motivational factors (i.e., enacting gaze aversion upon the perception of direct gaze). Some primates, however, have been shown to perceive very subtle changes in eye appearance (Shafiei et al., Reference Shafiei, Reik, Görner, Taubert, Giese and Thier2025).
A third possibility is that arousal levels during testing were uniformly high, potentially masking any subtle differential effects of stimulus type. While we included a 7-day habituation period and confirmed that animals were feeding normally and not exhibiting signs of distress, we lacked a ‘control-control’ condition involving no stimulus at all. Without this baseline, we cannot fully exclude the possibility that all stimulus presentations (regardless of pigmentation) elicited elevated arousal simply due to the presence of a screen or the structure of the apparatus. Anecdotally, some behaviours indicative of mild stress or alertness were present across trials, including self-directed behaviours and startle responses. This generalized arousal could have flattened any differences that might otherwise have emerged.
Relatedly, there is the possibility that animals habituated because we presented them with standardized eyes for a prolonged period. Even though our analyses did not identify a clear habituation effect, there were weak trends in some cases, and visual inspection suggests as much – time spent on the platform and average eating bout length appear to increase over sessions, as do J-calls. By contrast, facial expressions seemed to decrease over sessions. Interestingly, the total call number followed a condition-specific pattern, growing when the stimulus displayed closed eyes, but decreasing when it displayed either bright or dark peri-iridal tissues. These results strongly suggest that our study was underpowered. Our study could be underpowered for two main reasons. Firstly, it did not make it possible to account for individual variation in response patterns. Secondly, our sample size (n = 4) is small (although at par with animal studies with computerized tasks: e.g., Kano et al., Reference Kano, Kawaguchi and Hanling2022, n = 2; Roth et al., Reference Roth, Van Berlo, Perea‐García and Kret2025, n = 4; cf. Egelkamp & Ross, Reference Egelkamp and Ross2019). Our extended sampling period resulted in abundant data at the group level, but our sample size combined with the inability to identify individuals warrants further investigation before generalizing conclusively. This lack of power is reflected in our results as day-to-day fluctuations in factors such as animal state, time of day, or subtle environmental differences. Because animals could not be individually identified, we were unable to include random intercepts or slopes for individual subjects in our models. If some individuals were particularly sensitive to eye cues while others were not, averaging across the group could produce apparent null effects even when meaningful individual-level variation exists. Consequently, baseline estimates (closed-eyes condition) and condition effects have wide 95% credible intervals, reflecting high between-session variability, small sample size (n = 4), and low event rates for some behaviours. Moreover, our design did not allow us to distinguish whether behaviours and vocalizations were the immediate result of exposure to the stimulus or other concomitant events (e.g., other individuals eating in the proximity). While relative differences between conditions can still be assessed, detecting small effects would require more data to reliably distinguish stimulus-driven effects from background variation. Future studies with identifiable subjects, repeated measures per individual, and larger samples would be better positioned to detect such effects and disentangle signals from noise.
Our design assumes that the signalling value of lack of peri-iridal pigment is intrinsic, eliciting a fixed reaction in observers akin to a fixed-action pattern. Although the mechanisms that would make peri-iridal pigmentation a marker of temperament have not been fully specified (Sánchez‐Villagra & Van Schaik, Reference Sánchez‐Villagra and Van Schaik2019), one possibility would be learning by association that an ocular phenotype and temperament tend to co-occur. If that were the case, pygmy marmosets should have had interactions with a wide range of individuals varying in their peri-iridal appearance. We could not feasibly measure the peri-iridal pigmentation of the subjects. We also did not have access to their history of previous interactions with conspecifics. Thus, our study design is not suitable if learning plays a major role in the mechanism underlying the putative association between perceived eye appearance and temperament.
Finally – and perhaps most interestingly – the broader literature on ocular pigmentation as a social cue is itself under increasing scrutiny. While Mearing et al. (Reference Mearing, Burkart, Dunn, Street and Koops2022) reported a correlation between lack of peri-iridal pigmentation and various correlates of social tolerance across primates, methodological limitations weaken their conclusions. In particular, the small sample size per species and misclassification of peri-iridal structures (such as the temporal wedge, which was likely sampled as sclera in some individuals) complicate interpretation. When examined with more rigorous anatomical delineation, in a more adequate (actual domesticates and their respective wildtypes) and larger sample, the relationship between pigmentation and sociality appears considerably weaker and not certain (Caspar et al., Reference Caspar, Hüttner and Begall2023).
Conclusion
Taken together, our results align with recent work casting doubt on the strength or consistency of the proposed link between peri-iridal pigmentation and social behaviour. While our study does not conclusively rule out such a connection, it suggests that the behavioural significance of ocular pigmentation, at least in marmosets, may be limited or context-dependent. Future work should aim to address the limitations in our study by including identifiable subjects with repeated measures to account for individual variation, increasing sample size and observation sessions to reduce between-session variability, and incorporating more sensitive measures such as gaze direction or looking time to detect subtle responses. Investigating species with stronger gaze aversion and more visible peri-iridal tissues in front-facing could also enhance the signal in experimental stimuli. Using minimum and maximum reported values for brightness could also enhance the effectiveness of the stimuli. Additionally, non-stimulus baseline conditions could help distinguish stimulus-specific effects from general arousal.
Supplementary material
The supplementary material for this article can be found at https://doi.org/10.1017/ehs.2026.10066.
Research transparency and reproducibility interest
The data supporting the findings of this study are available on the Open Science Framework at: osf.io/ty6xf. This repository contains the dataset and R code.
Acknowledgements
We thank the staff of the Toruń Zoobotanical Garden for their support and assistance throughout the study. We are especially grateful to the team working in the building housing the marmosets for their help and cooperation during data collection.
Author contributions
An.S. and J.O.P.G. conceived and designed the study, and built the physical set-up. F.A. and E.K. elaborated the stimuli. An.S. collected the data. A.D., S.K., and Al.S. trimmed the video materials. E.D. and M.S. coded the vocalizations. T.M. and J.O.P.G. coded the visible behaviour. J.O.P.G. analysed the data. An.S. and J.O.P.G. contributed to the first draft of the manuscript. S.W. initiated the collaboration with the zoo and assisted with the experiment logistics. Everyone reviewed the manuscript before submission.
Financial support
This research was supported by the National Science Center of Poland, grant 2023/49/B/HS6/02343.
Competing interests
The authors declare no competing interests.


 Open access

