


1. INTRODUCTION
Inertial confinement fusion (ICF) achieves high thermonuclear gain by the implosion of a Deuterium Tritium (DT) spherical shell at high velocities (Nuckolls et al., Reference Nuckolls, Wood, Thiessen and Zimmerman1972; Lindl,Reference Lindl1995; Atzeni et al., Reference Atzeni and Meyer-Ter-Vehn2004; Lindl et al., Reference Lindl, Amendt, Berger, Glendinning, Glenzer, Haan, Kauffman, Landen and Suter2004). The implosion is driven by X-ray in a conventional indirect-drive approach (Lindl et al., Reference Lindl, Amendt, Berger, Glendinning, Glenzer, Haan, Kauffman, Landen and Suter2004; Giorla et al., Reference Giorla, Bastian, Bayer, Canaud, Casanova, Chaland, Cherfils, Clique, Dattolo, Fremerye, Galmiche, Garaude, Gauthier, Laffite, Lecler, Liberatore, Loiseau, Malinie, Masse, Masson, Monteil, Poggi, Quach, Renaud, Saillard, Seytor, Vandenboomgaerde, Van der Vliet and Wagon2006; Laffite et al., Reference Laffite and Loiseau2010; Lan et al., Reference Lan, Lai, Zhao and Li2012) or by direct laser beams (Nuckolls et al., Reference Nuckolls, Wood, Thiessen and Zimmerman1972; Bodner et al., Reference Bodner, Colombant, Schmitt, Gardner, Lehmberg and Obenschain2002; Canaud et al., Reference Canaud, Fortin, Garaude, Meyer and Philippe2004a). The usual pellet contains solid DT layer that requires cryogenic system (Perin, Reference Perin2010). The implosion stands in three distinct steps named the acceleration, the deceleration, and the stagnation. The deceleration begins when the implosion velocity of the shell reaches a maximum whereas the stagnation occurs when the implosion velocity vanishes. During this stage, the shell is highly compressed up to 4000 times its initial solid density while the central part is strongly pressured and heated and becomes the hot spot. When the hydrodynamics conditions are achieved, a thermonuclear burn wave takes place in the central part and propagates toward the dense cold fuel. The thermonuclear energy delivered in this stage becomes much more greater than the driver energy employed to compressed the target. The thermodynamics conditions required to generate and sustain such burn waves are strongly connected to the maximum kinetic energy of the pellet achieved during implosion, just after the end of the laser pulse. When this kinetic energy is above a particular value, named kinetic or self-ignition threshold, thermodynamics conditions allow thermonuclear ignition and burn. At the opposite, the shell decelerates and rebounds while, in the central part, thermonuclear fusion reactions take place without delivering a big amount of energy. This case corresponds to marginally igniting targets and could be ignited by shock ignition (Betti et al., Reference Betti, Zhou, Anderson, Perkins, Theobald and Solodov2007; Ribeyre et al., Reference Ribeyre, Schurtz, Lafon, Galera and Weber2009; Canaud et al., Reference Canaud and Temporal2010; 2011; Reference Canaud, Brandon, Laffite and Temporal2012; Eliezer et al., Reference Eliezer and Martinez Val2011), impact ignition (Murakami, Reference Murakami, Nagatomo, Azechi, Ogando, Perlado and Eliezer2006; Azechi, Reference Azechi, Sakaiya, Watari, Karasik, Saito, Ohtani, Takeda, Hosoda, Shiraga, Nakai, Shigemori, Fujioka, Murakami, Na-gatomo, Johzaki, Gardner, Colombant, Bates, Velikovich, Aglitskiy, Weaver, Obenschain, Eliezer, Kodama, Norimatsu, Fujita, Mima and Kan2009), or fast-ignition (Basov et al., Reference Basov1992; Tabak et al., Reference Tabak, Hammer, Glinsky, Kruer, Wilks, Woodworth, Campbell and Perry1994; Tabak et al., Reference Tabak and Callahan2005; Atzeni et al., Reference Atzeni, Schiavi and Bellei2007; Willi et al., Reference Willi, Barringer, Bell, Borghesi, Davies, G.lard, Iwase, MacKinnon, Malka, Meyer, Nuruzzaman, Taylor, Vickers, Hoarty, Gobby, J.son, Watt, Blanchot, Canaud, Croso, Meyer, Miquel, Reverdin, Pukhov and Meyer-ter-Vehn2000; Deutsch et al., Reference Deutsch and Didelez2011). Implosion dynamics of capsule and thermonuclear gain are directly related to the twin set of target and laser pulse. Kidder-like laser pulse shape (Kidder,Reference Kidder1976) is traditionally used to directly drive the implosion of the target. Unfortunately, direct-drive does not allow shockless implosion and the isentropic compression is done while few shock propagate in the shell. Thus, each point of laser pulse shape is chosen to optimize shock timing at the interface of DT cryogenic and DT gas in order to keep the shell adiabat as constant as possible. This means that one target is designed by a twin set of size and laser pulse for an implosion velocity and an in-flight adiabat coefficient (defined as the ratio of shell pressure over fermi pressure). Usually, in order to change implosion velocity, the drive is modified.
However, the optimization of the laser pulse, usually done by adjusting shock timing, has to be correlated to final implosion stage and its observables such as the peak shell areal density or the thermonuclear energy. A fussy optimization of these lasts should lead to a modified pulse shape.
Another question concerns the influence of the laser ramp shape on the compression (areal density, thermonuclear yield...) of the target when the laser pulse departs from the Kidder-like law. Indeed, even if, Kidder's law allows to adjust the shock timing, the knowledge of the influence of temporal laser profile depends on the design defined. Indeed, the sensitivity of the design to small variations due to laser errors such as power imbalance or pointing errors is currently addressed in a multidimensional approach (Murakami et al., Reference Murakami, Nishihara and Azechi1993; Canaud et al., Reference Canaud, Fortin, Dague and Bocher2002; Temporal et al., Reference Temporal and Canaud2009; Reference Temporal, Canaud and Le Garrec2010a; Reference Temporal, Canaud, Laffite, Le Garrec and Murakami2010b; Canaud et al., Reference Canaud, Brandon, Laffite and Temporal2012). One-dimensional effect can also be considered by summing errors over the whole solid angle. The resulting laser power should depart perturbatively from the perfect laser pulse shape especially during the ramp. A modification of shock timing induced by these perturbations can, in a certain manner, be deleterious for the achievement of the thermonuclear gain and fusion requirements.
Analysis of the design response to small perturbations of the laser pulse shape should give an estimate of the robustness of the design. Our laser pulse ramp is usually defined with seven different points (twin set of power and time) and a systematic variation of points (in a 14 dimension space) in an interval centered on the nominal values should lead to more than few millions of hydrodynamics calculations. Such an approach should be tedious and time consuming. An alternative way (Primout, Reference Primout2004) consists in randomly exploring the vicinity of Kidder's law and in establishing cross-correlation of laser parameters. This should reduce the total number of calculations to few thousands.
In addition, this should improve the laser pulse shape in comparison to the Kidder's law and, in the same time, the drive power variation would lead to explore a wide interval of implosion velocity.
Our work is done in the context of the laser megajoule (LMJ) (Lion, Reference Lion2010) and the National Ignition Facility (NIF) completion and the quest for high gain inertial fusion (Moses, Reference Moses2012). This paper addresses the response of a baseline direct-drive design to random variations of its Kidder's like laser pulse ramp. Our approach concerns new designs to whom implosion velocities (in the range 250–370 km/s) are lower than the ones currently encountered in conventional direct drive (Canaud et al., Reference Canaud, Garaude, Clique, Lecler, Masson, Quach and Van der Vliet2007; McKenty et al., Reference McKenty, Sangster, Alexander, Betti, Craxton, Delettrez, Elasky, Epstein, Frank, Glebov, Goncharov, Harding, Jin, Knauer, Keck, Loucks, Lund, McCrory, Marshall, Meyerhofer, Regan, Radha, Seka, Skupsky, Smalyuk, Soures, Thorp, Wozniak, Frenje, Li, Petrasso, Seguin, Fletcher, Padalino, Freeman, Izumi, Koch, Lerche, Moran, Phillips, Schmid and Sorce2004) or indirect drive fusion (Lindl et al., Reference Lindl, Amendt, Berger, Glendinning, Glenzer, Haan, Kauffman, Landen and Suter2004; Giorla et al., Reference Giorla, Bastian, Bayer, Canaud, Casanova, Chaland, Cherfils, Clique, Dattolo, Fremerye, Galmiche, Garaude, Gauthier, Laffite, Lecler, Liberatore, Loiseau, Malinie, Masse, Masson, Monteil, Poggi, Quach, Renaud, Saillard, Seytor, Vandenboomgaerde, Van der Vliet and Wagon2006; Laffite et al., 2010). These new designs could be used for shock ignition or fast-ignition.
The paper is organized as follow. The first section introduces baseline designs. A random walk optimization method is presented in the next section. It is based on one-dimensional numerical calculation of target implosion. Input and output parameters are given for two distinct targets defined by an initial aspect ratio of 3 and 5. Then, the third section is devoted to the analysis of the numerical results while the last section focuses on the consequences of random realization of target designs.
2. DIRECT-DRIVE DESIGNS
We consider spherical cryogenic DT layer at density of 250 kg/m3 surrounding a central DT gas (with a density ρ = 0.3 kg/m3) with a thick CH overcoat (ρ = 1070 kg/m3) in order to improve the laser absorption (Canaud et al., Reference Canaud, Fortin, Garaude, Meyer, Philippe, Temporal, Atzeni and Schiavi2004b) in comparison to the All-DT material (McKenty et al., Reference McKenty, Sangster, Alexander, Betti, Craxton, Delettrez, Elasky, Epstein, Frank, Glebov, Goncharov, Harding, Jin, Knauer, Keck, Loucks, Lund, McCrory, Marshall, Meyerhofer, Regan, Radha, Seka, Skupsky, Smalyuk, Soures, Thorp, Wozniak, Frenje, Li, Petrasso, Seguin, Fletcher, Padalino, Freeman, Izumi, Koch, Lerche, Moran, Phillips, Schmid and Sorce2004; Atzeni et al., Reference Atzeni, Schiavi and Bellei2007). DT fuel mass (roughly 300 µg) is similar to payload fuel masses currently encountered in ICF (Laffite et al., 2010; Atzeni et al., Reference Atzeni, Schiavi and Bellei2007). The CH thickness is chosen large enough to keep small dense layer at the end of the laser pulse. The target dimensions explore two distinct initial aspect ratios A (defined as the DT-ice inner radius over the DT-ice thickness) A = 3 and A = 5 (Fig. 1). In comparison, HiPER target (Atzeni et al., Reference Atzeni, Schiavi and Bellei2007) have an initial aspect ratio of ~7 in considering only payload fuel for fast ignition. Direct drive target for laser megajoule (Canaud et al., Reference Canaud, Fortin, Garaude, Meyer, Philippe, Temporal, Atzeni and Schiavi2004b) is defined with an initial aspect ratio of ~7.7. Recent studies (Schmitt et al., Reference Schmitt, Bates, Obenschain, Zalesak, Fyfe and Betti2009; Bates et al., Reference Bates, Schmitt, Fyfe, Obenschain and Zalesak2010) propose target with an initial aspect ratio of ~2.1 for shock ignition.
Target design : A = 3 (left) and A = 5 (right).
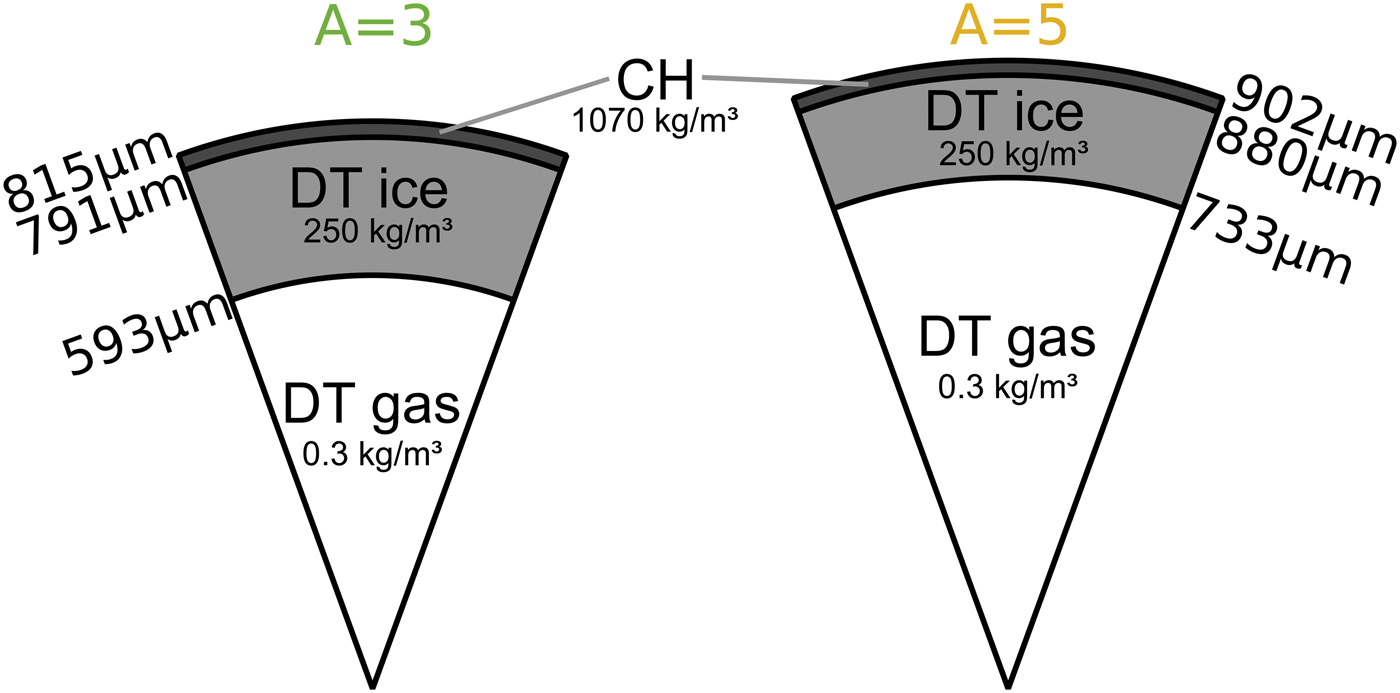
For a given laser energy, a lower initial aspect ratio leads to a lower implosion velocity and combined with a larger thickness this should lead to a better hydrodynamic stability. Assuming a best burn fraction of 30%, 300 µg mass should deliver a thermonuclear energy around 25 MJ.
Kidder-like laser pulses (cf Fig. 2) present three distinct parts: the foot, the ramp, and the drive. The foot, at a low laser power level, creates a first shock in the capsule which places the fuel on the right in-flight adiabat αif = P[MPa]/2.17ρ5/3[kg/m 3] ~ 1.2. Here, we consider an ablation pressure (P a) during foot of 300 GPa produced by a foot laser power lower than 1 TW. The second part of laser pulse is the ramp-up. Its goal is to increase the external imploding pressure without increasing the internal energy of the DT shell while successive shocks are sent through out the spherical pellet. They emerge to the inner target side at successive times and the ramp is built to adjust time delay at roughly 0.3 ns. This particularly ramp produces a quasi-isentropic compression, and αif stays close to 1 during the acceleration phase. The drive part of the laser pulse is the maximum laser power plateau which gives the desired implosion velocity of the shell. The laser pulses shown on Figure 2 produce a peak implosion velocity close to 300 km/s and reach peak areal densities of 18 kg/m2 and 13 kg/m2 for A = 3 and A = 5, respectively. Peak areal density ρR is defined as the maximum of areal density reached during the implosion and especially during the deceleration phase. Designs do not ignite.
Kidder-like laser pulses associated to both targets defined in Fig. 1.

These laser pulses are the starting point of our study presented here. Criteria used to quantify properly the laser pulse modifications are the peak areal density under the self-ignition threshold and the maximum thermonuclear energy above it using minimum incident energy.
Calculations are performed using the one-dimensional (1D) Lagrangian radiation-hydrodynamics code: FCI 1D (Buresi et al., Reference Buresi, Coutant, Dautray, Decroisette, Duborgel, Guillaneux, Launspach, Nelson, Patou, Reisse and Watteau1986). It includes tabulated equations of state (e.g., SESAME), flux-limited Spitzer heat transport (here the flux limiter is set at 6%), multi-group radiative transfer, 1D normal-incidence ray-tracing with refraction, multi-group alpha-particle transport, and neutron transport. Degeneracy of the fuel during the deceleration is taken into account in the thermal conductivity using a harmonic average between Spitzer and the Hubbard (Reference Hubbard1966) model that is validated by quantum molecular dynamics calculations (Recoules et al., Reference Recoules, Lambert, Decoster, Canaud and Clerouin2009).
3. RANDOM PROCEDURE
The method is based on a random Monte Carlo procedure. Each point of the laser pulse ramp defined in Figure 2 is chosen randomly in order to generate new laser pulse shapes. Previous studies have shown that it is very efficient in many different problems of optimization (Primout, Reference Primout2004; Canaud et al., Reference Canaud, Fortin, Garaude, Meyer, Philippe, Temporal, Atzeni and Schiavi2004b; Reference Canaud, Fortin, Garaude, Meyer and Philippe2004a) in large-dimension space of parameters. All points are perturbed randomly around their initial positions in a defined intervals to shape a new laser pulse. Nevertheless, the drive duration is kept constant at 1.8 ns.
Because the foot power and the drive duration are given, there are six random times and five random laser powers. Time intervals can not overlap and laser power of first points is limited to low level. We have also relaxed the drive power and thus implosion velocity should change. About 3000 computations have been realized for each target in a first run with large intervals to cover large implosion velocities. Then, we employed a refinement method to explore specific or underpopulated areas. Successive refinements are realized by adjusting intervals boundaries of parameters. This is done by following the evolution of each time and power points in function of results. By doing this, we notice that the previous results obtained by using a Kidder's law can be improved and an ideal value of each input parameter can be obtained. The parametric space of results is meshed with a regular grid and we estimate an average value in each cell. We follow for each input parameters (time and power) its trend in function of implosion velocity, thermonuclear energy, areal density, and incident energy. This method requires enough points on boundaries of output data space to be efficient. For instance, Figure 3 represents the trend of the time t 4 as a function of the thermonuclear energy and the implosion velocity space.
Example of the refinement method used : trend of an input parameter (time t4 in ns on this figure) for A = 3 target as a function of implosion velocity (V) and thermonuclear energy (E Th). If time t4 increase in interval represented, implosion velocity and thermonuclear energy increase. If we want to explore specific area, it needs to select values refered by this method. This analysis is realized on each random time and power, and allows to define efficient refinements in function of areas to explore.

Results of these successive random realizations are the clouds shown in Figure 4. These figures present the thermonuclear energy and the peak areal density in function of implosion velocity, and the absorbed energy in function of areal density for both initial aspect ratios. More than 5000 hydrodynamic calculations have been realized. Each point is the result of a computation for a new laser pulse shape. Implosion velocities cover a range from 250 km/s to 370 km/s. The peak areal density spreads from 1 to 19 kg/m2 while the absorbed energy from 150 to 300 kJ. We also observe that the thermonuclear energy covers a wide range between 1 kJ and 30 MJ. It can be seen also, in the last case, a transition between marginally and self-igniting target designs which deliver high thermonuclear energy.
Results of successive refinement for A = 3 (top) and A = 5 (bottom): thermonuclear energy (left) and areal density vs implosion velocity (center), and absorbed energy as a function of areal density (right).

Bounds of intervals have to be chosen correctly in order to not truncate the space of result. Criteria used are the peak areal density under the self-ignition threshold and the thermonuclear energy above. A threshold value at 90% of (ρR)max is fixed for all computation results. First, we checked that computations cover the most uniformly all parameter intervals and, then, the refinement method changed the interval boundaries. Thus, extreme parts of interval are under populated. The histogram of all computations for all superposed intervals (full and refined ones) shows that interval boundaries are under populated. However, it is not a crucial problem as far as the maximum number of computations satisfying the areal density criteria is not close to boundaries of the interval. Such measurement represents a kind of distribution function of parameters satisfying the optimization criteria and this distribution function must have a peak centered on the center of the parameter range in order to cover all optima possibilities.
As an example, we represent in Figure 5 the distribution function for all random realizations of parameter t 4 [ns] as well as for the selected realizations that satisfy the criteria of 90% of (ρR)max. The full-realization distribution function has a maximum due to the successive refinements done during the optimization process. The selected distribution function, for parameters satisfying the criteria ρR ≥ 90% (ρR)max, is also represented (in orange). It can be seen also that the peak of the selected distribution is roughly centered on the parameter interval of realization. We checked this for all parameters.
Example of histograms traced to verify the validity of intervals refinements for the fourth time t 4 [ns] (top: A = 3, bottom: A = 5). Green part represents all random realizations while orange one represents the part of results that have areal density greater than 90% of maximum areal density.

4. ANALYSIS OF THE RANDOM REALIZATIONS
The Monte-Carlo procedure has produced a wide variety of target designs covering implosion velocities from 260 to 370 km/s. The interest of such approach is that the results consist in a data base of imploding targets with different implosion specificities. A comparison between two different class of targets, referenced by their initial aspect ratio is now available. In a first step, we focus on the correlations between input and output data by the mean of a correlation matrix
4.1. Correlation matrix
A first matrix B of N × 17 parameters is built, N being the number of random realizations. For each aspect ratio, the input and output data are summarized as following: six times (t 2 to t 7), five powers (P 3 to P 7) , peak density (ρ), peak areal density (ρR), peak ionic temperature (T i), peak implosion velocity (V), absorbed energy (E A), and thermonuclear energy (E th):
 $$\eqalign{B &= \left(\matrix{ t_2 & \cdots & P_7 & {\rm {\rm \rho}} & {{\rm {\rm \rho}}}R & T \cr b_{1\comma 1} & \cdots & b_{1\comma 11} & b_{1\comma 12} & b_{1\comma 13} & b_{1\comma 14} \cr b_{2\comma 1} & \cdots & b_{2\comma 11} & b_{2\comma 12} & b_{2\comma 13} & b_{2\comma 14} \cr \vdots & \ddots & \vdots & \vdots & \vdots & \vdots \cr b_{N\comma 1} & \cdots & b_{N\comma 11} & b_{N\comma 12} & b_{N\comma 13} & b_{N\comma 14} }\right. \cr &\left. \matrix{ V & E_a & E_{Th} \cr b_{1\comma 15} & b_{1\comma 16} & b_{1\comma 17} \cr b_{2\comma 15} & b_{2\comma 16} & b_{2\comma 17} \cr \vdots & \vdots & \vdots \cr b_{N\comma 15} & b_{N\comma 16} & b_{N\comma 17} \cr } \right)}$$
We then build the square correlation matrix C:
 $$\eqalign{ C &= \left(\matrix{ t_2 & \cdots & P_7 & {\rm {\rm \rho}} & {{\rm {\rm \rho}}}R \cr 1 & \cdots & c_{1\comma 11} & c_{1\comma 12} & c_{1\comma 13} \cr c_{2\comma 1} & \cdots & c_{2\comma 11} & c_{2\comma 12} & c_{2\comma 13} \cr \vdots & \ddots & \vdots & \vdots & \vdots \cr c_{17\comma 1} & \cdots & c_{17\comma 11} & c_{17\comma 12} & c_{17\comma 13} \cr }\right. \cr &\left. \matrix{ T & V & E_a & E_{Th} \cr c_{1\comma 14} & c_{1\comma 15} & c_{1\comma 16} & c_{1\comma 17} \cr c_{2\comma 14} & c_{2\comma 15} & c_{2\comma 16} & c_{2\comma 17} \cr \vdots & \vdots & \vdots & \vdots \cr c_{17\comma 14} & c_{17\comma 15} & c_{17\comma 16} & 1 \cr }\right)\comma \; }$$
with c i,j = c j,i for i ≠ j, c i,i = 1, and 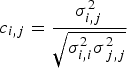 $c_{i\comma j} = {{\rm {\rm \sigma}}_{i\comma j}^2\over \sqrt{{\rm {\rm \sigma}}_{i\comma i}^2{\rm {\rm \sigma}}_{\,j\comma j}^2}}$. σi,j2 are the covariance elements:
 $${\rm {\rm \sigma}}_{i\comma j}^2 = {1\over N-1}\sum_{n=1}^{N}\lpar b_{n\comma i}-\bar{b}_{i}\rpar \lpar b_{n\comma j}-\bar{b}_{\,j}\rpar .$$
where 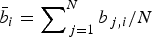 $\bar b_i=\sum\nolimits_{\,j = 1}^N {b_{\,j,i} /N}$ is the average of b j,i over the random realizations.
We used the same criteria than previously on the peak areal density to compute correlation coefficients. Laser pulse shapes that give more than 90% of the maximum peak areal density are selected. For A = 3, computations give more than 2000 samples that reach a peak areal density greater than 16 kg/m2 while for A = 5, only 1000 random realizations produce a peak areal density greater than 14 kg/m2 and are used to compute correlation matrix .
Correlation matrices are shown in Figure 6 for both initial aspect ratio. Coefficients are normalized to unity and higher the matrix coefficient, stronger the correlation is. For both initial aspect ratio, there are no specific correlations in the input parameter space (times and laser powers). However, if we look at the areal density, there is a slight correlation with P6, t7, and anti-correlation with t6, in other word, there is a correlation of areal density with higher energy before drive. A correlation between drive power (P7) and implosion velocity, and with the absorbed energy is confirmed, as it could be predicted. Similarly to the correlation between thermonuclear energy and temperature, densities and areal densities are, also, strongly correlated.
Correlation matrix (C) computed for results areal density upper than 90% of (ρR)max for each aspect ratio (top: A = 3, bottom: A = 5), as a function of the input (t i, P i) and output (ρ, ρR, T, V, E a, E Th) parameters.

However, correlations are different between A = 3 and A = 5. For A = 3, density is mainly linked to areal density and slightly to the temperature and thermonuclear energy. For A = 5, density is first linked to the thermonuclear energy, and after to the temperature, and the areal density. Finally, thermonuclear energy appears to be more sensitive to others output data for A = 5 than for A = 3. This sensitivity is not well understood and calculations should have to be performed to have a clearest explanation. However, one possible explanation comes from the relative number of high gain realizations. In the case A = 5, there are more realizations above the ignition threshold than in the case A = 3. As the target ignites, all the hydrodynamics data (temperatures, peak densities and peak areal densities) are affected by the thermonuclear reactions which alter the deceleration and stagnation stages. Thus, correlations between all these hydrodynamic data are amplified. This could be the reason why the sensitivity of the case A = 5 is higher than for A = 3.
4.2. Effects on target designs
We now address the results from the target design point of view. The first consequence that we observe is that the maximum areal density can still be improved in comparison to the first optimization done for the A = 5-design while for A = 3, the optimum seems reached. Finally, results are still Kidder-like laser laws but the shock timing could be different.
The case A = 5 is rather different than A = 3. We can remark that optimized A = 5 laser pulse shape obtained from the random method are similar to Kidder's law but with longer and less powered laser pulses as seen in Figure 7. The areal density evolves from 13 kg/m2 to 16 kg/m2 for the first Kidder's law and the randomized Kidder's law optimizations respectively. These results seem to indicate that Kidder's like law has to be modified and adjusted in oder to obtain highest areal densities while keping the same in-flight adiabat and implosion velocity. On another hand, for A = 3, we did not observe such kind of behavior. Indeed, the random calculations show an optimal drive duration of the same order than the initial optimization done by shock timing. We have not developed further this aspect because it is out of the scope of the paper but this axis of investigation is interesting because it implies that the optimal drive duration could be dependent on the initial aspect ratio.
Initial (dashed lines), optimized (dark square) laser pulses and optimization area (in grey) generated by random realizations.

From the correlation matrices, it can be also concluded that when laser ramps vary randomly inside an area defined by the criteria ρR ≥ 0.9ρR max, there are no specific correlations between the points in the ramp and with the implosion characteristics (for a given implosion velocity). This gives the tolerance of the target design to random fluctuation of the laser facility. The criteria ρR ≥ 0.9ρR max, for a given implosion velocity, leads to tolerances on each point of laser ramp (cf Fig. 7). It is almost the same for different implosion velocities but rather different between A = 3 and A = 5.
These tolerances are summarized in Table 1 which gives the twin set of laser pulse points for the optimization and both envelopes, defining the upper and the lower limits of the requirement ρR ≥ 0.9ρR max.
List of twin set of times (in ns) and powers (in TW) for optimized (opt.) and envelope (min and max) laser pulses for an implosion velocity of 300 km/s

That means that every laser pulse exploring the grey part of Figure 7 should drive an implosion at a peak velocity of 300 ± 3 km/s and a peak areal density of 18 ± 1 kg/m2 and 15 ± 1 kg/m2 for A = 3 and A = 5, respectively.
A last aspect concerns the variation of the implosion velocity with the drive power. When this last varies while the ramp stands in its optimized area, the total ablated mass and the total payload mass are not constants and consequently the peak implosion velocity varies. In all previous calculations, we warrant that the fuel mass is not impacted by laser energy. At the end of the laser pulse, it is possible that residual mass of CH is still present. The maximum peak areal densities stay close to 19 kg/m2 and 16 kg/m2 for A = 3 and A = 5, respectively, when the implosion velocity varies. Thicker the target, higher the peak areal density is, for fixed implosion velocity. Self-ignition threshold is easily seen for both targets on left frames. For A = 3, self-ignition threshold is around 305 km/s and 320 km/s for A = 5. As fuel mass is constant, variation of implosion velocity is equivalent to a kinetic energy variation. The kinetic energy threshold of self-ignition is lower for A = 3 than A = 5.
5. CONCLUSION
Two different target designs are presented here with initial aspect ratios of A = 3 and A = 5 with a payload DT mass of 300 µg. A first optimization of a Kidder-like law for the laser pulse is done by adjusting shock timing at the inner side of the DT ice layer. A random variation of the pulse ramp is done in order to check the sensitivity of designs to their laser shape. This random walk method is addressed by the way of many thousand calculations. It is shown that this method leads to a better laser pulse shape to reach the maximum of the peak areal density for a given implosion velocity. This optimized laser pulse shape is very close to the previous one for A = 3 while its drive part is significantly time enlarged and power lowered for the target A = 5. A random variation of the peak power of the laser pulse leads to cover a wide range of implosion velocities (between 250 and 370 km/s), absorbed laser energies (160–300 kJ) and thermonuclear energies (3 kJ–27 MJ). Self-ignition threshold is explored for both initial aspect ratios, and we show that this threshold is achieved with lower implosion velocity for smaller initial aspect ratio. Finally, an optimized laser pulse shape is proposed for both initial aspect ratio with upper and lower bounds. In the future, for each initial aspect ratio, we plane to use these baseline designs to perform shock ignition in the context of the French Laser MegaJoule facility (Canaud et al., 2010).



