Introduction
Collaboration is a necessary ingredient for any legislative body to respond to the needs of society and craft appropriate public policy (Bratton and Rouse Reference Bratton and Rouse2011; Holman and Mahoney Reference Holman and Mahoney2018; Swift and VanderMolen Reference Swift and VanderMolen2016). Growing divisive and polarized legislative environments have led to speculation about how we might increase cooperation among legislators. Understanding the potential for consensus-building, particularly in a policy-making era characterized by stalemate and gridlock (Hinchliffe and Lee Reference Hinchliffe and Lee2016; Shor and McCarty Reference Shor and McCarty2011) is of utmost importance. Scholars, along with legislators themselves,Footnote 1 have argued that women are better than men at fostering a more collaborative environment that encourages integrative attitudes toward policy making (Barnes Reference Barnes2016; Holman and Mahoney Reference Holman and Mahoney2018; Kathlene Reference Kathlene1994; Rosenthal Reference Rosenthal1998).
Although the extant literature suggests that women have collaborative advantagesFootnote 2 when it comes to lawmaking (Barnes Reference Barnes2016; Bratton and Rouse Reference Bratton and Rouse2011; Holman and Mahoney Reference Holman and Mahoney2018; Wojcik and Mullenax Reference Wojcik and Mullenax2017), we find the mechanisms for explaining why this is the case that has not been adequately subjected to empirical tests. We think the propensity of female lawmakers to be more collaborative deserves closer examination, with a specific focus on different levels of marginalization (Barnes Reference Barnes2016; Wojcik and Mullenax Reference Wojcik and Mullenax2017) as well as the presence of certain mobilizing institutions. Building on the work of previous scholars (Barnes Reference Barnes2016; Bratton and Rouse Reference Bratton and Rouse2011; Thomas Reference Thomas1994; Wojcik and Mullenax Reference Wojcik and Mullenax2017), we argue that women’s collaborative activity is a response to their systematic exclusion from powerful positions. By working together, women can compensate for the lack of influence via more traditional and institutionalized channels.
We emphasize the role that women’s caucuses (WCs) play in cultivating these more collaborative relationships that are incentivized by marginalization. Although recent work has demonstrated the importance of caucuses in promoting female cosponsorship in the states (Holman and Mahoney Reference Holman and Mahoney2018, Reference Holman and Mahoney2019), it does not consider the ways that different levels of marginalization interact with the presence of these caucuses. Caucuses should provide an institutional arrangement that eases the costs of women working together to promote their bills and counter the impact of their systematic exclusion from leadership positions (Barnes Reference Barnes2016; Holman and Mahoney Reference Holman and Mahoney2019). We argue that when women face a lack of formal avenues for influence in the chamber, the presence of a WC makes gender-based collaboration a particularly appealing and efficient means of compensating. This perspective provides an answer to the lingering question of why some legislative settings foster more collaboration among women than others, even in the presence of a WC.
Overall, our explanation relies less on female politicians having an inherently different approach to lawmaking, rooted in the effects of biology or socialization. Instead, more cooperative behavior among female legislators comes from the combination of two factors: marginalization, when women find themselves otherwise systematically excluded from positions of power, and mobilization, when institutions reduce the costs of intra-gender networking and support women’s solidarity. We contend that these factors must be considered in combination in order to more fully understand womens’ collaborative activity in state legislatures.
After we fully articulate our argument and outline our expectations, we examine the collaborative behavior of legislators in 74 state legislative chambers from 2011 to 2014, using cosponsorship information collected from OpenStates along with hand-coded gender data. While we follow several other studies in focusing specifically on within-gender collaboration (Barnes Reference Barnes2016; Holman and Mahoney Reference Holman and Mahoney2018, Reference Holman and Mahoney2019; Kanthak and Krause Reference Kanthak and Krause2012; Schwindt-Bayer Reference Schwindt-Bayer2010; Wojcik and Mullenax Reference Wojcik and Mullenax2017), our approach explicitly compares women’s collaboration with other women to men’s collaboration with other men. We find that women are more collaborative with other women than men are with other men, both within their party and across party lines. Importantly, we find that within their own party, this collaborative advantage is conditioned by women’s marginalization and the presence of a WC. We believe that these results are important for understanding the underlying causal mechanisms that motivate greater collaboration among women. Furthermore, by emphasizing the institutional components, we can better explain the observed variation in gender-based collaboration across chambers.
Legislative Collaboration and Cosponsorship
State legislatures today are often characterized as contentious places where working together is an exception rather than the rule (Hinchliffe and Lee Reference Hinchliffe and Lee2016). This characterization has grown more pervasive as state legislatures morph into one-party dominance, with reports of “tense” and “vitriolic” moods contributing to a feeling that “lawmakers rarely feel the need to compromise.”Footnote 3 Although single-party rule may certainly have exaggerated the tensions between the majority and minority parties across state legislatures, the states remain so varied in both their institutions and membership characteristics that the extent to which the development of single-party control affects legislative alliances and collaboration should vary as well. Additionally, although polarized, parties in the United States tend to have weaker partisan constraints, suggesting reduced abilities for legislative parties to fully dictate the actions of its members (Barnes Reference Barnes2016).
We think of legislative collaboration as any inclusive action between or among legislators. Relationships among members are critical for any legislative assembly in order to develop successful legislation. Building collaborative networks is a core generative activity within legislatures for things like endorsements, reciprocity, floor vote support, and agenda-setting that would be extraordinarily difficult if operating from an individual perspective (Bratton and Rouse Reference Bratton and Rouse2011; Fowler Reference Fowler2006). In this case, one of the most visible and consistently measurable ways of evaluating legislative collaboration across various legislative contexts is from bill cosponsorship. Prior scholars have used legislative surveys to indicate collaborative networks among legislators (Sarbaugh-Thompson et al. Reference Sarbaugh-Thompson, Thompson, Elder, Comins, Elling and Strate2006; Wojcik and Mullenax Reference Wojcik and Mullenax2017), but these measures are difficult to come by for an expansive set of states and could be prone to perceptual bias. Bill cosponsorship does not suffer from these shortfalls, as it is a directly observable, recorded act of legislators cooperating in some capacity with one another.
Cosponsorship patterns capture members’ interests and agreement at the beginning of the policy-making process without the involvement of leadership. Sponsorship and cosponsorship is one of the few activities in which a legislator retains nearly full control over their decisions. Members of the US House, for instance, use it as a tool to counter partisan roll call behavior and promote bipartisanship at stages prior to the final floor vote (Harbridge Reference Harbridge2015). Cosponsorship decisions may also serve as an ideal point estimator to introduce more intraparty variation than party and leadership-driven roll call votes reveal (Aleman et al. Reference Alemán, Calvo, Jones and Kaplan2009; Barnes Reference Barnes2012; although see Desposato and Crisp Reference Desposato, Kearney and Crisp2011). At minimum, cosponsorship signals a shared interest and interactive behavior among members that is restricted in roll-call voting (Bratton and Rouse Reference Bratton and Rouse2011). Few systematic differences exist between women and men in terms of roll-call votes, especially among Republicans (Frederick Reference Frederick2009), as party, not gender, tends to be determinative at this stage (Schwindt-Bayer and Corbetta Reference Schwindt-Bayer and Corbetta2004). Cosponsorship, on the other hand, presents a clearer picture of interests and can serve as a foundation for legislative collaboration.
Cosponsorship decisions by legislators are forms of meaningful and strategic collaboration (Barnes Reference Barnes2016; Fowler Reference Fowler2006; Kirkland Reference Kirkland2011, Reference Kirkland2014; Shim Reference Shim2020; Swift and VanderMolen Reference Swift and VanderMolen2016), and indicative of issue priorities and policy significance (Kessler and Krehbiel Reference Kessler and Krehbiel1996; Koger Reference Koger2003). The act of cosponsoring legislation is influenced by a variety of legislator characteristics. In state legislatures, district proximity, ideological distance, and shared committee service all predict greater cosponsorship activity (Bratton and Rouse Reference Bratton and Rouse2011). A shared minority status, in terms of gender, race, and ethnicity, also generates more collaboration through cosponsorship (Barnes Reference Barnes2016; Bratton and Rouse Reference Bratton and Rouse2011; Holman and Mahoney Reference Holman and Mahoney2018; Rocca and Sanchez Reference Rocca and Sanchez2008; Wojcik and Mullenax Reference Wojcik and Mullenax2017).
Some of the most active cosponsors are those with less legislative power. Cosponsorship has been identified as an activity for members to engage in who are not included in the upper echelons of a legislature’s power structure. For example, those legislators with seniority status and or leadership positions are less likely to involve themselves in sponsorship and cosponsorship decisions (Bratton and Rouse Reference Bratton and Rouse2011; Rocca and Sanchez Reference Rocca and Sanchez2008). On the other hand, those without seniority or who are less likely to have leadership designations, like members with more extreme partisan views, women, and minorities, appear to rely on collaboration through cosponsorship as a way to counter their marginalized status (Barnes Reference Barnes2016; Garand and Burke Reference Garand and Burke2006; Muraoka Reference Muraoka2019; Rocca and Sanchez Reference Rocca and Sanchez2008; Wojcik and Mullenax Reference Wojcik and Mullenax2017). Cosponsorship decisions are not inconsequential as they may carry a cost. Kirkland and Williams (Reference Kirkland and Williams2014) note that bipartisan collaboration is often subjected to the norm of reciprocity, which may tie a legislator to unpopular decisions down the line. As a visible, consequential collaborative link, it is important to understand the implications of cosponsorship decisions among female state legislators and the situations that may either heighten or depress it.
Collaboration, Marginalization, and Mobilization
Previous work has established that female lawmakers engage in a more collaborative legislative style than their male counterparts (Barnes Reference Barnes2016; Rinehart Reference Tolleson-Rinehart and Dodson1991; Rosenthal Reference Rosenthal1998; Thomas Reference Thomas1994; Wojcik and Mullenax Reference Wojcik and Mullenax2017). In general, experimental studies show that women are more likely to employ democratic leadership styles, whereas men tend to lead autocratically (Eagly and Johnson Reference Eagly and Johnson1990). These tendencies are clear in legislative settings, as women have reported spending more time building coalitions in their own party as well as with the opposing party (Carey, Niemi, and Powell Reference Carey, Niemi and Powell1998; Wojcik and Mullenax Reference Wojcik and Mullenax2017).
Integrative and cooperative characteristics have been particularly well documented among female legislative leaders. For instance, female committee chairs have been shown to moderate discussion in their role rather than control testimony or direct the committee’s discussion. Rather than join in on the substantive debates, women tend to facilitate the hearings (Kathlene Reference Kathlene1994). Additionally, chairwomen report that they are more reliant on strategies that are collaborative in nature to manage their committees, although legislative professionalization appears to reduce this tendency (Rosenthal Reference Rosenthal1998). Women are also more likely to employ collaborative and cooperative strategies to conflict resolution than their male counterparts (Rosenthal Reference Rosenthal2000; Tolleson-Rinehart Reference Tolleson-Rinehart and Dodson1991; Weikart et al. Reference Weikart, Chen, Williams and Hromic2007).
Instead of treating female collaboration as the product of differences in biology or socialization between men and women, we follow recent scholars in arguing that women may collaborate with each other at greater rates as a response to their continued marginalized status (Barnes Reference Barnes2016; Bratton Reference Bratton2005; Bratton and Rouse Reference Bratton and Rouse2011; Muraoka Reference Muraoka2019; Wojcik and Mullenax Reference Wojcik and Mullenax2017). Although women have made gains in many legislatures around the world, they continue to find themselves in “positions of institutional weakness” as formal positions of power, such as leadership posts and committee chairs, tend to go to male legislators (Barnes Reference Barnes2016, 25; Hansen and Clark Reference Hansen and Clark2020).
For these reasons, we conceptualize marginalization here as the exclusion from leadership positions. Although marginalization takes many and varied forms, we choose to focus on leadership marginalization as exclusion from these gatekeeping positions hinders both formal and informal legislative power. Systematic exclusion from leadership makes it extraordinarily difficult for legislators to formally shape the policy agenda and set party and policy goals. Leadership positions also bestow tremendous power as party fundraisers and as role models within the chamber (Hansen and Clark Reference Hansen and Clark2020; Powell 2012; Smooth Reference Smooth and Reingold2008).
Although the number of women in legislatures continues to grow, access to leadership posts remains inconsistent despite these increases (Reingold Reference Reingold2019). This could be a function of discrimination and stereotyping due to the “boy’s club” nature of legislative environments (Kathlene Reference Kathlene1994), or a resulting backlash effect from women no longer serving as a token minority. Minority groups may be valued differently by the majority depending on their group size (Kanter Reference Kanter1977; Kanthak and Krause Reference Kanthak and Krause2011). In this case, women may remain systematically excluded from influential positions if the majority group feels threatened rather than granted more powerful posts as their influence grows (Barnes Reference Barnes2014; Heath, Schwindt-Bayer, and Taylor-Robinson Reference Heath, Schwindt-Bayer and Taylor-Robinson2005; Kanthak and Krause Reference Kanthak and Krause2011, Reference Kanthak and Krause2012). Chambers that marginalize female legislators from leadership positions should motivate their pursuit of alternative avenues of influence.
Increased motivation to pursue these alternatives may not automatically lead to the forming of stronger intra-gender collaborative networks by itself, however. There may be several different ways that female legislators can try to elevate their status and influence in the chamber and, among these options, collaborating with other women can be made a more or less appealing alternative by the institutional context and the social resources made available by it. Specifically, we point to the presence of a formal WC because they reduce the coordination cost of collaboration (Holman and Mahoney Reference Holman and Mahoney2018, Reference Holman and Mahoney2019; Osborn Reference Osborn2012; Reingold Reference Reingold2000; Victor and Ringe Reference Victor and Ringe2009) and can mobilize women along their shared experiences (Barnes Reference Barnes2016). In the 1970s, WCs began organizing in the states to promote policy issues and mentoring, and 23 states currently have active WCs. As one representative from Wyoming notes,” the formation of our WC led to great friendships and collegiality among the women.”Footnote 4 We believe caucuses are a key component of the legislative context that conditions womens’ collaborative activity.
Although recent work has demonstrated the importance of caucuses in promoting female collaboration in the states (Holman and Mahoney Reference Holman and Mahoney2018, Reference Holman and Mahoney2019), it does not consider the ways that different levels of marginalization interact with the presence of these caucuses. Here, we explicitly argue that WCs make forming professional relationships with other women an appealing legislative strategy to counteract their exclusion from traditional channels of influence. Because women often encounter fundamentally different legislative environments than men, we focus on intra-gender collaborative networks to discover how they respond to marginalization from leadership posts. Caucuses provide an environment for facilitating relationships among female legislators outside of the male-dominated setting of either the complete chamber or party caucus. These all-female settings encourage greater exchanges and communication, which are frequently silenced or ignored when women are in the minority (Karpowitz and Mendelberg Reference Karpowitz and Mendelberg2014; Kathlene Reference Kathlene1994). In other words, caucuses promote collaboration as a solution to marginalization and, therefore, their effectiveness at promoting female legislators’ collaborative advantage should be positively related to the degree of marginalization women face in the chamber.
While the above argument emphasizes the role of gender in the formation of collaborative relationships, it is important to note that we still expect partisanship and ideology to emerge as a dominant factors in this regard. Whereas there is some indication that women are more likely to cross the partisan divide than their male counterparts (Barnes Reference Barnes2016; Wojcik and Mullenax Reference Wojcik and Mullenax2017), it is still unclear to what extent and under what conditions this may be the case.Footnote 5 Our hope is that by explicitly considering the interaction between women’s marginalized status and the presence of caucuses we will be able to better understand this relationship.
Theoretical Expectations
Given the argument to this point, our first theoretical expectation is simply a restatement of previous findings emphasizing female legislators’ intra-gender collaborative advantage over men (Barnes Reference Barnes2016; Bratton and Rouse Reference Bratton and Rouse2011; Wojcik and Mullenax Reference Wojcik and Mullenax2017):
H1: All things equal, female lawmakers collaborate with other female lawmakers to a greater extent than male lawmakers do with other males.
Like Barnes (Reference Barnes2016), we think collaborative behavior among female legislators is the product of strategy and political necessity rather than socialization. This is not to say that we are entirely discounting the role that socialization may play. Instead, we think—like for men—a desire for greater political influence motivates women’s behavior in this regard, but their differences in behavior from men are strongly conditioned by the legislative context. Specifically, female legislators compensate for marginalization through collaboration with other female legislators (Barnes Reference Barnes2016; Holman and Mahoney Reference Holman and Mahoney2018; Wojcik and Mullenax Reference Wojcik and Mullenax2017). This leads us to our second expectation:
H1a: All things equal, female lawmakers’ collaborative advantage will be greater in chambers where women are more systematically excluded from leadership positions than in those where they are not.
Furthermore, as argued above, WCs provide networking opportunities, reduce the cost of collaboration (Holman and Mahoney Reference Holman and Mahoney2018, Reference Holman and Mahoney2019; Ringe and Victor Reference Ringe and Victor2013), and foster feelings of solidarity (Barnes Reference Barnes2016). In recent work, Holman and Mahoney (Reference Holman and Mahoney2018, Reference Holman and Mahoney2019) find WCs in the states can accelerate collaborative activity among women. We articulate a similar expectation for women’s collaborative advantage:
H1b: All things equal, female lawmakers’ collaborative advantage will be greater in chambers with formal womens’ caucuses than in those without them.
While H1b generally reiterates expectations supported by Holman and Mahoney (Reference Holman and Mahoney2018, Reference Holman and Mahoney2019), we are primarily interested in how the presence of a caucus might interact with gender marginalization to produce womens’ collaborative advantage in state legislatures. If marginalization provides female legislators with the incentive to pursue compensatory avenues of influence, caucuses should facilitate and promote within-gender collaboration as just such an avenue. Greater intra-gender collaboration, instead of a general increase in collaborative activity, with a caucus suggests female legislators are using caucuses as a tool for asserting more power within the institution. Therefore, we expect for caucuses to promote women’s within-gender collaboration most where the incentives to pursue these compensatory forms of influence are strongest:
H1c: All things equal, caucuses will be more effective at producing women’s collaborative advantage when marginalization is high than when it is low.
We provide Table 1 to further clarify our expectations in H1c. Table 1 displays the expectation that marginalization provides the motivation, while the presence of a WC directs efforts at compensating specifically toward within-gender collaboration and the female collaborative advantage. Therefore, where marginalization is low, we do not expect high levels of within-gender collaboration, regardless of the presence of a caucus, because women in these context can pursue traditional avenues of influence. However, when marginalization is high, the size of women’s advantage becomes dependent on whether they have been mobilized by a caucus or not:
Full set of expectations for women’s collaborative advantage (H1c and H2a)

Note. Cell entries are expectations for the relative size of the Female Collaborative Advantage given conditions identified on the axes.
Up to this point, we have focused on the way that gender can structure patterns of collaboration without paying much attention to partisan dynamics. However, in a time of increased polarization and partisan rigidity (Dancey and Sheagley Reference Dancey and Sheagley2013; Hinchliffe and Lee Reference Hinchliffe and Lee2016; Shor and McCarty Reference Shor and McCarty2011), we may be especially interested in whether the dynamics identified here might counteract other trends that are diminishing bipartisanship. Although bipartisan collaboration should be less common in the contemporary polarized environment, we hypothesize—based on the compensatory perspective outlined above—that female legislators will be more prone to reach out across the aisle than their male counterparts as a means for achieving greater legislative influence. We therefore hold similar expectations as those articulated in hypotheses H1–H1c but for bipartisan collaboration.
H2: All things equal, female lawmakers collaborate with other female lawmakers of the other party to a greater extent than male lawmakers do with males of the other party.
H2a: All things equal, caucuses will be most effective at producing women’s bipartisan collaborative advantage when marginalization is high than when it is low.
It is important to note that our expectations in hypothesis H2a amount to an argument that women’s marginalized status combined with the presence of a caucus may bring them together enough to overcome significant partisan differences, where men cannot. While there is no theoretical reason to reject the compensatory argument outright when applied to bipartisanship, it may be true that this effect cannot overcome that of party, especially in more polarized contexts. There is, however, little theoretical guidance to help us determine whether marginalized status or party attachment will dominate, and therefore, we treat this as an empirical question to be answered by the data.
Data and Methods
To test our hypotheses, we have collected bill cosponsorship data from 74 state legislative chambers over a 4-year period (2011–2014). While collaboration may take several shapes, we use bill cosponsorship to map out these relationships as it is the most directly measurable and potentially consequential form of legislative collaboration. Like other works, our analysis assumes cosponsorship is a meaningful decision on the part of legislators (Barnes Reference Barnes2016; Fowler Reference Fowler2006; Holman and Mahoney Reference Holman and Mahoney2018, Reference Holman and Mahoney2019; Kirkland Reference Kirkland2011, Reference Kirkland2014; Swift and VanderMolen Reference Swift and VanderMolen2016). Examining sponsorship activity allows us to better determine when, where, and among whom particular relations are likely (or unlikely) to occur. Furthermore, we chose to focus on the American states because their legislatures provide an excellent context for comparison and demonstrate variation on the key variables of interest, female marginalization, and the presence of a WC.
We obtained state legislative cosponsorship data for two sessions over the 4-year period of 2011–2014Footnote 6 from the OpenStates project. OpenStates is a government transparency nonprofit that collects publicly available state legislative data from official sources, such as state legislative websites and publications, using automated scraping techniques.Footnote 7 We verified the reliability of these data by spot checking a random sample of bills against official legislative documents. This analysis reveals that for most chambers, the OpenStates data are very accurate. In a subset of chambers, however, OpenStates fails to collect all of the sponsors for each bill. In total, we identified 11 states for which we could not obtain reliable bill sponsorship data.Footnote 8
With our sponsorship data in hand, we turn to the measurement of our dependent variables. Our dependent variables are based on a dyadic weighted count of bill cosponsorship that we aggregate to the individual legislator (see Fowler Reference Fowler2006). We weight the cosponsorship counts because unweighted counts risk overvaluing relatively meaningless cosponsorships, where large portions of the chamber or party contingent all sponsor a piece legislation.Footnote 9 For our measure, each count is weighted inversely by the total number of sponsors in an attempt to emphasize connections among fewer individuals as these should be more meaningful (Fowler Reference Fowler2006; Newman Reference Newman2001). Specifically, we calculate the dyadic weighted cosponsorship count as the following:
 $$ {W}_{ij}={\Sigma}_{\mathrm{\ell}}\left(\frac{{a_i^{\mathrm{\ell}}}_j}{n_{\mathrm{\ell}}}\right), $$
where
 $ {a_i^{\mathrm{\ell}}}_j $
is a binary indicator that takes a value of 1 when legislators
 $ i $
and
 $ j $
cosponsor bill
 $ \mathrm{\ell} $
and a 0 otherwise. This value is then weighted inversely by the total number of sponsors for bill
 $ \mathrm{\ell} $
(
 $ {n}_{\mathrm{\ell}} $
) and summed over all bills for dyad
 $ ij $
.
To produce a measure of collaboration for the individual legislator, we sum the dyadic measure over each legislator
 $ i $
. We can further specify the types of cosponsorship connections captured by the measure by only summing over dyads that meet specific criteria. For this project, we are particularly interested in within-gender and across-party/bipartisan cosponsorship. Therefore, to produce an individual-level measure of within-gender cosponsorship we sum only over those dyads where both members (
 $ i $
and
 $ j $
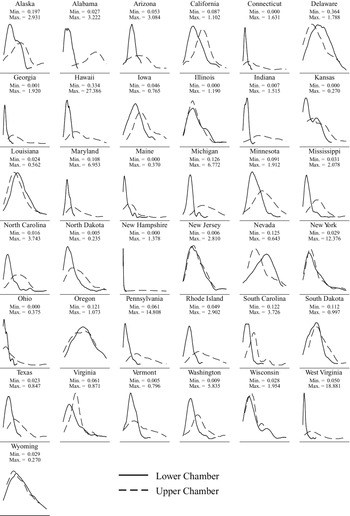
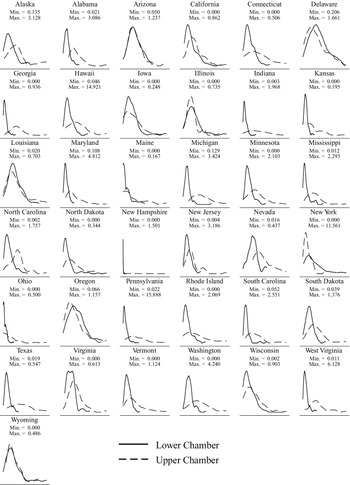
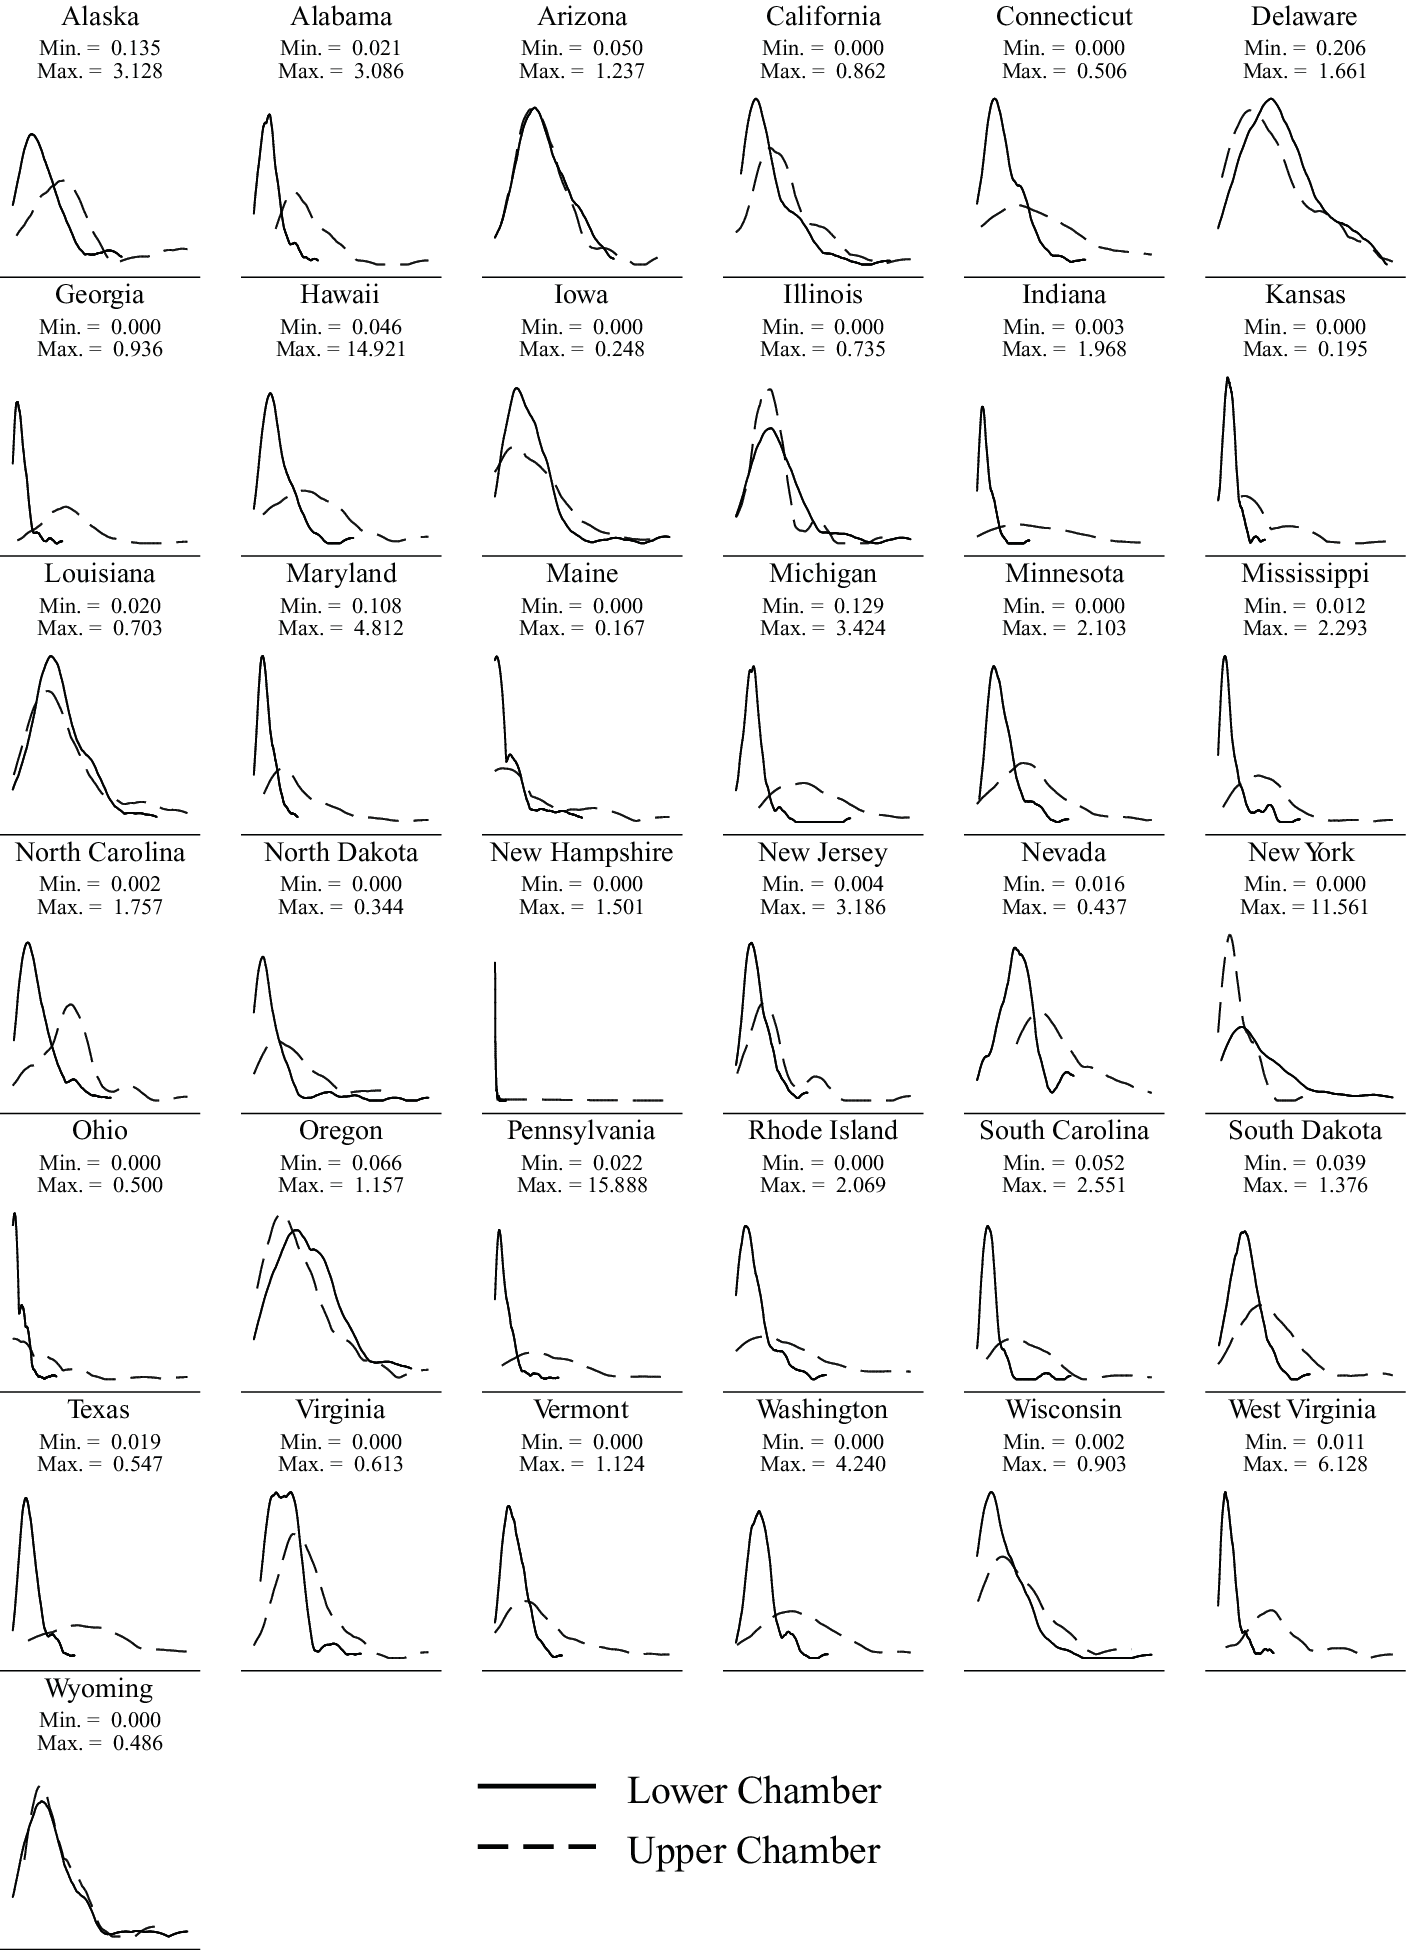
) are of the same gender. Doing so allows us to isolate collaboration among women specifically, and compare it to the propensity of men to collaborate with other men. Not only is this the appropriate comparison given our theory, considering that men dominate every chamber we examine, this approach also represents a harder test of our expectations than examining women’s connections with each other in isolation.Footnote 10 Within-gender cosponsorship allows us to separate any potential gender effects from collaborative effects that may be associated with caucuses more generally. Additionally, we calculate the bipartisan, within-gender cosponsorship score by summing over only those dyads of the same gender and differing parties. Figures 1 and 2 show the distribution of within-gender and bipartisan, within-gender cosponsorship scores across our 74 sample chambers for the study period.
Distribution of within-gender cosponsorship scores by chamber for the 2011/2012 legislative session.

Distribution of bipartisan, within-gender cosponsorship scores by chamber for the 2011/2012 legislative session.
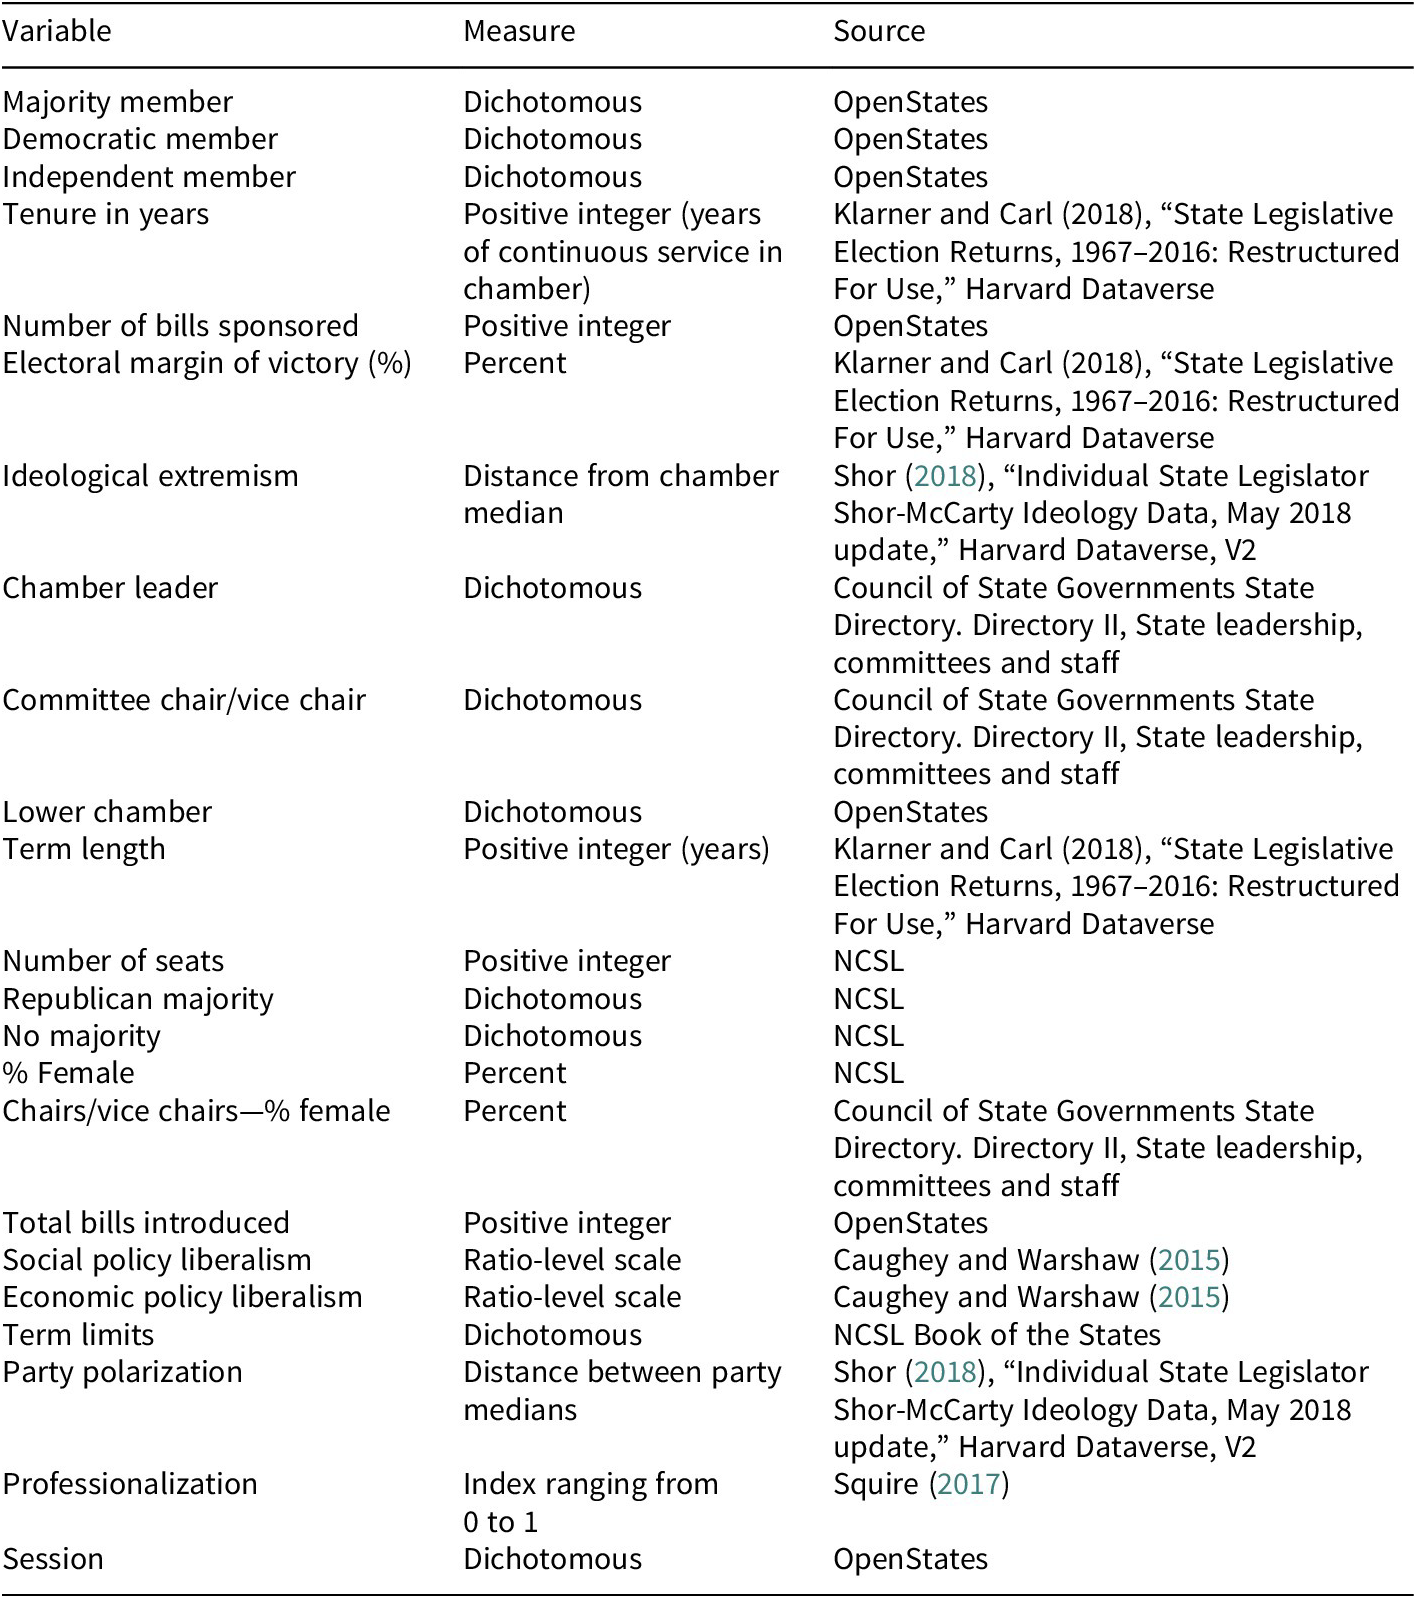
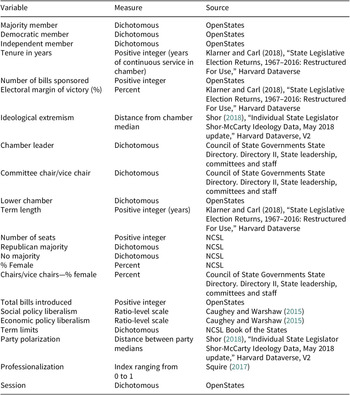
We have three primary independent variables of concern: legislator gender, gender marginalization in the chamber, and the presence of a WC. The gender of state legislators was hand coded based on photographs from legislative websites and contextual indicators. To devise a measure of gender marginalization by chamber, we focus on leadership marginalization and follow the lead of Barnes (Reference Barnes2016). Barnes conceptualized gender marginalization as women’s exclusion from positions of power within the chamber. Specifically, she examines exclusion from committee chairs and vice chairs. Committee leaders have substantial influence over the fate of bills arriving in their committee, therefore, the importance of their role in the legislative process should provide meaningful insight about women’s marginalization. Using directories of committee chairs and vice chairs produced by the Council on State Government, we calculate the proportion of all chairs and vice chairs held by women. Finally, we obtained data on the presence of WCs in the states from Holman and Mahoney (Reference Holman and Mahoney2018). In addition to these independent variables, we also control for partisan polarization (Shor and McCarty Reference Shor and McCarty2011) and other potential confounders that may affect collaborative activity. A complete list of control variables and their sources can be found in the Appendix Table A1.
Because we are testing the effects of both individual- and chamber-level variables on an individual-level outcome, we make use of hierarchical linear models with random-intercepts for each chamber. The advantage to this approach is that it addresses the within-chamber correlation among units resulting from chamber-level unobserved heterogeneity, by allowing the intercept to vary by state (Rabe-Hesketh and Skrondal Reference Rabe-Hesketh and Skrondal2012). This approach also corrects for downward biased uncertainty estimates for chamber-level covariates in standard pooled models (Bickel Reference Bickel2007). Given that we are interested in the effects of chamber-level variables—specifically relating to gender marginalization and the presence of WCs—on individual behavior, these models are the most appropriate.
Results
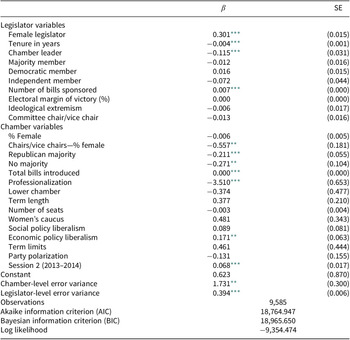
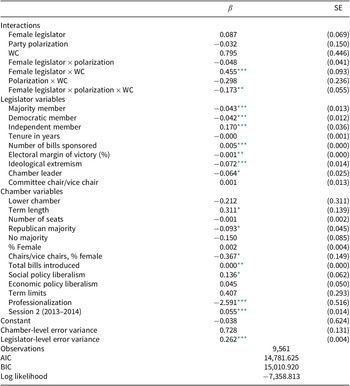
Table 2 presents the estimates of our hierarchical model of within-gender cosponsorship scores in the states. As expected, these results indicate that female legislators, all else being equal, collaborate more with other women than men do with other men. In fact, we would expect for women’s within-gender cosponsorship scores to be approximately 0.3 higher than men’s on average. While this collaborative advantage for women appears relatively small (the standard deviation for within-gender sponsorship scores is 1.6), we are nonetheless very confident in the direction of the effect. Therefore, Table 2 supports our expectation in H1.
Predictors of within-gender collaboration in 74 state chambers (additive model only)
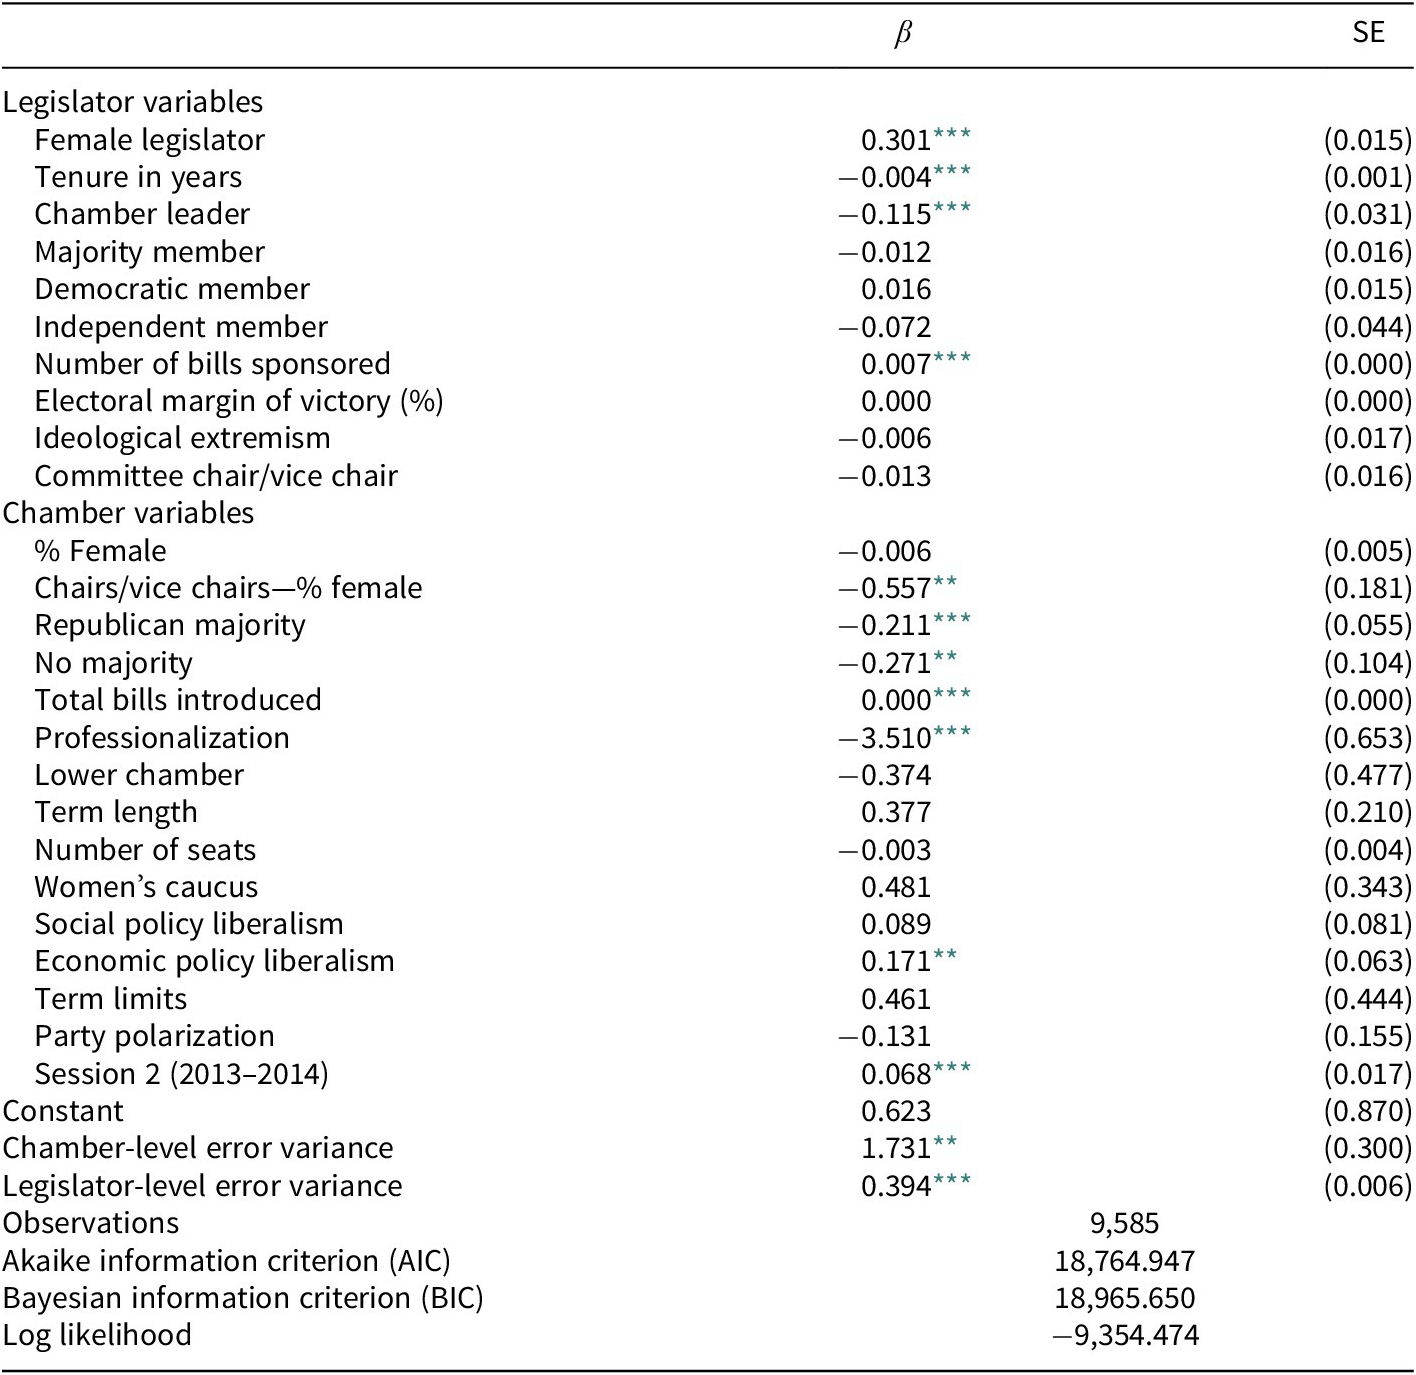
Note. Table entries are coefficients and their standard errors from a multi-level mixed effects linear model with random intercepts for each legislative chamber.
SE = standard error.
* p < 0.05;
** p < 0.01;
*** p < 0.001.
In terms of our legislator-level control variables, more experienced legislators and legislative leaders tend to be less engaged in within-gender collaboration, while general levels of activity (total bills sponsored) appears to increase within-gender cosponsorship. There are also several chamber-level controls that also appear to have an effect. Specifically, Republican and split-control chambers tend to produce less within-gender cosponsorship than Democratically controlled ones, in line with prior findings (Holman and Mahoney Reference Holman and Mahoney2018). Interestingly, women’s representation in the chamber does not appear to increase collaboration—the coefficient for the percentage of female legislators within the chamber is negative and fails to reach statistical significance. Additionally, more professionalized chambers as well as those with more women in leadership roles promote less within-gender collaboration. Chambers that are generally more active (more bills introduced) and chambers that tend to produce more liberal economic policy appear to promote more within-gender collaboration.
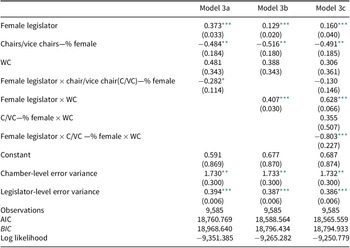
The results in Table 2 support the finding in the literature that women are more collaborative, yet we are primarily interested in further understanding the nature of this relationship. In H1a–H1c, we posit that this collaborative advantage for women is the result of efforts to counter women’s marginalization within legislative chambers, specifically through the use of WCs. As such, we expect to find that the women’s collaborative advantage is most pronounced in those contexts where women are most marginalized (H1a), where they have WCs (H1b), and where both of these conditions are met (H1b). To assess these conditional claims, we introduce interactions between legislator gender, marginalization, and the presence of a caucus into our hierarchical models and present those estimates in Table 3.
Predictors of within-gender collaboration in 74 state chambers: The interactive effects of marginalization and mobilization
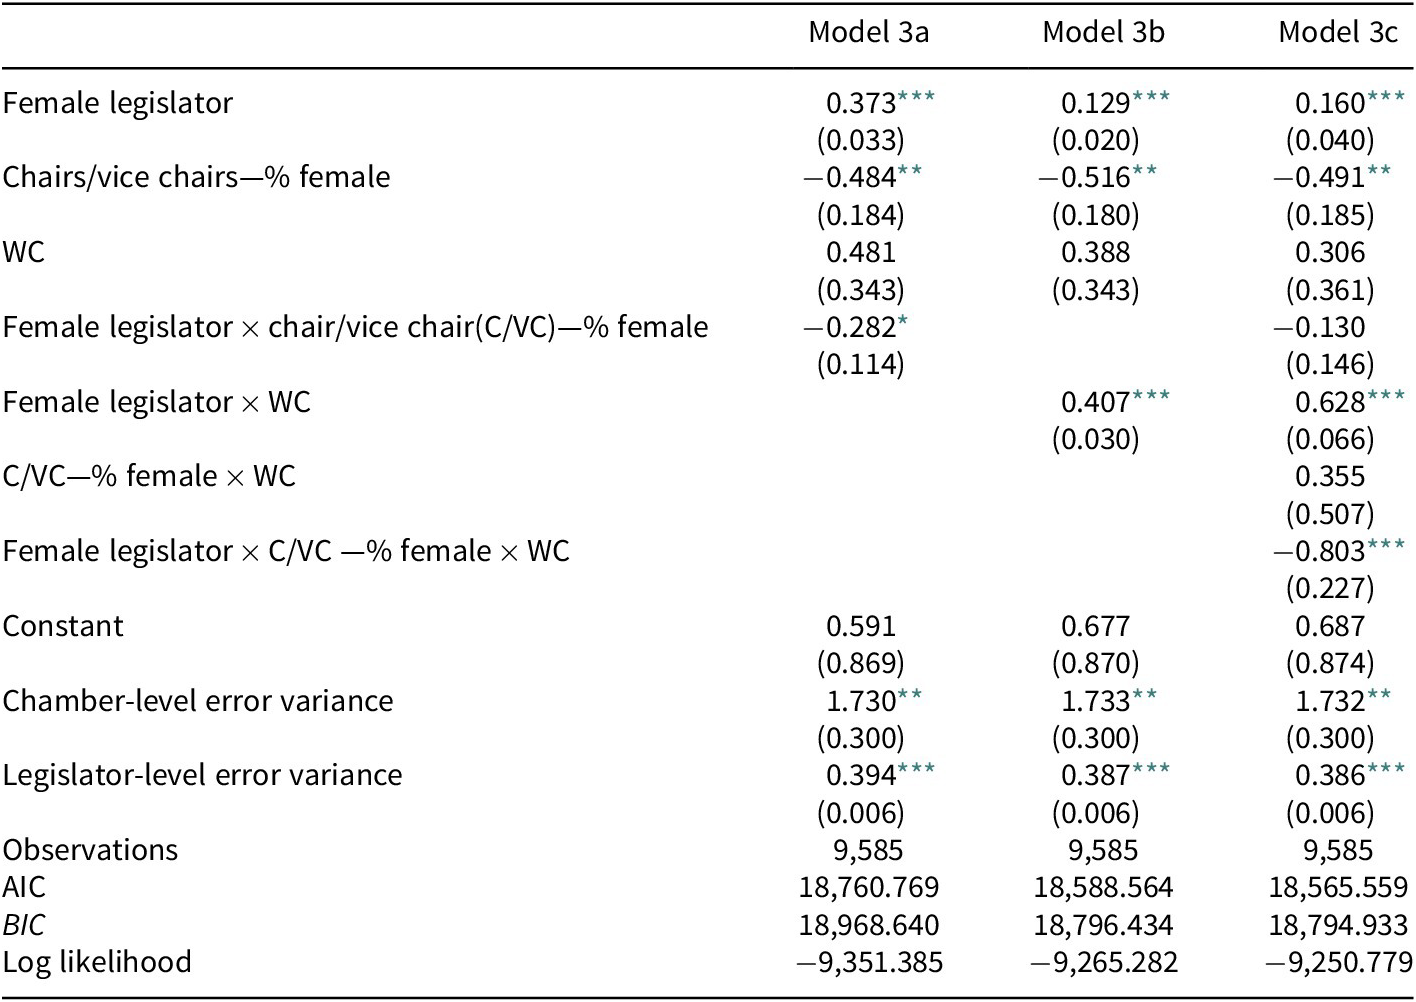
Note. Table entries are coefficients from a multi-level mixed effects linear model with random intercepts for each legislative chamber. Control variables are included in the model but not shown in the table. Standard errors are in parentheses.
WC = women’s caucuses.
* p < 0.05;
** p < 0.01;
*** p < 0.001.
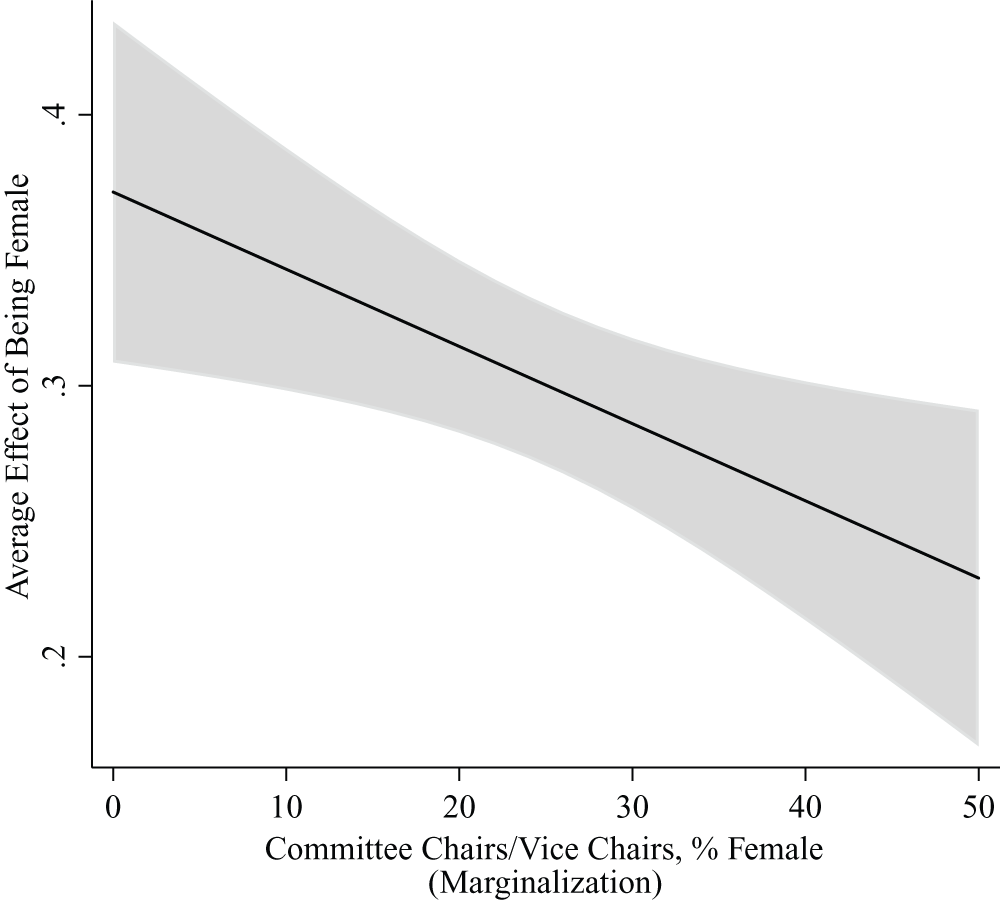
The interactions in Table 3 uncovers statistically significant conditional effects in the production of within-gender collaboration in state legislatures. Since conditional effects can be difficult to interpret from coefficients alone, we also produce several figures presenting more direct quantities of interest. Figure 3 shows the average effect of being a female legislator on within-gender cosponsorship scores at different levels of gender marginalization. Figure 3 clearly comports with our expectations in H1a, that the collaborative advantage for women will be more pronounced in chambers that systematically exclude women from leadership than those that are more inclusive. This evidence supports the foundation of our theory, that women’s collaborative advantage is a reaction to marginalization.
The marginal effect of being a female legislator on within-gender cosponsorship scores at different levels of female marginalization.
Note. Values are derived from Model 3a in Table 3. Graphs are produced in Stata using the margins and marginsplot commands. Gray area represents the 95% confidence interval.
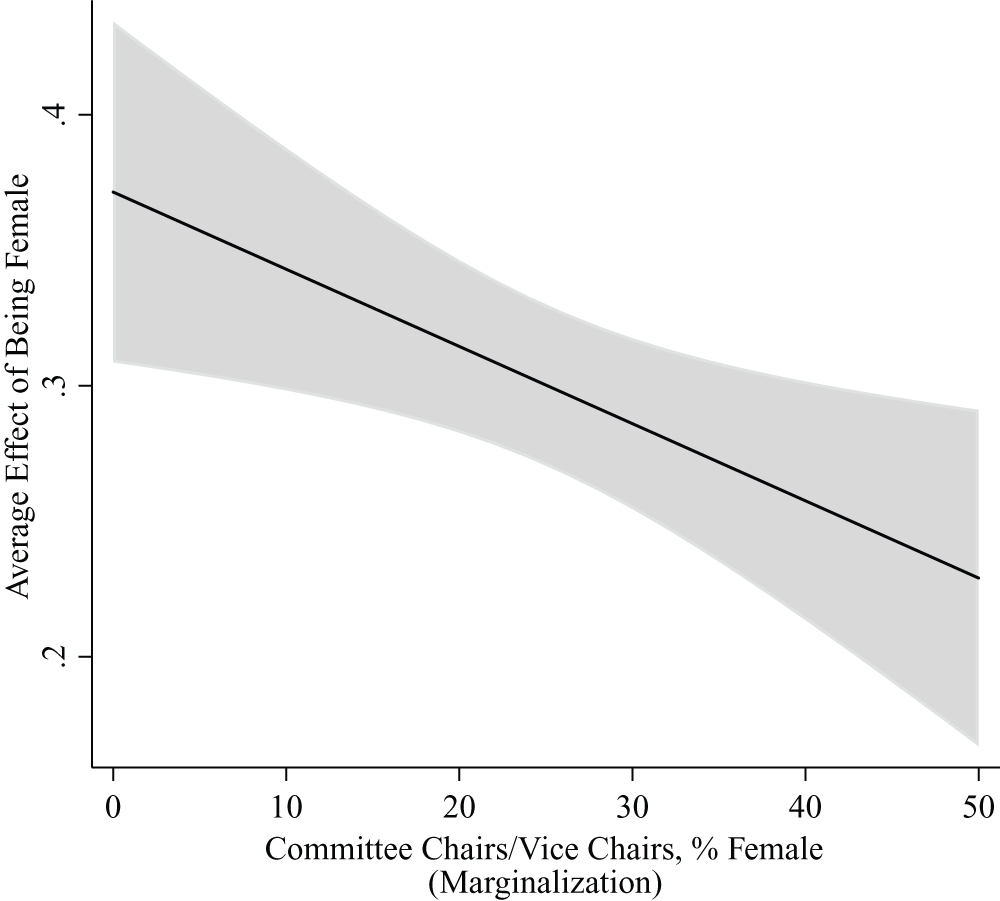
Table 4 shows the average effect being a female legislator on within-gender collaboration in chambers with a caucus versus those without. These results reinforce findings by Holman and Mahoney (Reference Holman and Mahoney2018, Reference Holman and Mahoney2019), that WCs are an important element for explaining women’s collaborative advantage. While we find evidence that women engage in more within-gender cosponsorship than men, regardless of the presence of a WC, we also find that this advantage in caucus chambers is more than four times larger than in noncaucus chambers.
The marginal effect of being a female legislator on within-gender cosponsorship scores in chambers with and without a women’s caucus

Note. Values are derived from Model 3b in Table 3.
* p < 0.05;
** p < 0.01;
*** p < 0.001.
The three-way interaction in Model 3c in Table 3 tests our conditional hypothesis related to the combined effects of the presence of a caucus and women’s marginalization from leadership in the chamber. To restate our hypothesis (H1c), we expect for WCs to function in a compensatory fashion when marginalization is high, where they serve to increase women’s power by fostering their collaboration in order to counter the marginalization of women in the chamber. Figure 4 presents the average marginal effect of being female, across the range of marginalization, for both chambers with a WC and without. The left panel of Figure 4 shows the estimated effects for chambers without a caucus. Here we see a positive and statistically significant effect for women across the range of marginalization, but this effect is quite small in magnitude compared to that in caucus chambers.
The marginal effect of being a female legislator on within-gender cosponsorship scores at different levels of female marginalization for chambers with and without a women’s caucus.
Note. Values are derived from Model 3c in Table 3. Graphs are produced in Stata using the margins and marginsplot commands. Gray area represents the 95% confidence interval.
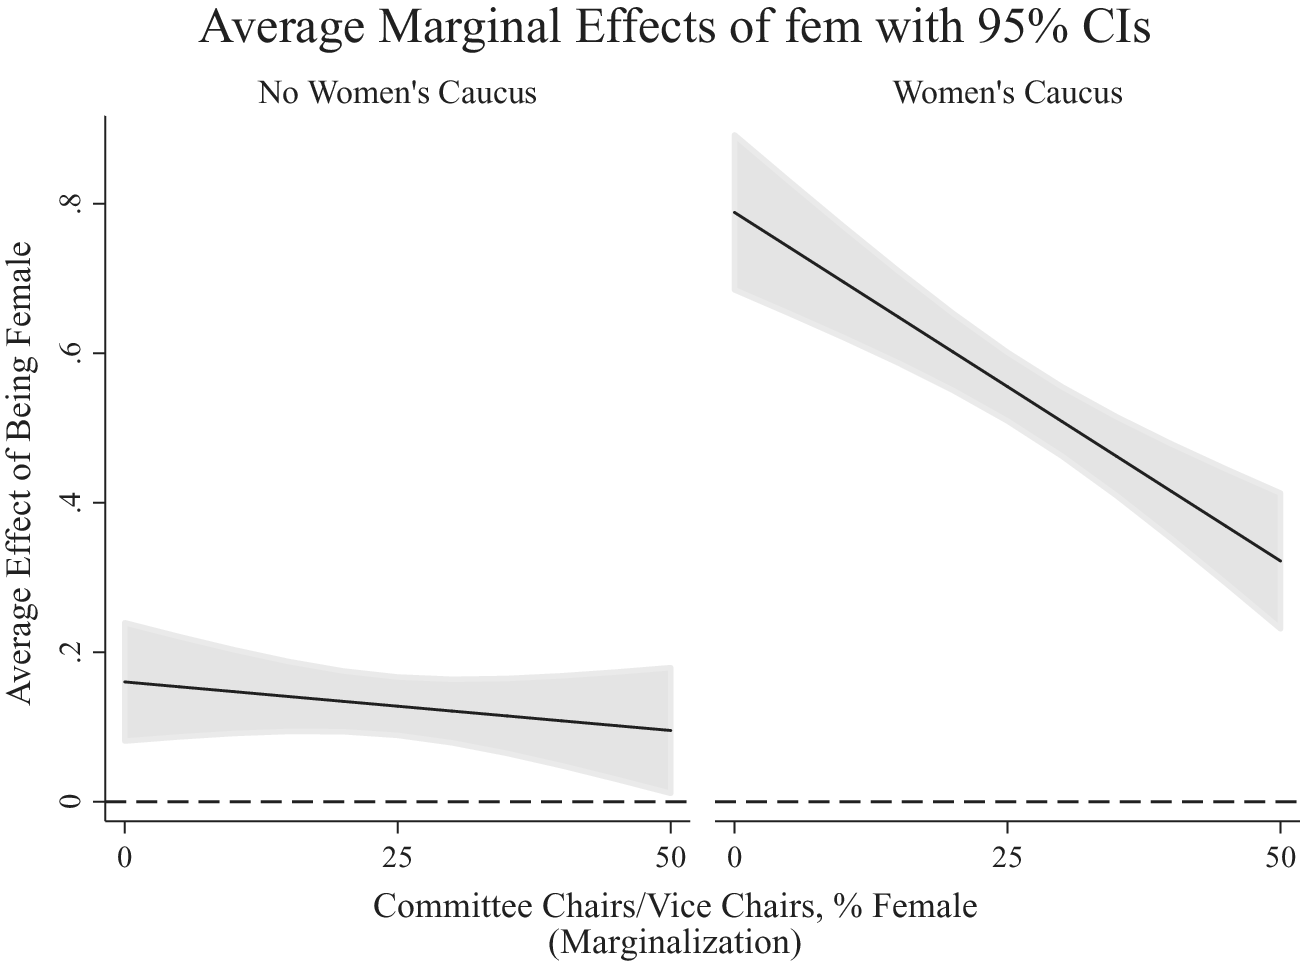
The right panel in Figure 4 shows the estimated effects of being female for chambers that do have a WC. Here, we see a very different pattern than in noncaucus chambers. First, the collaborative advantage for women is larger in caucus chambers than noncaucus chambers, regardless of the level of marginalization. In fact, where women make up none of the committee chair and vice chair positions, we expect for the women’s collaborative advantage in caucus chambers to be nearly five times that of noncaucus chambers (0.79 vs. 0.16). When women make up 50% of the committee chairs and vice chairs, this gap shrinks but is still substantial (0.32 vs. 0.09). These results strongly comport with our expectations as articulated in H1c. Although on average, women maintain a collaborative advantage even in the absence of a WC and significant marginalization, this advantage is small. In caucus chambers, however, we see the greatest advantage accruing when women have strong reasons to feel marginalized and the least when they are fairly well integrated into leadership positions. These results strongly suggest that female legislators use women’s causes as an opportunity to collaborate and more effectively exert influence in contexts where they may be denied power through more formal and institutionalized channels. As marginalization lessens, the effect on the female collaborative advantage is not as pronounced.
To this point, we have presented some substantial evidence that the collaborative advantage among female legislators is a response to conditions where women are excluded from leadership positions. WCs appear to provide the necessary resources to support the advantage, particularly when levels of marginalization are high. We have yet to assess the propensity of this advantage to overcome partisanship, however. To do so, we now turn to an analysis of the predictors of bipartisan, within-gender cosponsorship.
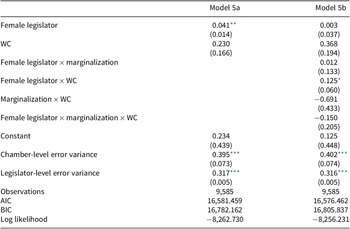
Table 5 present two models of bipartisan, within-gender cosponsorship, one purely additive (Model 5a) and the other conditional (Model 5b). The coefficient for female legislator from Model 5a is positive and significant, indicating that female legislators, on average, maintain a collaborative advantage over their male counterparts even in bipartisan cosponsorship (H2). This advantage, however, is quite small, amounting to approximately 4% of a standard deviation in bipartisan, within-gender cosponsorship scores.
Predictors of bipartisan, within-gender collaboration in 74 state chambers
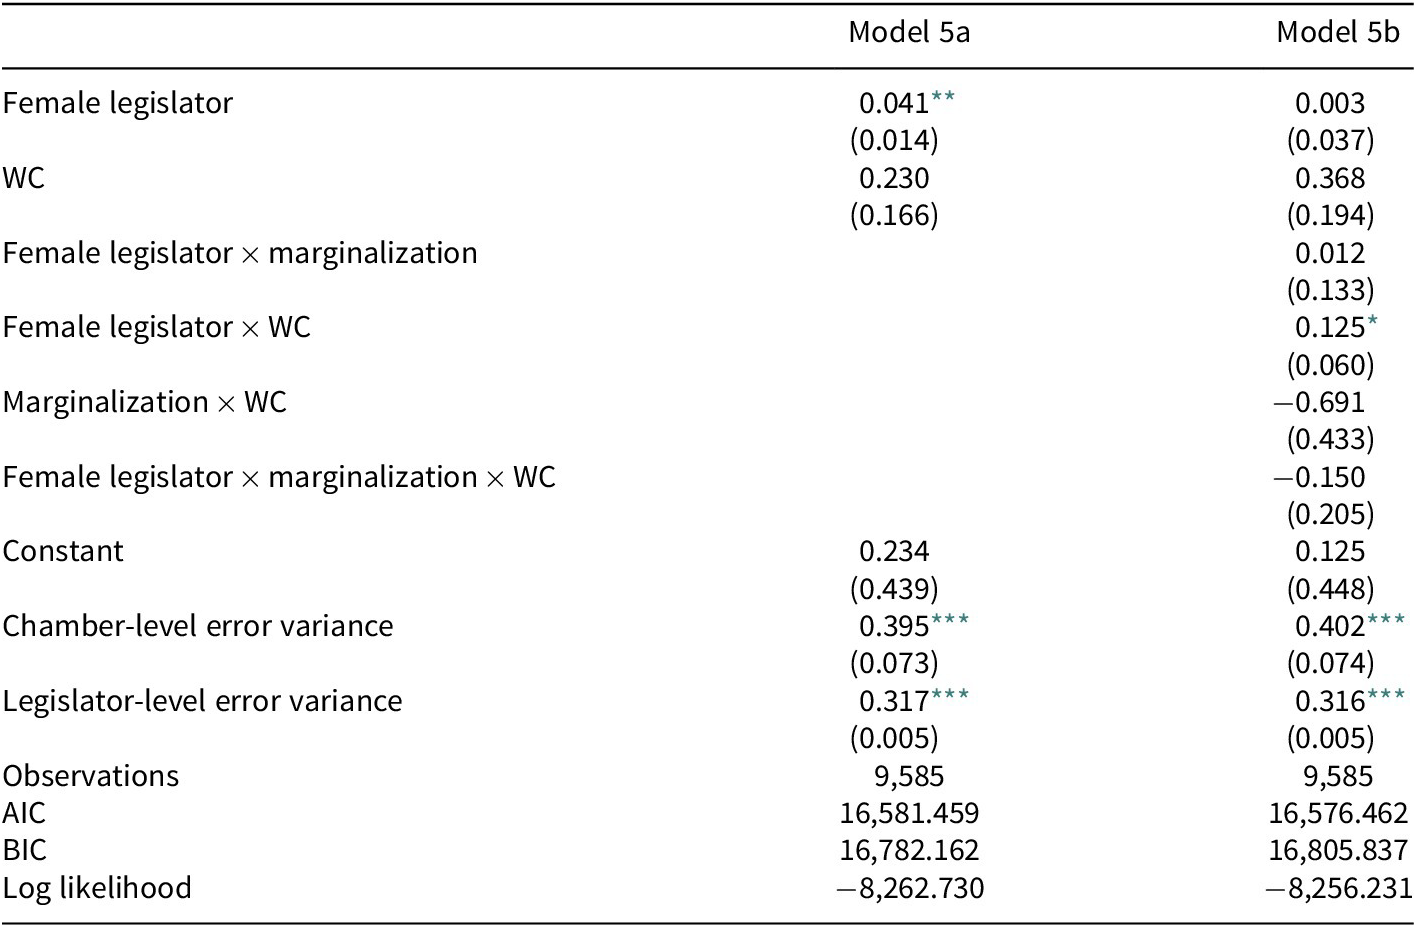
Note. Table entries are coefficients from a multi-level mixed effects linear model with random intercepts for each legislative chamber. Control variables are included in the model but not shown in the table. Standard errors are in parentheses.
WC = women’s caucuses.
* p < 0.05;
** p < 0.01;
*** p < 0.001.
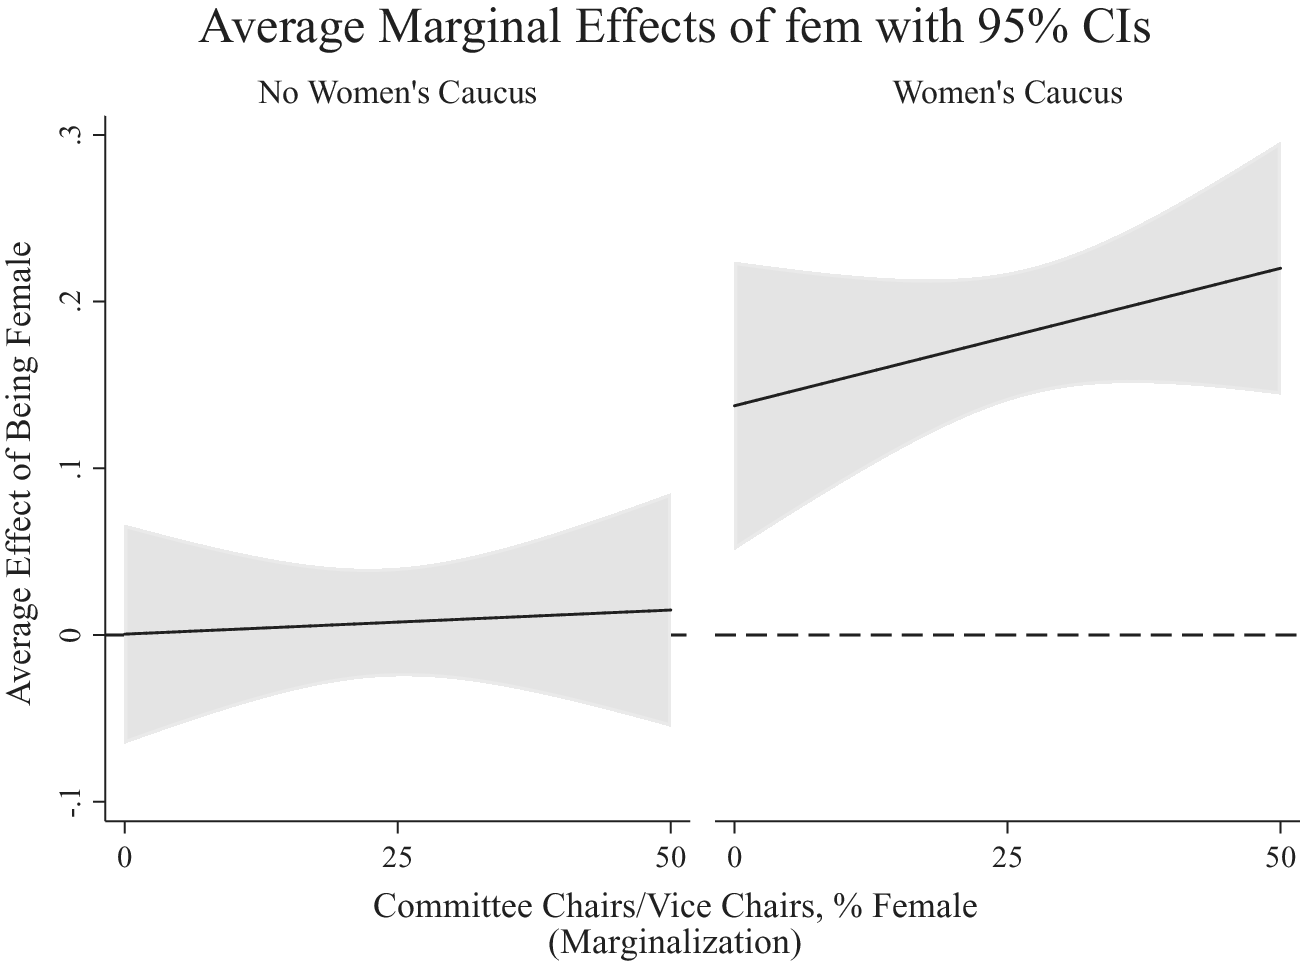
We assess our expectations in H2a, which assumes caucuses will magnify women’s bipartisan collaborative advantage under high marginalization, with Model 5b. To best interpret the three-way interaction, we replicate Figure 4 for our bipartisan dependent variable to produce Figure 5. What is immediately apparent from Figure 5 is that we only find evidence for the bipartisan collaborative advantage among women in caucus chambers; the estimated effects in noncaucus chambers, while positive, are not statistically significant (Figure 5, left panel).
The marginal effect of being a female legislator on bipartisan, within-gender cosponsorship scores at different levels of female marginalization for chambers with and without women’s caucuses.
Note. Values are derived from Model 5b and estimated in Stata using the margins and marginsplot commands. Gray area represents the 95% confidence interval.

In the right panel from Figure 5, we see the estimated average effects of being female in caucus chambers. Here, we find that regardless of the level of marginalization, women enjoy a statistically significant advantage in bipartisan, within-gender collaboration in caucus chambers. However, we cannot reject hypothesis H2a’s null as we do not uncover evidence that marginalization conditions this effect. We do find evidence, however, that WCs, on average, support bipartisan collaboration among women, in line with findings by Holman and Mahoney (Reference Holman and Mahoney2018).
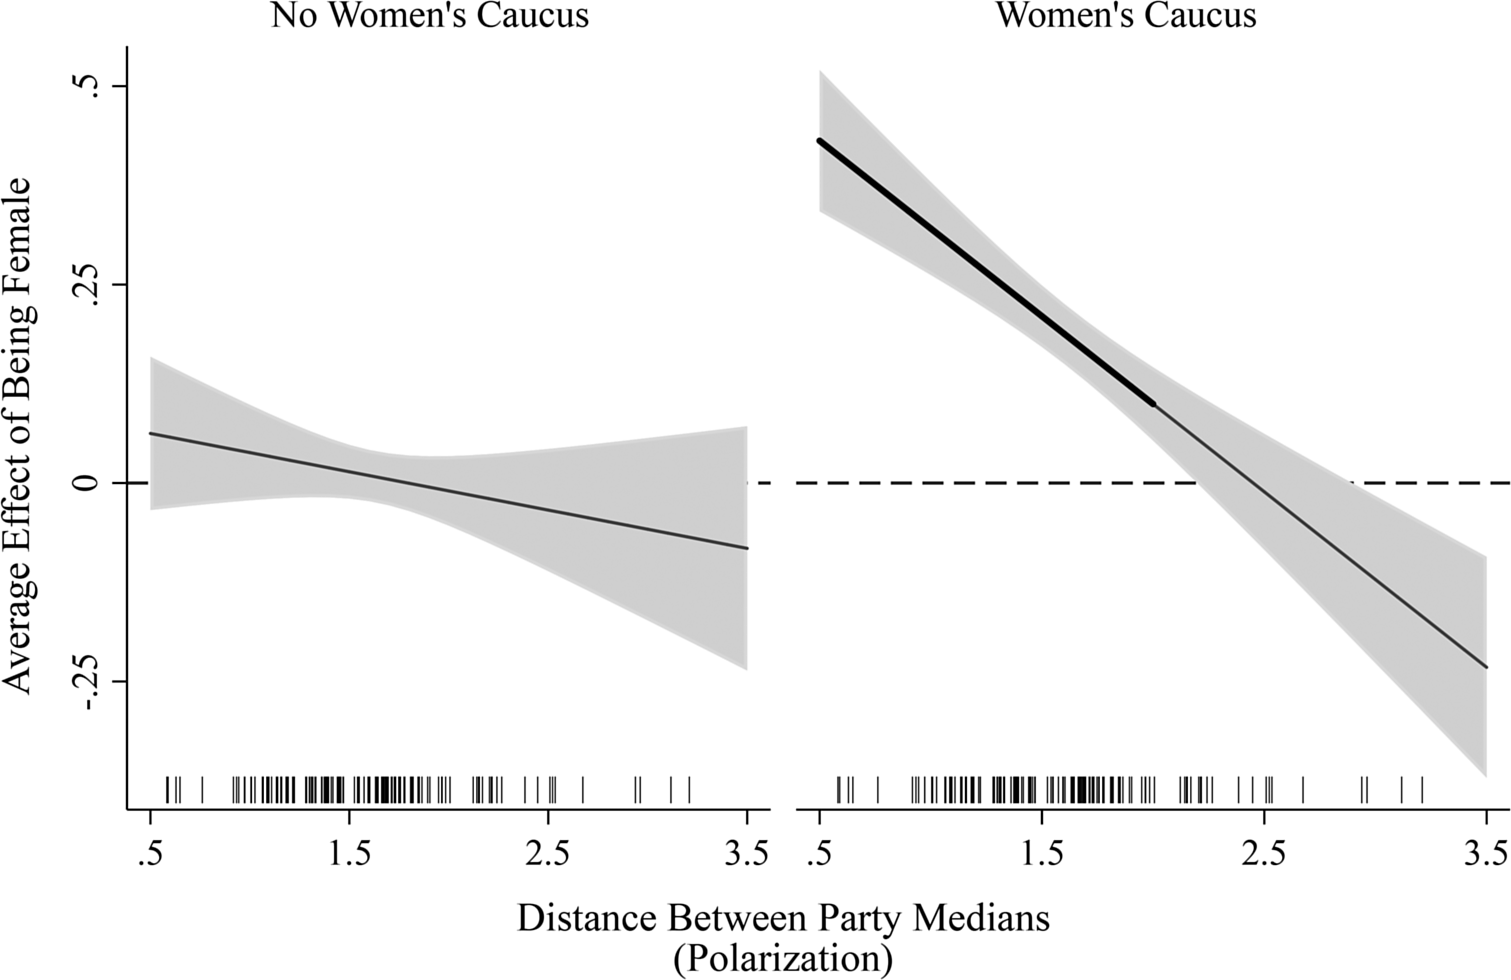
It appears that caucuses can bring women of different partisan and ideological affiliations together in a meaningful way. However, in an age of increasing party polarization (Hinchliffe and Lee Reference Hinchliffe and Lee2016; Shor and McCarty Reference Shor and McCarty2011), we might question the extent to which these caucuses are effective at overcoming partisan ideological differences. In other words, we might be interested in how much polarization WCs can overcome to produce bipartisan collaboration among women. To assess this, we estimate models that include interactions between legislator gender, the presence of a caucus, and the level of party polarization in the chamber. The estimates for this model are presented in Table 6 and the accompanying quantities of interest are presented in Figure 6.
Predictors of bipartisan, within-gender collaboration in 74 state chambers: Conditional effects of caucuses and polarization
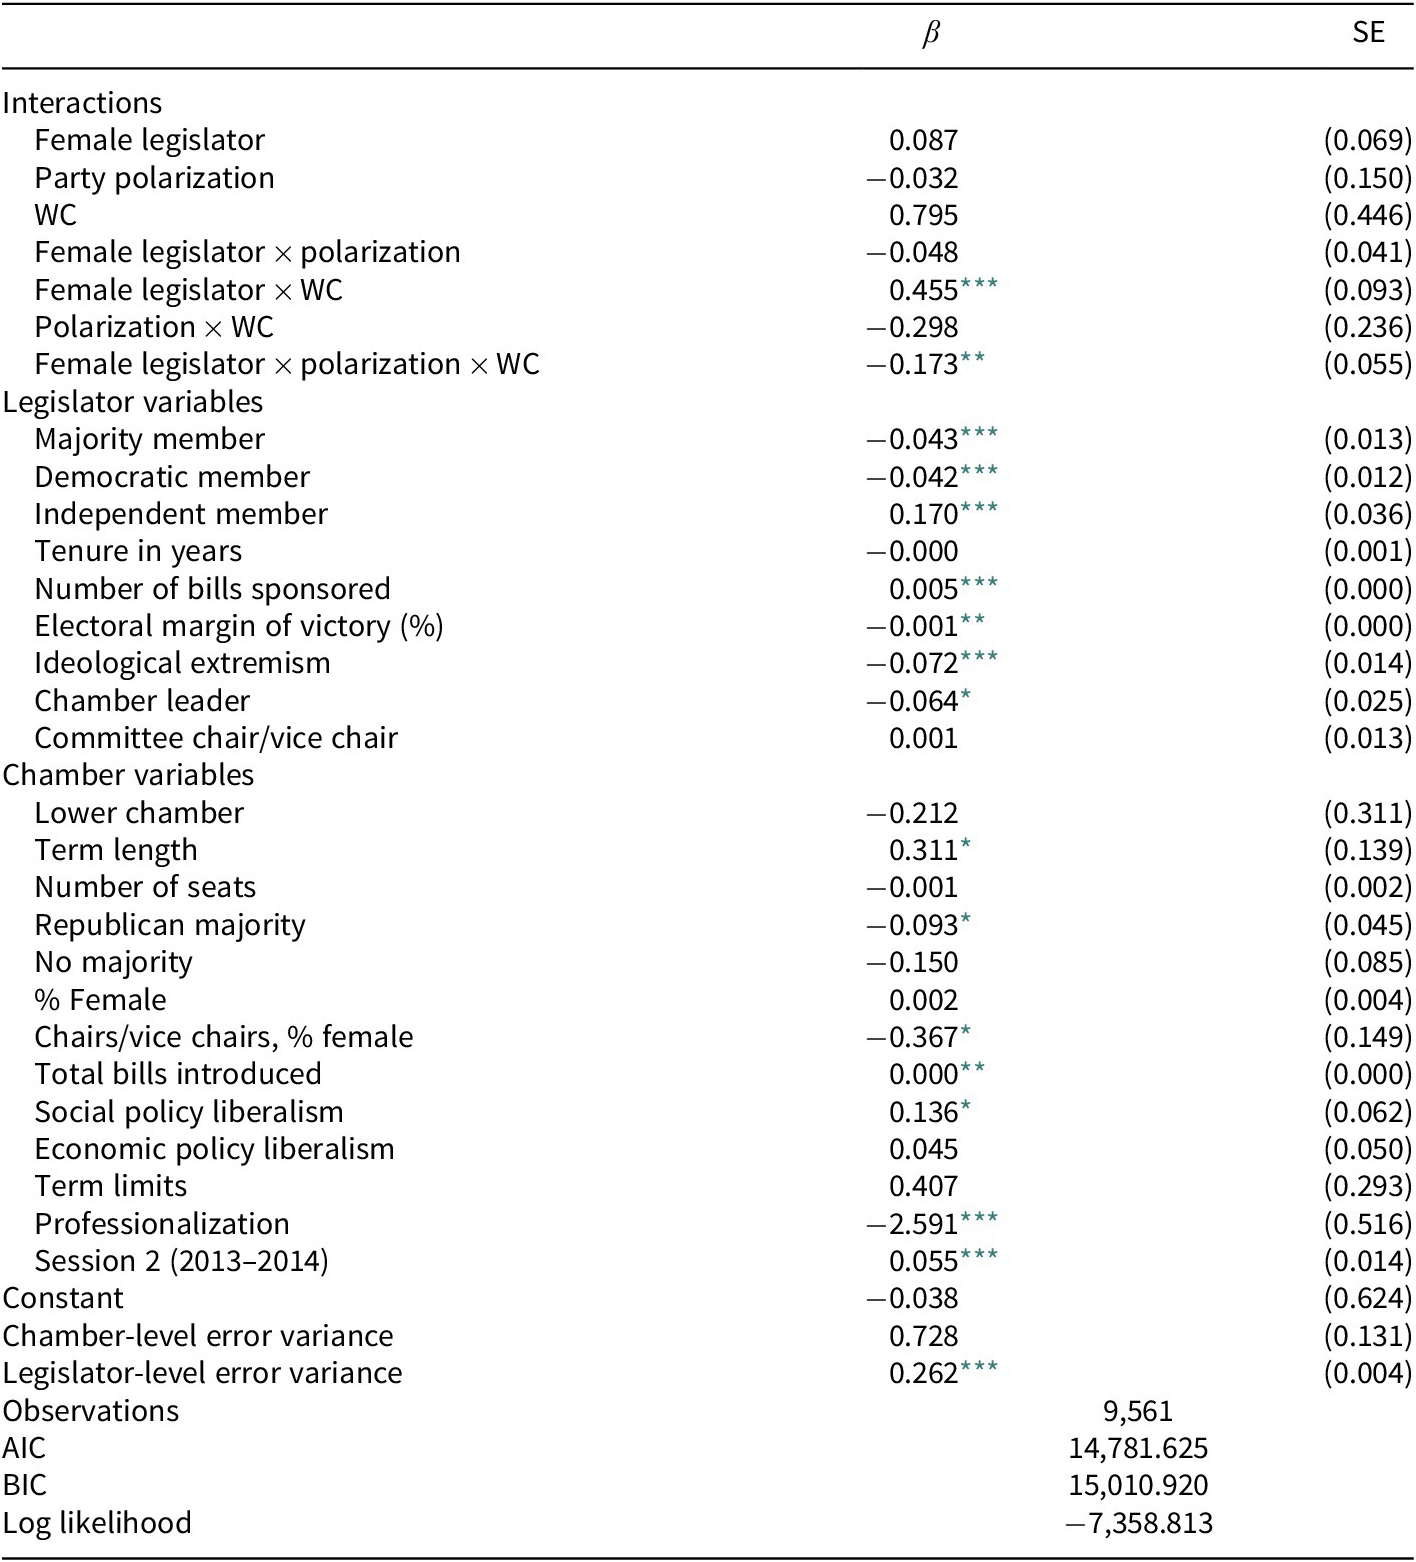
Note. Table entries are coefficients and their standard errors from a multi-level mixed effects linear model with random intercepts for each legislative chamber.
SE = standard error; WC = women’s caucus.
* p < 0.05;
** p < 0.01;
*** p < 0.001.
The marginal effect of being a female legislator on bipartisan, within-gender cosponsorship scores at different levels of polarization for chambers with and without women’s caucuses.
Note. Values are derived from the model in Table 6 and estimated in Stata using the margins command. Gray area represents the 95% confidence interval. The bold line indicates the area over which the effects for caucus states are statistically different from those without caucuses and also statistically different from zero.

Figure 6 shows that difference between chambers with and without a WC is stark. The left panel shows that in noncaucus chambers, we find no evidence that female legislators have a collaborative advantage over their male counterparts in terms of bipartisan, within-gender cosponsorship. We see a very different pattern in caucus chambers. Specifically, we find evidence that female legislators in many caucus chambers do have a collaborative advantage in bipartisan, within-gender copsonsorship, but this effect is heavily conditioned by party polarization. At the highest levels of polarization, we find no differences between men and women in either caucus chambers or noncaucus chambers. At low and moderate levels of polarization, however, we find that female legislators in caucus chambers have a significant collaborative advantage over male legislators in terms of bipartisan, within-gender cosponsorship. In total, about 15% of the chamber-years in the sample have high enough polarization to entirely mitigate the effects of the presence of a WC.
These findings support the general conclusion reached by Holman and Mahoney (Reference Holman and Mahoney2018)—that caucuses support women’s collaboration across partisan lines—but they also challenge the more nuanced conclusions they articulate. Specifically, they argue that polarization does not condition the effect of caucuses.Footnote 11 Here, we find clear evidence that polarization does depress women’s bipartisan collaboration, even in the presence of a caucus.Footnote 12 We believe these results suggest that connections formed within caucuses, while tremendously important, are not capable of overcoming extreme partisan and ideological differences. WCs are successful at bringing female legislators of opposing parties together, up to a point, at which partisan influences predominate.
Conclusions and Discussion
The collaborative advantage attributed to female legislators has been well documented (Barnes Reference Barnes2016; Bratton and Rouse Reference Bratton and Rouse2011; Kathlene Reference Kathlene1994; Rosenthal Reference Rosenthal1998; Thomas Reference Thomas1994; Weikart et al. 2007). Our study attempts to identify the specific mechanisms that lead to this collaborative behavior. We argue that this advantage is less a result of gender-based patterns of socialization and more a consequence of women seeking out strategies to increase their influence given their marginalized status within legislatures. Our theoretical framework rests on the assumption that women collaborate when the institutional environment both makes it a more compelling option and provides coordinating institutions like caucuses.
The first takeaway is that women in state legislative settings are more collaborative than their male colleagues. Evaluating overall collaboration patterns, female legislators exhibit greater collaborative activity within their own party and across party lines. This finding falls in line with existing research within and outside of the United States context, and is what we expected given the weight of evidence from prior studies.
Yet our analysis also documents specific mechanisms that can enhance or depress women’s collaborative advantage. Female legislators’ propensity to collaborate is more nuanced than what prior studies suggest. We find evidence for our theoretical framework which posits female collaboration as primarily a compensatory tool for female legislators to use where they are marginalized from leadership positions and mobilized through caucus membership. These two variables are strong predictors of collaborative behavior, providing a sound theoretical basis for understanding when and why collaboration is likely to occur. The binding force of marginalization strengthens collaboration as more women are kept from leadership positions and when there is a caucus present. WCs reduce networking costs and promote solidarity, thereby imparting dramatic effects on collaboration as a reaction to systematic exclusion. As women enter into leadership and party pressure increases, however, both forces break down women’s collaborative activities, at least as they relate to cosponsorship and bipartisan cosponsorship. We believe identifying the sources of collaborative behavior is exceedingly relevant given that female legislators have become increasingly polarized along party lines (Osborn et al. Reference Osborn, Kreitzer, Schilling and Hayes Clark2019).
These findings underscore the effect that exclusionary practices can have in legislatures. Women are more collaborative as a consequence of being left out of leadership roles, especially when legislative organization makes it easy for them to be in regular contact to share and exchange ideas. In other words, women’s collaboration is driven by, at least in part, asymmetric power dynamics. We think our results display the complexities behind the notion that women work together as “part of our DNA.”Footnote 13 In certain settings, we might see collaboration among women more out of need than voluntary association. This finding should be applicable to other marginalized groups with caucuses within the states. Although different racial and ethnic minorities have experienced dramatic gains in state legislative representation since the 1970s (Reingold Reference Reingold2019), in many chambers leadership roles remain exclusionary of underrepresented groups (Hansen and Clark Reference Hansen and Clark2020).
Finally, we do not find that caucuses can fully compensate for ideological differences among women, as argued by Holman and Mahoney (Reference Holman and Mahoney2018). While the presence of a WC can allow women to better overcome ideological differences than men, this effect is only observed up to a point. Specifically, if the parties in the chamber are highly polarized (above the 94th percentile), we find that caucuses have no effect. Therefore, while caucuses can overcome a great deal, there are some ideological divisions beyond their capacity to bridge. This finding aligns with Barnes’ (Reference Barnes2016), who suggests that institutional organizations operate within the confines of the larger political context.
We also recognize a few potential limitations and suggest future directions for further research. First, in using cosponsorship measures we are naturally limited to understanding collaboration during the beginning phases of the legislative process. Future studies may want to consider bill progression in chambers with and without WCs. Although caucuses lose their collaborative power in some settings, it would be worthwhile to know the extent to which they may be able to overcome other hurdles associated with lacking cooperation in legislatures. Additionally, our study does not consider substantive bill topics. It is unclear whether or not the compensatory mindset is broadly applicable to all bills or whether only a subset of issues are affected. Previous work has argued that caucuses decrease collaborative costs by, at least partly, providing information on shared interests (Reingold Reference Reingold2000; Victor and Ridge Reference Victor and Ringe2009). If this is the case, women’s collaboration may be confined to traditional “women’s issues” (Thomas Reference Thomas1994).
Even without an assessment of the role of women’s issues in the dynamics, we have identified, we still believe that our results illuminate important implications for state legislatures. First, legislatures that exclude women from leadership positions are perversely motivating the collaborative behavior that the public (at least claims) to want more of in politics (see Harbridge, Malhotra, and Harrison Reference Harbridge, Malhotra and Harrison2014). The upside is that in environments where statehouse seats and leadership positions are heavily dominated by males, female legislators are making strategic moves to remedy power disparities by making greater use of cosponsorship. However, we can also say that increasing the number of women in the chamber will not necessarily lead to more a collaborative legislative environment, by itself. Specifically, if women are successfully integrated into the leadership structure as their numbers increase, there should not be as strong of incentives for women to rely on collaboration to increase their influence. Our findings imply that collaboration will actually decline as women become more integrated as leaders, especially collaboration within their own party.
Data Availability Statement
Replication materials are available on UNC Dataverse at https://doi.org/10.15139/S3/WVINT7
Funding Statement
The authors received no financial support for the research, authorship, and/or publication of this article.
Conflict of Interest
The authors declared no potential conflicts of interest with respect to the research, authorship, and/or publication of this article.
Author Biographies
Clint Swift is an elections data analyst for VoteShield. His research focuses on state legislative politics and political methodology.
Kathryn VanderMolen is an assistant professor of political science at the University of Tampa. Her research focuses on state politics and legislative capacity
Appendix
Control variables: Measures and sources