INTRODUCTION
Radiocarbon (14C) is a long-lived beta-emitting radioisotope of carbon, with a half-life of 5730 ± 40 yr. In a nuclear reactor, it is produced by neutron-induced reactions with the nuclides 14N, 13C, and 17O that are present in the fuel, fuel cladding, coolant, moderator and structural materials (McNamara et al. Reference McNamara, McCartney and Scott1997).
14C is decaying to the stable isotope 14N, by emitting an electron with maximum energy of 156 keV (mean energy 49 keV). Initially, the experimental option was to measure worldwide 14C by the beta-decay counting method, by use of the liquid scintillation counting (LSC; Currie Reference Currie2004).
In 1977, at the Lawrence Livermore National Laboratory, Richard A. Muller and his team recognized that modern linear tandem accelerators could accelerate trace ions to energies where the magnetic and electric forces become sufficiently high to eliminate background interferences. They constructed the first complete and compact accelerator mass spectrometry (AMS) machine that was applied for precise carbon dating (Muller et al. Reference Muller, Stephenson and Mast1978).
The comparison of the two 14C measuring methods (AMS and beta-decay counting) has clearly shown that for the same analytical precision AMS is about hundred times faster in performing an analysis and it requires thousand times less material of a sample needed for an experiment (Jones et al. Reference Jones, Jull, Linick and Donahue1989; Kutschera Reference Kutschera2000). Due to this great success, many AMS machines were engaged in carbon dating. Their main goal was to extend ability to measure artifacts dated up to 50,000 years old. Also, the memory effect in the ion source had to be dramatically reduced and measurements were limited to concentrations below the modern carbon level of 10–12 for the 14C/12C ratio. As a consequence, in many AMS specialized laboratories the measurements of 14C concentrations situated over the modern level were forbidden.
However, there is an important need of 14C AMS measurements for medical application and for nuclear reactors, especially for the decommissioning procedures and waste management options for irradiated graphite (Canzone et al. Reference Canzone, Lo Frano, Sumini and Troiani2016; Wareing et al. Reference Wareing, Abrahamsen-Mills, Fowler, Grave, Jarvis, Metcalfe, Norris and Banford2017). The LSC method was used at the beginning and continued for long time (Mobbs et al. Reference Mobbs, Shaw, Norris, Marang, Sumerling, Albrecht, Xu, Thorne, Limer, Smith and Smith2013; Vaitkevičiene et al. Reference Vaitkevičiene, Mažeika, Skuratovič, Motiejūnas, Vaidotas, Oryšaka and Ovčinikov2013). In general, if the amount of graphite is sufficiently high, then the LSC method is mainly used for the analysis. However, this method is difficult to be applied when other beta emitting radionuclides are present in a sample. Considerable efforts were made to separate the different chemical elements by use of exchange resins and perlite mixtures (Vaitkevičiene et al. Reference Vaitkevičiene, Mažeika, Skuratovič, Motiejūnas, Vaidotas, Oryšaka and Ovčinikov2013). At AMS, fine powder sample of graphite are easy to be mounted into the target holder and then into the sample carousel of the ion source. This is done directly, without pretreatments and chemical separations. Solid sample targets such as square slices (7 × 7 mm) and 3 mm thick can also be mounted in the ions source. Only a simply modification of the sample holders is required (Stan-Sion and Enachescu Reference Stan-Sion and Enachescu2015). Since the bulk structure of the sample is preserved, concentration depth profiling can be measured.
In our AMS laboratory, at Horia Hulubei National Institute for Physics and Nuclear Engineering (NIPNE-HH) in Bucharest, two machines can perform AMS analysis. One is a new and compact Cockcroft Walton type 1 MV HVEE AMS system (Stan-Sion et al. Reference Stan-Sion, Enachescu, Ghita, Calinescu, Petre, Mosu and Klein2014a, Reference Stan-Sion, Enachescu, Petre, Simion, Calinescu and Ghita2015) that performs precise and low background measurements of 3H, 14C, 10Be, 26Al, and 129I. The other one is based on our multipurpose 9 MV tandem accelerator, an AMS facility that we built 17 years ago (Stan-Sion et al. Reference Stan-Sion, Enachescu, Constantinescu and Dogaru2010). It has been intensively used in the frame of the Euratom Program, for the depth profiling of tritium high dose concentrations (Stan-Sion et al. Reference Stan-Sion, Enachescu, Petre, Duma, Ghita, Kizane, Baumane, Gabrusenkos, Halivotos, Avotina, Zarnis, Likonen, Koivuranta and Kiisk2014b, Reference Stan-Sion, Bekris, Kizane, Enachescu, Likonen, Halitovs and Petre2016).
At this second machine, restrictions in experiments are imposed by the general radioactive protection standards and regulations only. According to this legislation, we were allowed to perform AMS measurements at higher 14C concentrations than the actual natural level and therefore, we were able to respond to the need of the decommissioning procedures at the VVR-Reactor S (Russian light water reactor of type S) in NIPNE-HH (Ionescu et al. Reference Ionescu, Gurau, Stanga and Duliu2012). The aim of these experiments was to determine the 14C accumulation in the thermal column of the VVR-S reactor produced during the functioning time of about 50 years. AMS measurements were performed on graphite samples collected from the thermal column where 14C is produced by thermal neutrons.
Our main challenge was to measure the carbon content starting from low concentration values, below the modern 14C level, until 10000 times higher and to measure graphite samples from the thermal column of the decommissioned nuclear reactor.
SAMPLE COLLECTION AND PREPARATION FOR AMS MEASUREMENTS
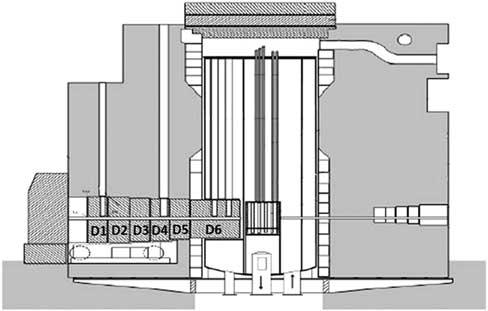
Figure 1 presents the layout of the thermal column inside the nuclear reactor. AMS samples were collected after the final shut down and after fuel removal of the reactor core.
Vertical cut-view through the VVR-S nuclear reactor in Bucharest and the movable thermal column with its 6 independent disks (D1-D6). Each graphite disk was enclosed during the reactor functioning in a thick (3 mm) aluminum cladding. The entire column was about 3 m long with the role of moderating the neutron energies to the thermal range.

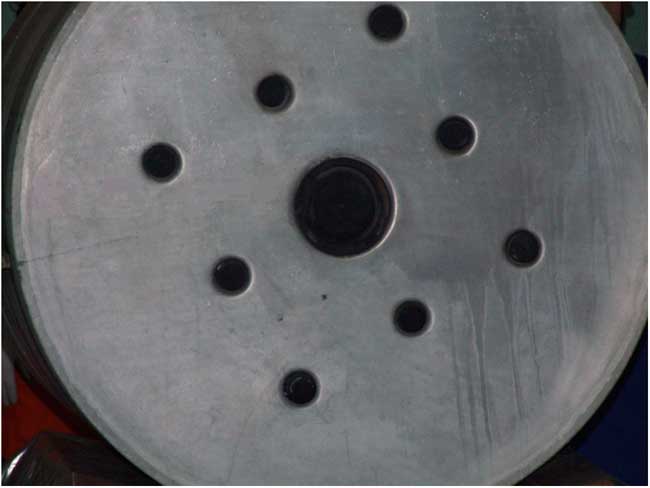
Along the thermal column runs a channel with a 100-mm round opening. The cross section view of the opening is shown in Figure 2.
Cross section view of the thermal column with the central opening of the channel running all the way down, until the reactor core.

During the fission operation in the reactor core, the column channel was filled with a graphite rod that was itself covered with a 1-cm-thick cylindrical graphite sleeve, sealing the entire opening of the thermal column to the exterior hall.
Two types of samples were employed in this study. Fine powder samples cut from the irradiated graphite, grounded up to a fine powder and solid plate samples, solely cut to suitable dimensions to fit in the target holder. Fine powder samples were mixed with Nb in a ratio 5:1, for conferring electric conductivity. They were firmly pressed into the target holder.
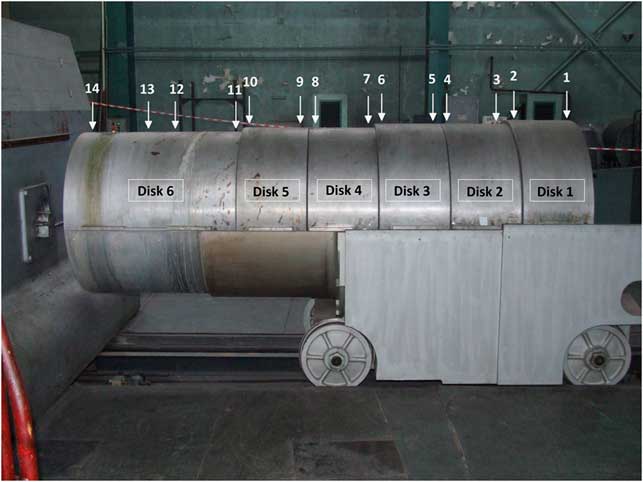
The sampling of graphite for the AMS analysis was performed from the internal 1cm graphite coating. The positions are approximately indicated in Figure 3. Disk no.6 was the first moderator in front of the reactor core and it is 60 cm long. Four samples (no.: 14, 13, 12, and 11) were collected from this disk, at distances of 5, 30, 40, and 55 cm from the core. The other disks were 40 cm long and samples were collected from both ends. Samples were cut in small slices and were provided to the AMS laboratory for the analyses.
The movable thermal column with six graphite disks placed on a mobile truck. On the top of this structure numbers 1–14 indicate the positions of the collected samples for the AMS analyses.

EXPERIMENTAL METHOD
14C high concentrations AMS experiments have been performed at our analyzing machine built on the multipurpose 9 MV FN tandem accelerator in Bucharest (FN is the accelerator type of 3.66 m in diameter, 13.4 m long, rated at a terminal voltage of 7.5 MV and known to run reliable at even 11 MV) (Stan-Sion et al. Reference Stan-Sion, Ivascu, Plostinaru, Catana, Marinescu, Radulescu and Nolte2000, Reference Stan-Sion, Enachescu, Constantinescu and Dogaru2010).
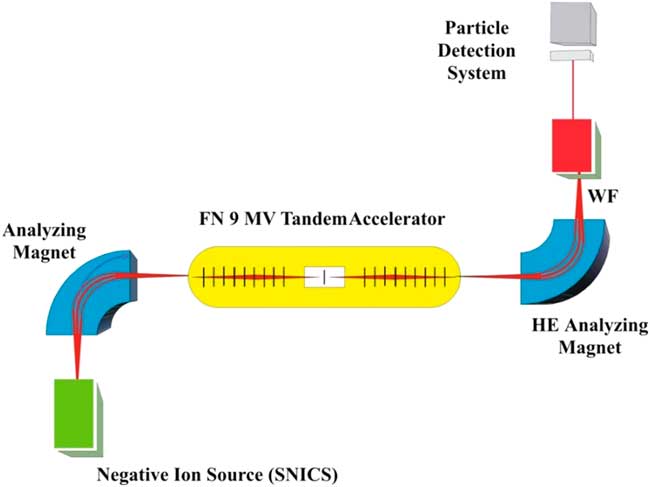
The main parts of the AMS machine are presented in Figure 4. They start from left to right, with the dedicated AMS ion injector that contains the ion sputter source with its powerful vacuum system acting on the ion source sputter chamber and the 90º double focusing analyzing magnet. The pre-acceleration stage of 140 keV before the entrance into the accelerator has the role to improve the ion source beam emittance. It is followed by the 9 MV accelerator with a foil stripper in the terminal. At the accelerator exit, on the high-energy side (HE), a powerful analyzing magnet is located. It is followed by the Wien Velocity Filter (WF) and finally by the ion detection system based on an array of three surface barrier detectors Si (Au). Since we tuned the terminal voltage at 2.7 MV to operate the accelerator at the charge state 3+ (10.8 MeV total energy), only the first Si (Au) diode detector was used for 14C measurements.
Schematic diagram of the AMS facility based on the 9 MV FN tandem accelerator in NIPNE-HH Bucharest. The Wien Velocity Filter (WF) and the versatile detection system are also shown on the high-energy side (HE) of the AMS facility.

AMS machines dedicated for 14C dating are compact and automated and the details of ion beam selection after each analyzing step are ignored. However, when a large accelerator is upgraded and used for the first time for 14C measurements, each analyzing step has to be tested for its separation power of ions and for the ion beam optics. A perfect separation between the three isotopes of carbon is compulsory to be attained before the ion beam is entering the pre-acceleration stage.
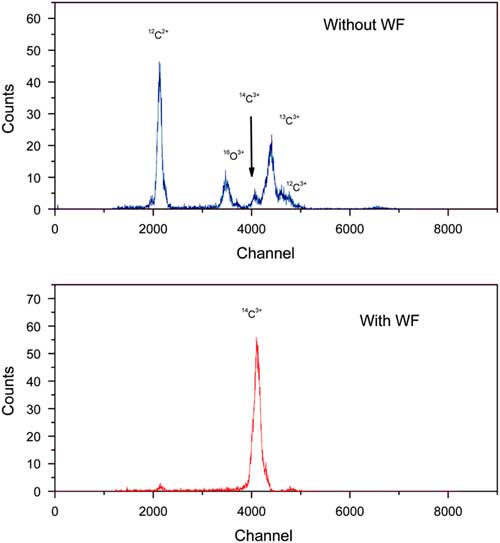
In our case, the first analysis step to select negative ions of mass 14 is performed by the magnetic analyzer on the low energy side. The retractable Faraday cup placed in the focus of this analyzer measures the 14C ion current and also the entire background of mass-14 molecules, such as 13CH– and 12CH2–. Fortunately, the 14N–, background will be absent because nitrogen dose not exists as stable negative ions. Remaining molecules will be dissociated in the stripper carbon foil (6 μg/cm2) placed in the tandem terminal and are eliminated by the powerful analyzing magnet of the high-energy side. The result of the analysis is shown in Figure 5 (upper part). As it can be seen, although 13C peak is greatly reduced in intensity, its tail toward low energy still affects the small 14C peak at 10.8 MeV energy. However, this 14C peak is clearly visible, positioned at the left of the large group of 3+ charge ions (13C3+ and 12C3+) and on a rather reduced background.
The two steps in the detection of 14C with AMS at NIPNE-HH. Upper part: Spectrum measured in the Si (Au) surface barrier detector, after acceleration through the tandem, after the stripping process in the tandem terminal and analyzed by the high-energy analyzing magnet, at the final energy of 10.8 MeV. Lower part: Spectrum after the final analysis through the Wien Velocity Filter (WF). Both spectra were measured for 100 s.

Measurements performed in another laboratory, in same conditions, but using a gas stripper, provided a less accurate spectrum. However, the spectrum improved considerably when filtered and corrected by the electric velocity filter (Kutschera Reference Kutschera2000). Similarly in our experiments, by switching on the Wien Velocity Filter (Catana et al. Reference Catana, Stan-Sion, Enachescu, Plostinaru, Vata and Rohrer2001), a clear peak of 14C3+ emerged in the spectrum (see Figure 5, lower part).
Since our AMS facility at the 9 MV tandem is not equipped with a bouncing system for fast sequential injection of the stable carbon isotopes of mass 12 and 13, ion currents were measured by retractable Faraday cups operated manually. The 12C ion current was measured in a Faraday cup placed in the image focus of the low energy 90° analyzing magnet. In order to tune the WF, we used the 13C current.
A fast switching system is vital for 14C dating experiments, since by use of such a system, precision increases to less than 0.5%. However, such a tool is not required for applications of 14C high concentrations, as those described in this study.
The background in an AMS experiment is determined by the measurement of a blank sample and represents the counting rate registered for the rare isotope. This value determines the lowest concentration value that can be measured. Consequently, the background counting rate has to be controlled after the measurement of each sample. This is especially important when measuring high concentrations of rare isotopes. Long time sputtering on a blank sample in the ion source, under good vacuum conditions, will reduce the memory or “cross talk.” Therefore, at AMS, the sputter ion sources are equipped with powerful and well-adapted vacuum systems. At our facility, measurements of 14C concentration were possible in a wide range of concentrations due to the good vacuum (3 × 10⁻⁷ mbar) produced in the ion source by three turbo pumps, with a total pumping speed of 1350 L/s applied to a total volume of 4.5 L.
In order to minimize the cross talk, low concentrated samples were measured at the beginning of each experiment. Background counting values and reference samples were measured before and after each sample. We continued a measurement only if the concentration of the blank sample was less than 1% of the sample concentrations.
In order to quantify the AMS measurements, IAEA standard sample were used. Usually, graphite samples are mixed with Fe to make them easy for pressing into the target holders and electrically conductive to avoid electric discharges in the ion source. If the host-matrix of the target sample is changed, variations of the negative ion yield are expected and also ion currents will change. To avoid such variations, standard samples and blank samples have been prepared by use of the same host matrix as the samples to be analyzed. As reference standard sample we used the IAEA-6 standard (150.61 ± 0.11 pMC) (IAEA 2007).
All results were background corrected. Each sample was measured five times. The mean value had a statistical error of 4% and the relative standard deviation between similar samples varied between 6% and 9%.
Some of the measured samples had 14C concentrations exceeding the counting rate acceptance of our data acquisition system. This is limited to an event counting frequency of 2.5 kHz. In such situations we have been using a calibrated ion beam attenuator of 1000 times.
The decommissioning procedures required also information about the depth distribution of the produced radioisotopes, especially for multiple sandwich-like material structures in the nuclear reactor.
The AMS system at the 9 MV tandem accelerator was upgraded in the past (Enachescu, Lazarev and Stan-Sion Reference Enachescu, Lazarev and Stan-Sion2006; Stan-Sion and Enachescu Reference Stan-Sion and Enachescu2015) to allow depth profiling (DP) of the elemental concentration of rare isotopes in materials. AMS-DP was intensively used for applications in the frame of the EURATOM program (Stan-Sion et al. Reference Stan-Sion, Enachescu, Petre, Duma, Ghita, Kizane, Baumane, Gabrusenkos, Halivotos, Avotina, Zarnis, Likonen, Koivuranta and Kiisk2014b; Stan-Sion Reference Stan-Sion, Bekris, Kizane, Enachescu, Likonen, Halitovs and Petre2016; Enachescu Reference Enachescu2017).
Samples from the thermal column were initially cut as solid carbon slices and only part of them were ground up to a fine powder. Therefore, a depth profile of accumulated 14C isotope concentration was possible. For DP the samples was specially cut as small square slices (7 × 7 mm) and 3 mm thick and were introduced in the AMS ion source target holders, that preserved their bulk structure (Stan-Sion and Enachescu Reference Stan-Sion and Enachescu2015).
RESULTS
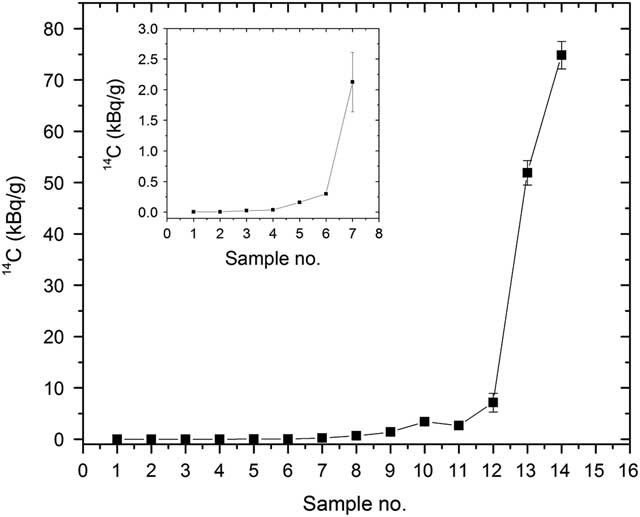
In this study, graphite samples have been collected from the interior of the 6 disks of the thermal column. Figure 6 shows the results of the AMS 14C concentration measurements, expressed in kBq/g according to the AMS determined 14C/12C isotopic ratio and the isotopic abundance in graphite of the stable 12C of 98.9%. The maximum background value before the measurement of a sample was 3 × 10–12 for the 14C/C12 isotopic ratio or 0.2 Bq/g. For samples with low 14C concentration, as those from disks no. 1–4, the background was about 10 times lower.
The 14C concentrations values (kB/g) measured by AMS in 14 graphite samples from the 6 disks of the reactor thermal column (see Figure 3). In the left corner, an enhanced picture shows the lowest 14C concentration in disks situated at the greatest distance from the reactor core. Numerical values of these concentrations are given in Table 1.

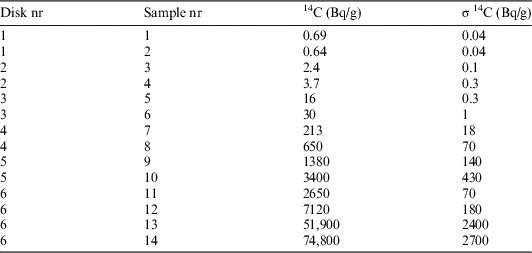
Samples no. 14, 13, 12, and 11 belong to disk no. 6, which is located close the reactor core in a highly neutron irradiated region. For these samples, we measured the highest 14C concentrations. The maximum value of 75 kBq/g was measured for the sample no. 14. It is followed by a steep decrease towards 2.6 Bq/g in the last sample no. 11. Samples no. 10 and no. 9 from disk 5 had much lower 14C concentrations. The measured values are given in Table 1. The steep decrease continues of the lower concentration in the disk no. 4, samples no. 8 and no. 7. It stops at sample no. 6 from disk no. 3. For the outer disks no. 2 and no. 1, the 14C concentrations are not far from the modern 14C level (0.23 Bq/g), which is available all around outside the column.
14C (Bq/g) activity concentrations measured by AMS in samples collected from the thermal column.

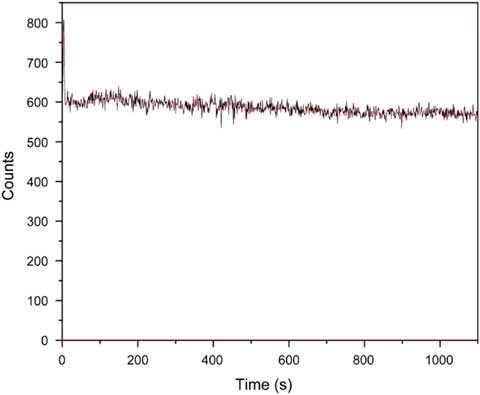
Figure 7 shows the concentration depth profile spectrum in an excavated slice sample no. 6 from disk no. 3. The explored depth was 3 μm deep.
AMS depth profiling of 14C concentrations up to 3 µm depth in the sample no. 6 from disk no. 3.

Previous results of this work have shown that the accumulated 14C has a rapid variation in axial direction of the neutron beam (see Figure 6). In radial direction the variation is much softer. Our tests showed that a 5% variation of 14C retention over a 3-μm depth interval could be detected.
The produced neutron fluxes were intense over the very long irradiation time of the reactor functioning. That is why variations of radial retentions of 14C in μm range are less important for the thermal column. However, for other materials in the nuclear reactor, which were irradiated by scattered neutron fluxes, the AMS-DP could reveal a specific pattern of 14C concentrations corresponding to variable intensities of the neutron fluxes. Such studies will be continued in the future.
CONCLUSIONS
An AMS facility based on a multipurpose 9 MV tandem accelerator has been upgraded to perform measurements of high concentrations of 14C contained in graphite samples from the thermal column of the decommissioned VVR-S Nuclear Reactor of NIPNE-HH Bucharest. Results have shown that the 14C concentration in the thermal column, close to the reactor core, is about 75 kBq/g and decreases to 0.7 Bq/g at the end of the column. Such AMS measurements can now be commonly performed for characterizing the 14C content in materials, with relevance for the decommissioning of nuclear reactors and more.
In dedicated AMS machines for 14C dating, an upper recommended limit of measurable concentration is approximately the modern level of radioactivity 0.22 Bq/g, which is also present in any living creature on earth. For short time measurements, as required for calibration, slightly higher concentrations are also allowed.
The concentration restrictions of 14C are imposed by the experimental requirements for keeping the background counting rate at a very low level that determines the limit can be measured for the age of an artifact. For example, the decay rate of a 50,000 years old sample is 5.4 × 10⁻⁴ Bq/g and the background concentration in the measurement should be lower. After a sample measurement, the source of negative ions by cesium sputter (SNICS) can recover rapidly to a reduced background only if the contamination was not far from the modern limit. In this study, since the measured concentrations of 14C were quite high, the SNICS memory effect limited the background recovery at 0.2 Bq/g. However, this value was not affecting the AMS analyses and errors were between 6% and 9%, which are satisfactory for such measurements.
This study has shown that an AMS facility is able to perform measurements of concentrations of 14C with relevance for decommissioning and waste disposal of nuclear reactors. AMS can determine the tritium content in the same samples used for the 14C measurements and it can also perform depth profiling of the radioisotope concentration when this is required.