Implications
A single quality descriptor of beef eating quality will likely be applicable to the entire European market due to the small impact of demographics on consumer scores. This descriptor could form the basis of an eating quality-based grading system for beef which would allow consumers to select beef of a desired quality when purchasing beef. As European consumers are also willing to pay more for better quality beef, such a system would provide a price signal in the market, creating a financial incentive for producers to include eating quality in their management strategies.
Introduction
There is interest in developing an eating quality-based grading system for the European beef industry to reduce the variability in eating quality of European beef (Verbeke et al., Reference Verbeke, Van Wezemael, de Barcellos, Kügler, Hocquette, Ueland and Grunert2010). It has already been shown that such a system would be well accepted (Hocquette et al., Reference Hocquette, Legrand, Jurie, Pethick and Micol2011) and could be based upon the Meat Standards Australia (MSA) model (Watson et al., Reference Watson, Gee, Polkinghorne and Porter2008a) which uses predictors such as carcase weight, ossification, rib fat and intramuscular fat to predict consumer eating quality. Indeed, Bonny et al. (Reference Bonny, Hocquette, Pethick, Farmer, Legrand, Wierzbicki, Allen, Polkinghorne and Gardner2016a and Reference Bonny, Pethick, Legrand, Wierzbicki, Allen, Farmer, Polkinghorne, Hocquette and Gardner2016b) have previously shown that this model functions well when using European beef, with only minor adjustments. However, it is unclear if a single quality descriptor would be applicable to all European consumers. Demographics are well established as factors that influence the beef quality scores and purchasing decisions of consumers (Berry and Hasty, Reference Berry and Hasty1982; Thompson et al., Reference Thompson, Pleasants and Pethick2005). Therefore, these factors must be investigated in order to properly design taste panel experiments (Thompson et al., Reference Thompson, Pleasants and Pethick2005) and to validate the use of a single quality descriptor for all consumers, as the basis of an eating quality beef grading system. Furthermore, willingness to pay information would allow the beef industry to take full advantage of a beef grading system based on eating quality with realistic price differentials, and highlighting groups of consumers who place a greater value on quality.
Previous work on Australian and Korean consumers identified only very minor demographic effects on sensory scores of beef and lamb (Thompson et al., Reference Thompson, Pleasants and Pethick2005; Hwang et al., Reference Hwang, Polkinghorne, Lee and Thompson2008). The main response was that consumers who considered beef to be a more important part of their diet scored lamb more favourably (Thompson et al., Reference Thompson, Pleasants and Pethick2005). Thompson et al. (Reference Thompson, Pleasants and Pethick2005) also found a small difference between the genders, with men scoring beef around 2 points out of 100 lower than women. However, this trend is not consistent in the literature, Huffman et al. (Reference Huffman, Miller, Hoover, Wu, Brittin and Ramsey1996) found no differences between the sexes when scoring beef, and Kubberød et al. (Reference Kubberød, Ueland, Rødbotten, Westad and Risvik2002) found that men scored beef more favourably than women.
A consumer’s preferred level of cooking doneness also has a small effect on consumer scores (Thompson et al., Reference Thompson, Pleasants and Pethick2005) with consumers who preferred beef cooked medium-well or well-done scoring beef prepared medium about 2 points higher than consumers who preferred their beef cooked medium or rare. This appears to contradict the results of Cox et al. (Reference Cox, Thompson, Cunial, Winter and Gordon1997) who found that consumers tasting beef cooked to their preferred level of cooking doneness rated beef higher. However, the Cox study was performed in restaurants where consumers ordered and paid for their steaks, potentially altering the result.
Previous studies have shown that Australian, American, Japanese, Irish and South African consumers are willing to pay at least twice as much for better quality beef (Lyford et al., Reference Lyford, Thompson, Polkinghorne, Miller, Nishimura, Neath, Allen and Belasco2010; Thompson et al., Reference Thompson, Polkinghorne, Gee, Motiang, Strydom, Mashau, Ng’ambi, deKock and Burrow2010), although there were small variations between different demographic groups. Consumer age was found to have a negative relationship with willingness to pay in three studies (Lusk et al., Reference Lusk, Fox, Schroeder, Mintert and Koohmaraie2001; Lyford et al., Reference Lyford, Thompson, Polkinghorne, Miller, Nishimura, Neath, Allen and Belasco2010; Thompson et al., Reference Thompson, Polkinghorne, Gee, Motiang, Strydom, Mashau, Ng’ambi, deKock and Burrow2010). In contrast, Reicks et al. (Reference Reicks, Brooks, Garmyn, Thompson, Lyford and Miller2011) found that age had no effect on the importance of price when consumers were purchasing beef, though this survey was more directed to factors influencing purchasing decisions, rather than willingness to pay for different quality levels.
There are several other demographic factors (sex, occupation, number of children in the household or cooking method) that have been investigated and found to have no effect on willingness to pay for quality beef (Cox et al., Reference Cox, Thompson, Cunial, Winter and Gordon1997; Lyford et al., Reference Lyford, Thompson, Polkinghorne, Miller, Nishimura, Neath, Allen and Belasco2010; Thompson et al., Reference Thompson, Polkinghorne, Gee, Motiang, Strydom, Mashau, Ng’ambi, deKock and Burrow2010; Reicks et al., Reference Reicks, Brooks, Garmyn, Thompson, Lyford and Miller2011). In addition, both Feuz et al. (Reference Feuz, Umberger, Calkins and Sitz2004) and Lusk et al. (Reference Lusk, Fox, Schroeder, Mintert and Koohmaraie2001) found no effect of income bracket on willingness to pay for American consumers. In addition, Feuz et al. (Reference Feuz, Umberger, Calkins and Sitz2004) and Reicks et al. (Reference Reicks, Brooks, Garmyn, Thompson, Lyford and Miller2011) found that these patterns were similar across different regions in the United States.
In this study, we explore the demographic effects on consumer scores from four different European countries, and willingness to pay from these same countries and from Australia. Based on the results of consumer testing in other countries, we hypothesise that there will be only small demographic effects on sensory scores. These effects will be limited to a positive relationship with the importance of beef in a consumer’s diet and a small increase in sensory scores when consumers prefer their beef prepared medium-well and well-done. We also hypothesise that consumers will be willing to pay approximately double for beef of a premium quality compared to good-every-day product, and that this will not vary with demographic factors outside of a small negative relationship with consumer age.
Material and methods
Animals and muscle samples
The carcasses used for this experiment were described in detail by Bonny et al. (Reference Bonny, Hocquette, Pethick, Farmer, Legrand, Wierzbicki, Allen, Polkinghorne and Gardner2016a) and Legrand et al. (Reference Legrand, Hocquette, Polkinghorne and Pethick2013). Briefly, the data set was formed through combining the records of a number of specific, smaller, experiments. As a result, this data set provides a cross-section of commonly used European cattle types from France, Poland, Ireland and Northern Ireland. The cattle were slaughtered commercially according to standard practice in each country. There was a range of 5 to 28 days postmortem ageing for the samples, and all samples were wet aged. A total of 25 different muscles were collected, which reflected a wide range of different eating qualities, though not all muscles were collected from each carcass.
Meat preparation and consumer panels
Meat preparation and consumer assessment of eating quality for the four cooking methods were performed according to the protocols for MSA testing by personnel trained in MSA testing procedures (Anonymous, 2008; Watson et al., Reference Watson, Gee, Polkinghorne and Porter2008a) in each of the participating countries, France, Ireland, Northern Ireland and Poland. Each consumer only tasted beef cooked by a single cooking method and degree of cooking doneness. The slow cooking method was only used in Poland and the Korean BBQ (barbeque) was tested only in Ireland. The grill cooking method was performed in all countries and the roast cooking method was performed in all countries except for France. Grill samples were prepared to either a rare or a medium doneness in France. Legrand et al. (Reference Legrand, Hocquette, Polkinghorne and Pethick2013) has previously demonstrated that there were no significant differences in consumer responses between the two levels of cooking doneness used in this experiment. In Northern Ireland, the roast and grill samples were prepared to either a medium or a well-done cooking doneness (Anonymous, 2008; Bonny et al., Reference Bonny, Pethick, Legrand, Wierzbicki, Allen, Farmer, Polkinghorne, Hocquette and Gardner2016b). All other samples were prepared to a medium cooking doneness with cooking doneness determined by a combination of consistent sample size, cooking temperature and time (Anonymous, 2008; Bonny et al., Reference Bonny, Pethick, Legrand, Wierzbicki, Allen, Farmer, Polkinghorne, Hocquette and Gardner2016b).
For each cooking method, consumers received seven portions: the first portion (a ‘link’ sample) was derived from either a generic striploin or rump muscle and expected to be of average quality – the sensory scores for this portion were not part of the final statistical analysis. Each of the remaining six portions was derived from one of the muscle samples collected. These were taken from a variety of different muscles and selected to present each consumer with a diverse quality range from unsatisfactory to premium. These were served in accordance with a 6×6 Latin square to balance potential order effects (Thompson et al., Reference Thompson, Pleasants and Pethick2005; Hwang et al., Reference Hwang, Polkinghorne, Lee and Thompson2008). Consumers scored meat from their country of origin except for two sessions where meat was tested between Poland and France in a complete factorial design, and a series of sessions where French consumers tasted Australian beef. In all countries, consumers were sourced through both commercial consumer testing organisations and local clubs and charities. They were selected to reflect the general population. Consumers scored samples for tenderness, juiciness, flavour liking and overall liking, by making a mark on a 100 mm line scale, with the low end of the scale representing a negative response and the high end of the scale representing a positive response. Consumers were also asked to place the beef in one of four categories; unsatisfactory, good-every-day, better-than-every-day or premium. After the completion of the tasting panel, consumers were then asked to detail, in their own currency, their willingness to pay for these four quality categories. All consumers indicated their willingness to pay by marking a point on a line, except for the Irish consumers who were required to tick a box indicating a fixed value. For a more detailed description of the testing procedures and the questionnaire, see Anonymous (2008).
Consumer demographics
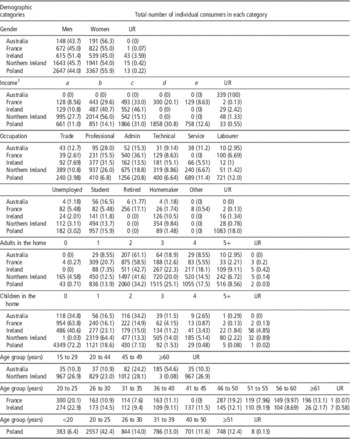
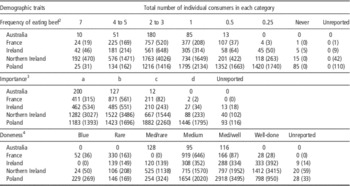
In addition to scoring beef samples, consumers answered a short demographic questionnaire in their native language. The English version of this questionnaire is detailed elsewhere (Anonymous, 2008). This included questions about their age, gender, occupation, number of children and adults in the household and total income of the household. Not all taste panel sessions gathered information on willingness to pay; therefore, the numbers of consumers differed between the analyses examining the sensory scores and willingness to pay. In addition, the Australian consumers were not included in the analysis of the sensory scores. The distribution of the demographics for the sensory score analysis is detailed by Bonny et al. (Reference Bonny, Hocquette, Pethick, Farmer, Legrand, Wierzbicki, Allen, Polkinghorne and Gardner2016c). In brief, there were 19 492 consumers and in all countries women outnumbered the men, except for Ireland. The majority of consumers came from households with 1 to 3 adults and 0 to 2 children (Bonny et al., Reference Bonny, Hocquette, Pethick, Farmer, Legrand, Wierzbicki, Allen, Polkinghorne and Gardner2016c). This is similar to the distribution of the demographics for the willingness to pay analysis (Table 1). In Australia, there were a greater number of consumers aged over 60 years than any other age group, and information regarding income was not collected (Table 1). Consumers were also asked to rate the importance of beef in their diet, their usual frequency of eating beef and their preferred level of doneness (Table 2). In all countries, most consumers ate beef at least once a week. In most countries, the majority of consumers considered red meat to be at least a regular part of their diet, whereas in Poland there was a more even spread of consumers over the ‘importance of beef in the diet’ categories than other countries (Table 2).
Number of consumers who scored beef samples (and percentage distribution) within each of the demographic categories for each country for the willingness to pay analysis

UR=unreported; Admin=administration.
1 Income categories are different for each country. In all countries 0=unreported; France (€/month) – a: <1000, b: 1000 to 2000, c: 2000 to 3000, d: 3000 to 4000, e: >4000; Ireland (€/year) – a: <20 000, b: 20 000 to 50 000, c: >50 000; Northern Ireland (£/year) – a: <20 000, b: 20 000 to 50 000, c: >50 000; Poland (zł/month) – a: ⩽1000, b: 1001 to 1400, c: 1401 to 2200, d: 2201 to 4000, d: >4000.
Number of consumers within each of the demographic categories for the willingness to pay (and sensory scoreFootnote 1 ) analyses, outlining the role of meat in their diet for each country

1 The numbers in brackets indicate the numbers of consumers for each category used in the analysis investigating the effect of demographics on sensory scores.
2 Number of meals containing red meat eaten by the consumer in an average week.
3 Importance of beef in the diet.
a=red meat is an important part of my diet; b=red meat is a regular part of my diet; c=red meat is part of my diet but it would not worry me if it was not; d=I rarely/never eat red meat.
4 Preferred cooking doneness.
Statistical analysis of sensory scores
The four sensory scores (tenderness, juiciness, flavour liking, overall liking) were weighted (0.3, 0.1, 0.3, 0.3) and combined to create a fifth score termed the Meat Quality 4 (MQ4) score. These weightings were used in this analysis as they are the weightings currently used in the MSA beef grading system in Australia (Thompson et al., Reference Thompson, Polkinghorne, Gee, Motiang, Strydom, Mashau, Ng’ambi, deKock and Burrow2010). The important results from this analysis did not differ when the original weightings for the sensory scores (0.4, 0.1, 0.2, 0.3) were used. The effect of demographic factors on the four sensory scores and the MQ4 score was investigated using separate linear mixed effects models with the HPMIXED procedure in SAS (SAS, 2002). The random terms were beef sample identification number, consumer identification number within country and session, and session within country. The experimental design factors of country and sample serve order (2 to 7) were included in the model as fixed effects. This structure accounted for the variance associated with consumer and session, with each consumer providing six responses, and each session consisting of a separate set of 60 consumers. The score of the previous sample was included as a covariate to test for carry-over effects. Demographic effects were included in the model as fixed effects. These were age, income, gender, occupation, number of children in the household, number of adults in the household, importance of red meat in the diet, frequency of eating beef and the preferred level of doneness. Income and age were fitted within country as different scales were used in different countries. All factors in the model were interacted with country, and the score of the previous sample was also interacted with sample serve order. Non-significant terms (P>0.05) were then removed in a step-wise fashion to arrive at the final model. The predicted means for the demographic effects were compared using the LSD, generated using the PDIFF function to perform pairwise t-tests in SAS (SAS, 2002).
Statistical analysis of willingness to pay
As the currencies differed between countries, willingness to pay was expressed as a proportion of good-every-day (P-WTP), for each quality grade; unsatisfactory, good-every-day, better-than-every-day and premium, as previously described by Lyford et al. (Reference Lyford, Thompson, Polkinghorne, Miller, Nishimura, Neath, Allen and Belasco2010). This was analysed as the dependent variable in a linear mixed effects model, using the MIXED procedure in SAS (SAS, 2002). The random terms were consumer identification number, within country and session. As for the sensory score analysis, the demographic factors were included as fixed effects. The country where the session attended by the consumer and the cooking method, including degree of doneness, used in the session were also included as fixed effects. All fixed effects were interacted with country and quality grade. Non-significant terms (P>0.05) were then removed in a step-wise fashion to arrive at the final model. The predicted means for the demographics effects were compared using the LSD generated using the PDIFF function in SAS (SAS v9.1).
Results and discussion
The effect of a consumer’s preferred level of cooking doneness on sensory scores
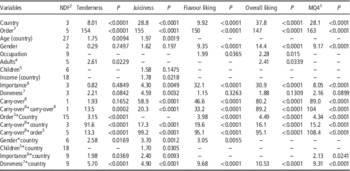
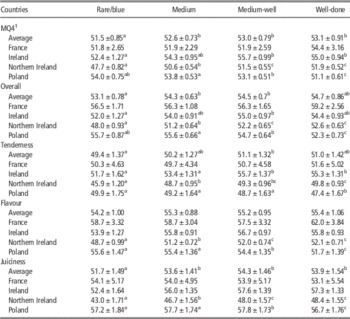
Confirming our hypothesis, consumers who preferred their beef cooked medium-well or well-done scored beef more favourably than consumers who preferred their beef cooked medium or less (P<0.01), although this effect varied between countries as the interaction between both factors was significant (Table 3). The group of consumers in Northern Ireland who preferred their beef cooked well-done or medium-well scored beef samples ~4 points higher (P<0.05) than consumers who preferred their beef cooked blue/rare, and slightly higher than those who preferred medium (Table 4). This pattern was also present for the Irish consumers for tenderness, overall liking and MQ4, but to a lower extent (P<0.05). In contrast, the Polish consumers who preferred their beef cooked well-done or medium-well scored beef samples ~3 points lower (P<0.05) than consumers who preferred their beef cooked blue, rare or medium (Table 4). There was no effect of preferred cooking doneness for the French consumers.
The F-values for the linear mixed effects model, predicting MQ4Footnote 1 and sensory scores for beef samples

NDF=Numerator degrees of freedom; MQ4=Meat Quality 4.
1 MQ4=a weighted combination (0.3, 0.1, 0.3, 0.3) of four sensory scores, tenderness, juiciness, flavour liking and overall liking.
2 Denominator degrees of freedom is 111 000.
3 The order in which the product was served to the consumer.
4 Number of adults in the household.
5 Number of children in the household.
6 The importance of beef in their diet.
7 The preferred degree of cooking doneness of the consumer.
8 The sensory score of the previously tasted sample.
Predicted sensory score means (±SE) of beef samples by a consumer’s preferred level of doneness

MQ4=Meat Quality 4.
a,b,cValues within a row with different superscript letters differ significantly at P<0.05.
1 MQ4=a weighted combination (0.3, 0.1, 0.3, 0.3) of four sensory scores, tenderness, juiciness, flavour liking and overall liking.
This result is supported by Hwang et al. (Reference Hwang, Polkinghorne, Lee and Thompson2008) and Thompson et al. (Reference Thompson, Pleasants and Pethick2005) who found a similar trend in Australian consumers. In contrast, the Polish consumers exhibited the opposite relationship with consumers who preferred beef cooked medium-well or well-done scoring samples less favourably. This may partially be explained by variations in the different degrees of cooking doneness used in this study, as consumers’ rate beef cooked to their preferred cooking doneness higher (Cox et al., Reference Cox, Thompson, Cunial, Winter and Gordon1997). More Northern Irish and Polish consumers preferred beef cooked medium-well to well-done than any other category. As the majority of Northern Irish consumers also tasted beef cooked well-done, it would be expected that there would be a positive relationship between preferred cooking doneness and consumer scores. However, while a large proportion of Polish consumers also preferred beef cooked medium-well to well-done, the Polish consumers tasted beef cooked medium, possibly underpinning the negative relationship between cooking doneness and consumer scores seen for this group. However, this theory does not explain the behaviour of the Irish consumers; therefore, other factors, such as preferred cooking method, may also be influencing the results. The lack of response identified for the French consumers may have resulted from the uneven distribution of consumers over the doneness categories, with the overwhelming majority preferring their beef cooked medium. This should not be taken as an indication of the general population however, as consumers who preferred their beef cooked medium were actively recruited for this part of the study.
The effect of the importance of red meat on sensory scores
The hypothesis that consumers would score beef more favourably if they considered red meat to be a more important part of their diet was supported by consumers in Poland, France and Northern Ireland, but not by those tested in Ireland.
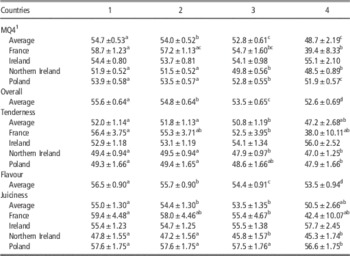
For most of the sensory scores, the more important consumers considered red meat in their diet, the more favourably (P<0.01) they scored beef (Table 3). This effect was the most pronounced for the French consumers, with a change in the average sensory scores by over 19 points out of 100 for MQ4, and 4 points for tenderness and juiciness (P<0.05) (Table 5). The responses for both the Northern Irish and Polish consumers were small, with sensory scores changing by 1 to 3.4 points (P<0.05) over the range of importance tested (Table 5). The magnitude of the effect in Poland and Ireland is similar to the findings of Thompson et al. (Reference Thompson, Pleasants and Pethick2005), who used the same technique with Australian consumers tasting lamb. The sensory scores for overall liking and flavour changed by 3 points over the range and did not vary by country (P<0.05).
Predicted sensory score means (±SE) of beef samples by the importance of red meat in a consumer’s diet

MQ4=Meat Quality 4.
1=red meat is an important part of my diet; 2=red meat is a regular part of my diet; 3=red meat is part of my diet but it would not worry me if it was not; 4=I rarely/never eat red meat.
a,b,c,dValues within a row with different superscript letters differ significantly at P<0.05.
Where the effect did not vary by country, only average values were reported.
1 MQ4=a weighted combination (0.3, 0.1, 0.3, 0.3) of four sensory scores, tenderness, juiciness, flavour liking and overall liking.
Notably, the effect seen for the French consumers was much larger than for the other groups. This result should be treated with caution due to the poor spread of French consumers over the four possible responses, with only 0.13% in the least important category. In contrast, the Polish data had between 20% and 30% of consumers in each category. Further investigation with a more balanced distribution of consumers is required to fully quantify the effect of the importance of meat in the diet for French consumers on their perception of the eating quality of beef.
In Ireland, there were no relationships detected between sensory scores and the importance of beef in the diet, except for flavour liking and overall liking. Therefore, we reject our hypothesis for this group. This result is supported by work on Korean and Australian consumers by Hwang et al. (Reference Hwang, Polkinghorne, Lee and Thompson2008) who also found no relationship. The spread of consumers across the four important classes was very similar for the Irish and Northern Irish data, consequently, we expect that the difference in the relationships found are more likely related to actual differences in consumer behaviour. This is supported by the work of Lorenzen et al. (Reference Lorenzen, Neely, Miller, Tatum, Wise, Taylor, Buyck, Reagan and Savell1999) and Neely et al. (Reference Neely, Lorenzen, Miller, Tatum, Wise, Taylor, Buyck, Reagan and Savell1999) who both found that consumers in different geographical areas scored beef sensory quality differently. However, it is also possible that the analysis was not sensitive enough to pick up such a small effect in the smaller number of consumers tested in Ireland.
The effect of gender on sensory scores
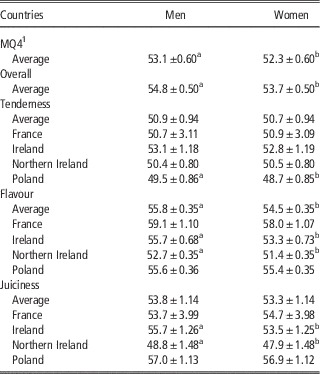
Contrary to our hypothesis, men scored beef samples more favourably than women where a significant difference was found. Men scored beef samples higher than women by about 1 point out of 100 for overall liking and MQ4 (P<0.05) (Table 6). A similar effect was seen for flavour (P<0.05) and juiciness (P<0.05), but only among Irish and Northern Irish consumers where men scored beef samples 1 to 2 points higher. For tenderness, only the Polish showed a difference between genders, with men scoring about 1 point higher (P<0.05).
Predicted sensory score means (±SE) of beef samples by the consumer’s gender

MQ4=Meat Quality 4.
Where the effect did not vary by country, only average values were reported.
a,bValues within a row with different superscript letters differ significantly at P<0.05.
1 MQ4=a weighted combination (0.3, 0.1, 0.3, 0.3) of four sensory scores, tenderness, juiciness, flavour liking and overall liking.
The difference we found between men and women is supported by Gregory (Reference Gregory1997) and Kubberød et al. (Reference Kubberød, Ueland, Rødbotten, Westad and Risvik2002) who also found that men scored meat more favourably than women. However, although this trend was also seen for the other sensory scores, it was not seen consistently across countries. One explanation for the variable responses found between countries could be linked to a consumer’s perception of the importance of red meat in their diet. Kubberød et al. (Reference Kubberød, Ueland, Rødbotten, Westad and Risvik2002) in the same study also found that men had a more positive attitude towards red meat. As our study and other previous studies have shown that consumers who consider meat to be important in their diet score beef more favourably, it is possible that the differences in the sexes reported by Kubberød et al. (Reference Kubberød, Ueland, Rødbotten, Westad and Risvik2002) may be confounded by the consumer’s attitude towards red meat. In our case, we found that Irish men were more likely to score beef as very important in their diet (data not shown), and Polish women were more likely to never/rarely eat red meat (data not shown). All other categories had fairly even distributions. Therefore, the lack of a clear consistent gender effect for all sensory scores and countries may be related to the lack of a consistent gender bias in the importance of red meat in the diet of the consumers in this study.
The effect of the country on willingness to pay and proportional willingness to pay
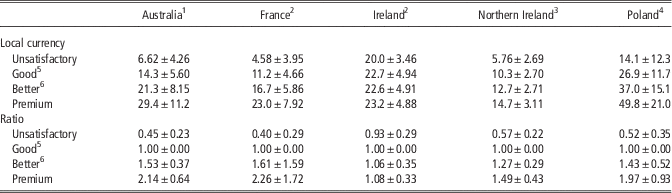
Supporting our hypothesis, consumers in all countries showed a general trend for the willingness to pay to increase with the quality level (Table 7). This was most evident for the French consumers, increasing from €5 to €23, and least evident for the Irish consumers, where the difference between unsatisfactory and premium was only €3. The consumers from Northern Ireland were willing to pay a similar amount for unsatisfactory and good-every-day as the French consumers, but this trend did not continue, and they were only willing to pay €14.7 for premium beef (Table 7). The Australian consumers were willing to pay almost $30 for premium beef, but only $6.6 for the unsatisfactory category.
Means±SD of the raw willingness to pay values both in local currency

1 Australian dollars.
2 Euros.
3 Pounds.
4 Źloty.
5 Good-every-day.
6 Better-than-every-day.
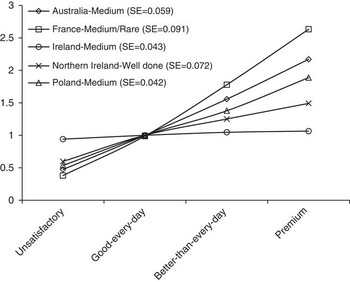
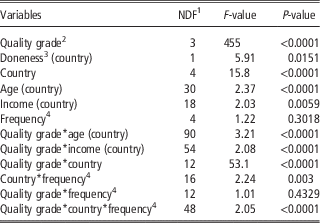
The F-values for the final model can be seen in Table 8. Country had a significant effect on P-WTP, and this varied by quality grade (Figure 1). All countries except Ireland were willing to pay around half the price for unsatisfactory beef than good-every-day. The French consumers were willing to pay proportionally more for both better-than-every-day (1.78) and premium beef (2.63), closely followed by the Australian consumers (1.56, 2.17) (P<0.05). The results for the Australian consumers line up well with the findings of both Lyford et al. (Reference Lyford, Thompson, Polkinghorne, Miller, Nishimura, Neath, Allen and Belasco2010) and Thompson et al. (Reference Thompson, Polkinghorne, Gee, Motiang, Strydom, Mashau, Ng’ambi, deKock and Burrow2010). The Polish consumers were willing to pay almost double for premium beef (1.89) than good-every-day, and one and a half times more (1.38) for better-than-every-day (P<0.05). Increasing beef quality had a smaller effect on P-WTP in Northern Ireland, with consumers willing to pay only 1.49 times as much for premium beef than good-every-day beef, and 1.25 for better-than-every-day beef (P<0.05).
Willingness to pay, expressed as a ratio of the good-every-day grade, for each country (standard error over the continuum), adjusted for demographic and meat consumption preferences.

The F-values for the base model, predicting the ratio of willingness to pay for beef classed as good-every-day compared with unsatisfactory, better-than-every-day and premium

NDF=nominator degrees of freedom.
1 Denominator degrees of freedom=38 000.
2 Quality grade; unsatisfactory, good-every-day, better-than-every-day and premium.
3 Final cooking doneness used in the consumer panel before the questionnaire, rare, medium or well-done.
4 Frequency of eating beef from daily to never.
Consumers from Ireland went against the general trend of the other countries reported in this study. They were willing to pay proportionally more for better quality beef; however, this response was markedly smaller than for the other countries (Figure 1), and the only differences evident were between the unsatisfactory category compared with the better-than-every-day and premium categories (P<0.05).
This is in contrast to the work by Lyford et al. (Reference Lyford, Thompson, Polkinghorne, Miller, Nishimura, Neath, Allen and Belasco2010) who found that Irish consumers were willing to pay double for premium beef than good-every-day quality. However, for their analysis, Lyford et al. (Reference Lyford, Thompson, Polkinghorne, Miller, Nishimura, Neath, Allen and Belasco2010) excluded all consumer responses in which the lower quality grades had a higher willingness to pay than the higher quality grades. This assumes that consumers were willing to pay more for better quality beef, and would cloud any other relationship. Such an assumption was not used in this study so as not to bias the data. Second, the structure of the questionnaire differed between Ireland and the other countries: Irish consumers used a ‘tick-box’ questionnaire format instead of the ‘mark the line’ format used in the other countries in this experiment. Lyford et al. (Reference Lyford, Thompson, Polkinghorne, Miller, Nishimura, Neath, Allen and Belasco2010) found that a ‘tick the box’ format significantly reduced the range of the responses and therefore blunted the willingness to pay results for Australian consumers. Subsequently, we would treat the result from Ireland with caution, and further work in that area would need to consider the effect of questionnaire format on the responses. Adding further weight to this idea, the Northern Irish consumers, which are geographically and culturally similar to the Irish consumers, had similar responses to the other countries in this experiment, which all used a ‘mark the line’ format for the questionnaire.
The effect of consumer age on proportional willingness to pay
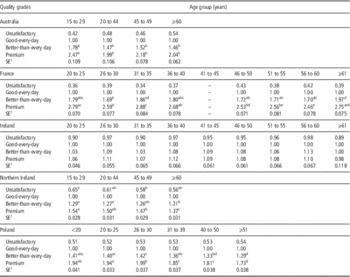
Aligning with our hypothesis, consumer age had a negative relationship with P-WTP for four out of the five countries examined in this study (Table 9). For most countries, consumer age only had an effect on P-WTP for better-than every-day and premium quality grades (Table 9). For the Australian consumers, participants between 15 to 29 years had a higher P-WTP for better-than-every-day and premium than older consumers (P<0.05). This is similar to Northern Ireland where consumers between 15 and 29 years had a higher P-WTP than older consumer groups for the premium quality (P<0.05) and older consumers had a lower P-WTP for the better-than-every-day category. Following this same pattern, as consumers got older in Poland the P-WTP for better-than-every-day and premium beef decreased (Table 9). French consumers of different age groups differed in their P-WTP for both the better-than-every-day and premium categories. This aligns well with previous Australian data (Lyford et al., Reference Lyford, Thompson, Polkinghorne, Miller, Nishimura, Neath, Allen and Belasco2010) and similar patterns have also been identified in Japanese, American and South African consumers (Feuz et al., Reference Feuz, Umberger, Calkins and Sitz2004; Lyford et al., Reference Lyford, Thompson, Polkinghorne, Miller, Nishimura, Neath, Allen and Belasco2010; Thompson et al., Reference Thompson, Polkinghorne, Gee, Motiang, Strydom, Mashau, Ng’ambi, deKock and Burrow2010). Further supporting this relationship, younger consumers’ also out-bid older consumers for tender steaks in a mock auction in the United States (Lusk et al., Reference Lusk, Fox, Schroeder, Mintert and Koohmaraie2001).
Predicted means for willingness to pay expressed as a ratio of good-every-day for the quality grade for each age group by country

a,b,c,d,eValues within a row with different superscript letters differ significantly at P<0.05.
1 Standard error for each age group by country.
Although there were many significant differences for the French consumers, the relationship between age and willingness to pay was less clear. The consumers aged between 30 and 40 years tended to have had a higher P-WTP than the consumers aged between 40 and 60. Consumers aged above 60 appeared to have a similar P-WTP to the younger consumers. This may be a result of the greater number of age categories used for the French questionnaire allowing for the more subtle relationships to be elucidated, while concurrently reducing the number of consumers within each category. There is evidence that there is a curvilinear effect in the younger age groups, with P-WTP peaking around 35 years (Lyford et al., Reference Lyford, Thompson, Polkinghorne, Miller, Nishimura, Neath, Allen and Belasco2010). Therefore, with an increasing sample size this curvilinear relationship may become clearer for the French consumers. In contrast to other work by Lyford et al. (Reference Lyford, Thompson, Polkinghorne, Miller, Nishimura, Neath, Allen and Belasco2010), Irish consumers demonstrated no relationship between consumer age and P-WTP. This may be due to the very small variations in P-WTP between the quality grades seen in this study reducing the ability of our statistical analysis to detect such relationships.
The effect of the frequency of beef consumption on proportional willingness to pay
In support of our hypothesis, there was no relationship between beef eating frequency and P-WTP in any of the countries tested except France. This is supported by Lyford et al. (Reference Lyford, Thompson, Polkinghorne, Miller, Nishimura, Neath, Allen and Belasco2010), who also found no effect in Australia, Japan, the Unite States and Ireland. Consumers from France who ate beef fortnightly or less had a higher P-WTP by ~0.5 for both good-every-day and premium beef than consumers who ate beef more frequently (data not shown) (P<0.05). In addition, French consumers who ate beef two to three times a week had a higher P-WTP for premium beef than consumers who ate beef weekly (P<0.05), though this difference was much smaller (data not shown). The different behaviour of the French consumers may be cultural, with the consumers eating beef less frequently considering beef a premium or luxury product. Uncovering the exact motivations of the French consumers would require further investigation.
The effect of income on proportional willingness to pay
Validating our hypothesis, there was no relationship between income and P-WTP for the Australian, Irish and Northern Irish consumers. This is in alignment with the results of Lyford et al. (Reference Lyford, Thompson, Polkinghorne, Miller, Nishimura, Neath, Allen and Belasco2010), Feuz et al. (Reference Feuz, Umberger, Calkins and Sitz2004) and Lusk et al. (Reference Lusk, Fox, Schroeder, Mintert and Koohmaraie2001) who also found no relationship between income and P-WTP for Australian, Japanese, American and Irish consumers. However, in contrast to this, we found that income significantly influenced P-WTP for the French and Polish consumers (data not shown), thus we reject our hypothesis for these groups. French consumers exhibited a slight decrease in P-WTP for better-than-every-day quality in the middle income groups (1.76 to 1.56, SE 0.09) (P<0.05, data not shown). Similarly, French consumers with incomes of €1000 to €2000 and >€6000 per month were willing to pay proportionally more for premium beef than consumers in the middle income ranges (2.55 to 2.22, SE 0.09) (P<0.05, data not shown). In contrast, the Polish consumers’ P-WTP had a more direct relationship with income. P-WTP for premium beef increasing from 1.87 to 1.98 times good-every-day as income increased from zł 1001–1400 per month to zł 4000 per month and more (P<0.05). This may indicate that the Polish and French consumers differ from the other countries or may be due to the different income brackets used for the countries reflecting different income levels, relative to gross domestic product, between the two countries. These results are supported by Reicks et al. (Reference Reicks, Brooks, Garmyn, Thompson, Lyford and Miller2011) who found that consumers with higher incomes did not consider price as important when purchasing beef. The positive relationship between income and P-WTP in both Poland and France is worth further investigation as it suggests there is a niche for high-quality branded products.
The effect of other demographic factors on sensory scores and proportional willingness to pay
Contrary to our hypothesis, we found small effects of occupation, income and the number of adults and children in the household, on a consumer’s evaluation of beef eating quality (data not shown). Tradespeople, professionals and administrators scored beef about 0.5 to 1 point lower than technical personnel, students and unemployed/retired people (P<0.05). The number of adults in the home had a small positive effect on consumer scores for overall liking and tenderness (data not shown). Consumers with two adults in the home scored beef about 0.5 to 1 point lower than consumers with three or four adults in the home (P<0.05). In the case of occupation and adults in the home, the effects were similar to the size of the standard error (data not shown).
Consumer age had a small negative relationship with tenderness in France and Poland, and with juiciness in Ireland, Northern Ireland and Poland (data not shown). The reduction was about 4 points for tenderness and 2 to 3 points for juiciness (P<0.05). In contrast, there was a small positive relationship between consumer age and tenderness scores in Northern Ireland (data not shown). The youngest age group scored beef about 1 point out of 100 lower than the older age groups (P<0.05).
These effects are in contrast to the findings of Hwang et al. (Reference Hwang, Polkinghorne, Lee and Thompson2008) who found no relationships between these demographic categories and sensory scores for beef. However, in our study the size of these effects was very small, approaching the standard deviations for the predicted means. Similar, small, effects for some demographic factors were found in the study of Thompson et al. (Reference Thompson, Pleasants and Pethick2005). In both cases, the size of the effects indicates that these results may not be repeatable and would be of limited use for any practical applications.
In agreement with our hypothesis, the demographic factors of gender, occupation, the number of adults in the home and the number of children in the home had no effect on P-WTP. This is supported by the results of Lyford et al. (Reference Lyford, Thompson, Polkinghorne, Miller, Nishimura, Neath, Allen and Belasco2010) who also found no effect of these factors for Australian, Japanese, American and Irish consumers. These results are further corroborated by Reicks et al. (Reference Reicks, Brooks, Garmyn, Thompson, Lyford and Miller2011) who found that these demographic factors had no effect on the importance of price when consumers were making purchasing decisions.
Design effects on consumer sensory scores
Carry-over effects from the previous sample and the serve order of the sample had strong effects in this study. This was expected on the basis of previous work which used similar experimental protocols with Australian and Korean consumers (Thompson et al., Reference Thompson, Pleasants and Pethick2005; Hwang et al., Reference Hwang, Polkinghorne, Lee and Thompson2008). Our results highlight the importance of using a Latin square design for the presentation order of samples, as opposed to a randomised design. This was first described by Williams (Reference Williams1949) and validated for this style of experiment by Watson et al. (Reference Watson, Polkinghorne and Thompson2008b) and ensures that the effects of previous samples are equally distributed across the samples. In addition, the carry-over and order effects were by far the most prominent for the second sample (data not shown), demonstrating that the eating quality of the first sample would have a disproportionately large effect on the scores for the second sample. In anticipation of this effect in this experiment, an average quality ‘link’ sample was the first sample served to consumers. This would then minimise the variation attributable to the halo effects for this group, as was proposed by Watson et al. (Reference Watson, Polkinghorne and Thompson2008b).
Conclusion
The way consumers score beef eating quality is highly consistent between different demographic groups. Willingness to pay for beef is also transferrable across different demographics. As consumers from different demographic groups have a similar appreciation of beef quality, this provides strong evidence that a single descriptor of eating quality will likely be applicable to the entire European market. If such a descriptor could be predicted from information available at slaughter then our results demonstrate that it could be used as the base of an eating quality-based grading system for beef. The provision of information on eating quality to the consumer would allow consumers to exercise their willingness to pay, realising the 1.5 to 2-fold increase in value for premium beef, and the 50% penalty in value for unsatisfactory beef. If these price differentials were realised, it would send a price signal through the beef supply chain, encouraging producers to include eating quality in their breeding and management strategies.
Acknowledgements
This research was supported by Meat and Livestock Australia and Murdoch University. Data were obtained through the financial contributions of the European research project ProSafeBeef (Contract No. FOOD-CT-2006-36241), the Polish ProOptiBeef Farm to Fork project funded by the EU Innovative (POIG.01.03.01-00-204/09), the French ‘Direction Générale de l’Alimentation’ and FranceAgriMer, the Irish Department of Agriculture Food and The Marine under the FIRM programme and the Northern Ireland Department of Agriculture and Rural Development ‘Vision’ programme. Furthermore, this project would not have been possible without the practical support of the Association Institut du Charolais, the Syndicat de Défense et du promotion de la Viande de Boeuf de Charolles and the gourmet restaurants ‘Jean Denaud’ and representatives of the beef industry across Europe. The international travel required for this project has been funded by ‘Egide/Fast’ funds from the French and Australian governments, respectively (project no. FR090054) and by ‘Egide/Polonium’ funds from the French and Polish governments, respectively. The assistance and participation the Beef CRC and Janine Lau (MLA, Australia), Alan Gee (Cosign, Australia), Ray Watson (Melbourne University, Australia) and John Thompson (UNE) are also gratefully acknowledged.