1 Introduction
The giant gaseous planets like Jupiter and Saturn can be seen as paradigmatic systems to study geostrophic turbulent flows (see Vasavada & Showman (Reference Vasavada and Showman2005) for Jupiter). The Galileo and Cassini missions gave high-resolution observations of Jupiter’s troposphere dynamics (Porco et al.
Reference Porco, West, McEwen, Del Genio, Ingersoll, Thomas, Squyres, Dones, Murray and Johnson2003; Salyk et al.
Reference Salyk, Ingersoll, Lorre, Vasavada and Del Genio2006). The large alternating coloured bands at the top of the troposphere are correlated with the zonal wind vorticity. Vortices with a scale of approximately a thousand kilometres often appear after three-dimensional convective activity in the atmosphere. The interaction between those vortices and the zonal jets continuously transfers energy to the barotropic component (Ingersoll et al.
Reference Ingersoll, Beebe, Mitchell, Garneau, Yagi and Müller1981; Salyk et al.
Reference Salyk, Ingersoll, Lorre, Vasavada and Del Genio2006), and equilibrates the dissipation mechanisms. The dynamics of large-scale jet formation may be qualitatively well understood within the framework of two-dimensional geostrophic turbulence in a
 $\unicode[STIX]{x1D6FD}$
-plane (Pedlosky Reference Pedlosky1982), although more refined models are needed to understand their quantitative features (Li, Ingersoll & Huang Reference Li, Ingersoll and Huang2006; Schneider & Liu Reference Schneider and Liu2009). As the aim of this work is to make progress in the theoretical understanding of turbulent flows, we consider geostrophic turbulence in the simple barotropic
 $\unicode[STIX]{x1D6FD}$
-plane model. Despite all its limitations, for instance the lack of dynamical effects related to baroclinic instabilities, we will show that this model reproduces the main qualitative features of the velocity profiles.
An interesting property of two-dimensional turbulent flows is their inverse energy transfer from small scales to large scales, sometimes through a cascade among scales, but much more often through a direct transfer from small scale to large scale mediated by the large-scale flow. This inverse energy transfer is responsible for the self-organization of the flow into large-scale coherent structures that may evolve much slower than the eddies. Among those structures, giant vortices and zonal jets have raised strong interest in the scientific community. The
 $\unicode[STIX]{x1D6FD}$
-effect favours the formation of jets, but without the
 $\unicode[STIX]{x1D6FD}$
-effect both jets and vortices can be observed in numerical simulations (Sommeria Reference Sommeria1986; Bouchet & Simonnet Reference Bouchet and Simonnet2009; Frishman, Laurie & Falkovich Reference Frishman, Laurie and Falkovich2017). Both structures are also observed in the atmosphere of gaseous planets (Ingersoll Reference Ingersoll1990; Galperin, Sukoriansky & Huang Reference Galperin, Sukoriansky and Huang2001; Galperin et al.
Reference Galperin, Young, Sukoriansky, Dikovskaya, Read, Lancaster and Armstrong2014). The computation of statistical equilibrium theory of the two-dimensional Euler and quasi-geostrophic equations (Bouchet & Venaille Reference Bouchet and Venaille2012), using large-deviation theory, led to the conclusion that zonal jets as well as large vortices are stable equilibrium states of the flow, and thus natural attractors. However, planetary flows are continuously damped and forced, and a non-equilibrium theory must explain the selection between all such possible attractors.
The exact shape of zonal winds on Jupiter reveals an astonishing asymmetry between eastward jets and westward jets (Garcí & Sánchez-Lavega Reference Garcí and Sánchez-Lavega2001; Porco et al.
Reference Porco, West, McEwen, Del Genio, Ingersoll, Thomas, Squyres, Dones, Murray and Johnson2003; Sánchez-Lavega et al.
Reference Sánchez-Lavega, Orton, Hueso, García-Melendo, Pérez-Hoyos, Simon-Miller, Rojas, Gómez, Yanamandra-Fisher and Fletcher2008). Whereas eastward jets form cusps at their maximum velocity, westward jets are smoother, close to a parabolic velocity profile. At the same time, the profile of potential vorticity (PV) looks like a ‘staircase’ (Dritschel & McIntyre Reference Dritschel and McIntyre2008), and all those prominent features are well reproduced in direct numerical simulations of
 $\unicode[STIX]{x1D6FD}$
-plane turbulence. One could ‘postulate’ a PV staircase profile and derive the corresponding mean flow (Dritschel & McIntyre Reference Dritschel and McIntyre2008). This exercise is very enlightening, as it roughly relates jet spacing to other flow properties. Nevertheless, the physical mechanism leading to the staircase profile remains unclear. Moreover, as our discussion will clearly show, the PV staircase is just a useful idealized approximation: the actual jet profile will depend on the control parameters, for instance friction, force spectrum and
 $\unicode[STIX]{x1D6FD}$
.
Starting from the stochastic barotropic
 $\unicode[STIX]{x1D6FD}$
-plane model, our aim is to derive simple general relations for the jet velocity profile. A promising non-equilibrium statistical theory explaining jet formation is the stochastic structural stability (S3T) theory (Farrell & Ioannou Reference Farrell and Ioannou2003, Reference Farrell and Ioannou2007) or the closely related second-order cumulant expansion (CE2) theory (Marston, Conover & Schneider Reference Marston, Conover and Schneider2008). The key ingredient in those theories is to neglect eddy–eddy interactions, keeping only the interaction between eddies and the mean flow. With this quasi-linear approximation, there is no inverse energy cascade in Fourier space any more, and the inverse energy flux goes through interactions with the mean flow. This may be relevant only when the inverse energy cascade flux is negligible. The flow governed by the S3T equations, with or without phenomenological added stochastic forcing, produces the spontaneous emergence and equilibration of zonal jets (Constantinou, Farrell & Ioannou Reference Constantinou, Farrell and Ioannou2014; Bakas & Ioannou Reference Bakas and Ioannou2014), the velocity profiles of which reproduce quite well the main features of jets obtained in rotating-tank experiments (Read et al.
Reference Read, Yamazaki, Lewis, Williams, Miki-Yamazaki, Sommeria, Didelle and Fincham2004), in numerical experiments (Williams Reference Williams1978; Vallis & Maltrud Reference Vallis and Maltrud1993) or in the atmosphere of gaseous planets.
The question of why and when this quasi-linear approximation should give such good results has been addressed in Bouchet, Nardini & Tangarife (Reference Bouchet, Nardini and Tangarife2013). The main result is that the quasi-linear approximation is self-consistent in the inertial limit of weak stochastic forcing and dissipation, when the inertial time scale is much smaller than the spin-up or spin-down time scale. For Jupiter, the inertial time scale is of the order of a day or a month, while the spin-up or spin-down time scale, related to dissipative phenomena (radiative balance on Jupiter), may be of the order of ten years (see e.g. Porco et al. Reference Porco, West, McEwen, Del Genio, Ingersoll, Thomas, Squyres, Dones, Murray and Johnson2003). Moreover, it follows from the analysis of Bouchet et al. (Reference Bouchet, Nardini and Tangarife2013) that the quasi-linear equations are expected to be valid above a cross-over scale, which tends to zero in the limit of weak stochastic forces and dissipation limit. Using this justified approximation in the inertial limit, it is then possible to write a closed equation for the evolution of the mean velocity.
If we assume that all the energy injected by the force is locally transferred to the mean flow, we obtain
 $$\begin{eqnarray}\langle uv\rangle =\frac{\unicode[STIX]{x1D716}}{U^{\prime }},\end{eqnarray}$$
where
 $U$
is the mean zonal velocity profile,
 $U^{\prime }$
its derivative with respect to the south–north coordinate
 $y$
,
 $\langle uv\rangle$
the Reynolds stress, and
 $\unicode[STIX]{x1D716}$
the energy injection rate per unit of mass. Such a formula for the Reynolds stress might give a closed equation for the zonal jet, and is consequently very appealing. This expression is very similar to the one discussed in Laurie et al. (Reference Laurie, Boffetta, Falkovich, Kolokolov and Lebedev2014) for a vortex without the
 $\unicode[STIX]{x1D6FD}$
-effect. In this paper this formula was obtained by neglecting the pressure term and the cubic terms in the energy balance relation, without justification. A more general formula, taking into account possible small-scale dissipation, was actually obtained previously by Srinivasan & Young (Reference Srinivasan and Young2014), through explicit computation assuming a constant shear flow
 $U^{\prime }=\text{const.}$
A similar result also holds in the case of dipoles for the two-dimensional Navier–Stokes equations (Kolokolov & Lebedev Reference Kolokolov and Lebedev2016a
,Reference Kolokolov and Lebedev
b
). Through numerical computations, Laurie et al. (Reference Laurie, Boffetta, Falkovich, Kolokolov and Lebedev2014) have shown that the analogous result for the two-dimensional Navier–Stokes equations actually predicts correctly the velocity profile in a restricted part of the domain, far from the core of the vortex and far from the flow separatrix. Kolokolov & Lebedev (Reference Kolokolov and Lebedev2016a
) give scaling arguments to show in which domain of the flow the theoretical expression for the velocity profile is expected to hold.
In § 3, following preliminary results in Woillez & Bouchet (Reference Woillez and Bouchet2017), we prove that (1.1) can be deduced as a consequence of the two limits of weak forces and dissipation on one hand, and of small-scale forcing on the other hand. This first result justifies (1.1) and clarifies the required hypothesis. By contrast with our previous work (Woillez & Bouchet Reference Woillez and Bouchet2017), in the present paper we discuss completely the mathematical justification when taking the limit of small-scale forces before the inertial limit of weak forces and dissipation. The other order for these limits is much simpler mathematically, but is not relevant for turbulent flows.
In § 3.3, we use result (1.1) to write a closed equation for the mean velocity profile
 $U$
. We solve it for the resulting stationary profile. With such an equation, the stationary profile diverges at some finite latitude. We thus conclude that the appealing formula (1.1) is valid only far from the jet tips, where
 $U^{\prime }$
does vanish. A more refined analysis is required to deal with the zonal jet velocity extrema.
In § 4, using Laplace transform tools, we derive an equation for the Reynolds stress divergence in the inertial limit. Taking afterwards the small-scale forcing limit, we give a set of equations that describe the zonal velocity extremum of the eastward jet. Although the full numerical calculation of the solution is avoided, we give some arguments to show that this set of equations leads to the formation of a ‘cusp’ of typical size
 $1/K$
, where
 $1/K$
is a typical scale of the stochastic forcing. We explain that this cusp has no universal shape: it depends on the stochastic forcing spectrum and on the dissipative mechanism. Yet we derive a relation, valid when viscous phenomena are negligible at the size of the cusp, that relates the curvature of the cusp to the maximal velocity
 $U(y_{cr})$
. It can be written as
 $$\begin{eqnarray}U(y_{cr})U^{\prime \prime }(y_{cr})=-\frac{\unicode[STIX]{x1D716}K^{2}}{r},\end{eqnarray}$$
where
 $r$
is the linear friction coefficient in s
 $^{-1}$
(see (4.8)). Remarkably, this relation does not depend on the forcing spectrum, but just on
 $\unicode[STIX]{x1D716}$
.
On the contrary, the westward jet cannot form this cusp because it would violate the Rayleigh–Kuo criterion of stability. In § 5, we derive a self-consistent equation for the westward jet extrema. We explain that an instability can develop at the extremum, and how it stops the westward jet growth such that the zonal flow forms a parabolic profile of curvature approximately
 $\unicode[STIX]{x1D6FD}$
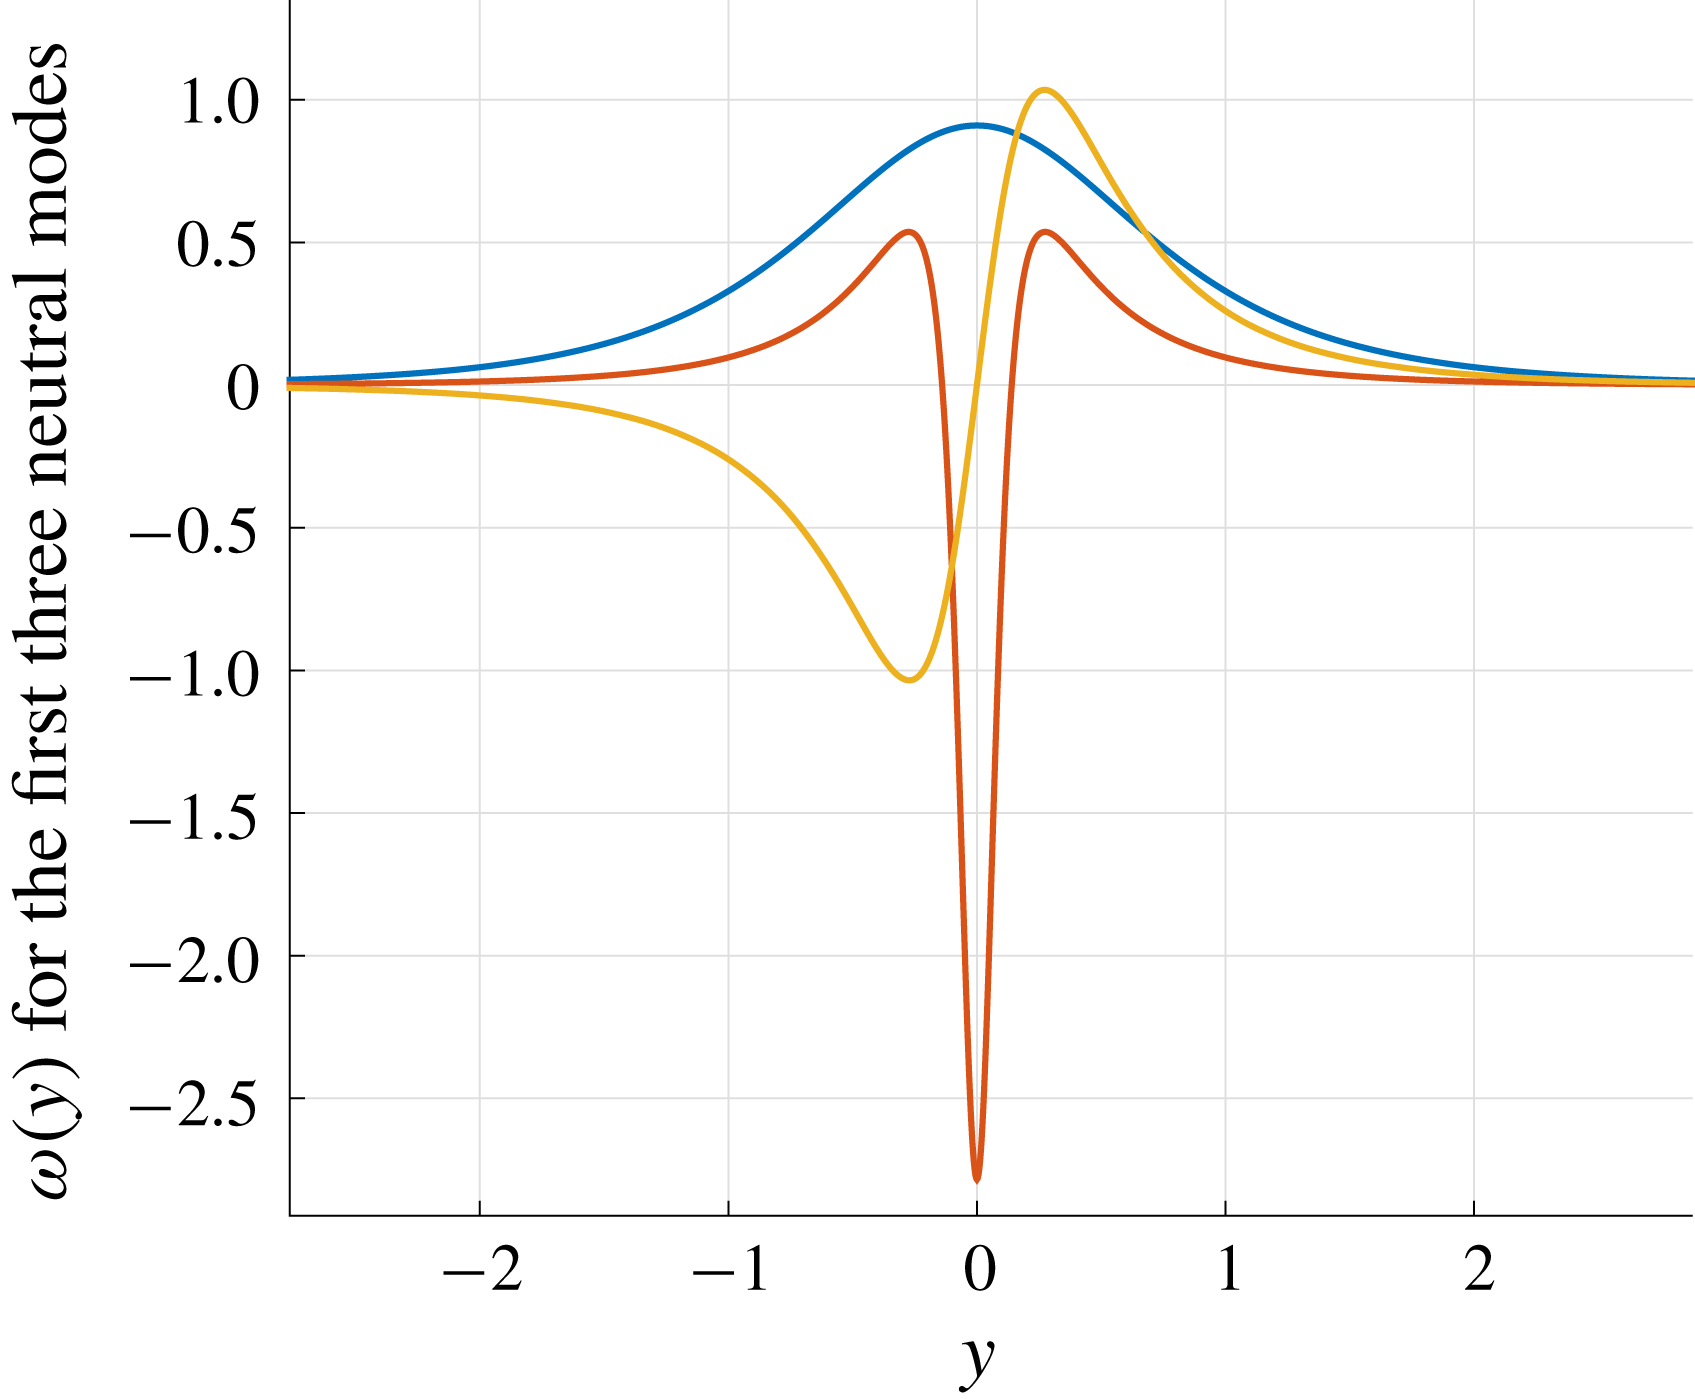
. This is compatible with the classical idea of barotropic adjustment. We also demonstrate that the appearance of neutral modes (modified Rossby waves) is not sufficient to arrest the growth of the jet extremum velocity, and that a marginal and transient instability is necessary.
2 Reynolds stresses from energy, enstrophy and pseudo-momentum balances
2.1 The stochastic barotropic
 $\unicode[STIX]{x1D6FD}$
-plane model

We start from the equations for a barotropic flow on a periodic
 $\unicode[STIX]{x1D6FD}$
-plane with stochastic forces,
 $$\begin{eqnarray}\displaystyle \left.\begin{array}{@{}c@{}}\unicode[STIX]{x2202}_{t}\unicode[STIX]{x1D6FA}+\boldsymbol{V}\boldsymbol{\cdot }\unicode[STIX]{x1D735}\unicode[STIX]{x1D6FA}=-r\unicode[STIX]{x1D6FA}-\unicode[STIX]{x1D6FD}_{d}V_{y}+\sqrt{2\unicode[STIX]{x1D716}}\unicode[STIX]{x1D702},\\ \unicode[STIX]{x1D735}\boldsymbol{\cdot }\boldsymbol{V}=0,\end{array}\right\} & & \displaystyle\end{eqnarray}$$
where the vorticity
 $\unicode[STIX]{x1D6FA}:=(\unicode[STIX]{x1D735}\wedge \boldsymbol{V})\boldsymbol{\cdot }\boldsymbol{e}_{z}$
is the curl of the two-dimensional velocity field
 $\boldsymbol{V}:=\left(\!\begin{smallmatrix}V_{x}\\ V_{y}\end{smallmatrix}\!\right)$
,
 $r$
models a linear friction,
 $x$
and
 $y$
are the east–west and north–south coordinates, respectively,
 $\unicode[STIX]{x1D6FD}_{d}$
is the Coriolis parameter, and
 $\unicode[STIX]{x1D702}$
is a stochastic force that we assume white in time:
 $\mathbb{E}[\unicode[STIX]{x1D702}(x,y,t)\unicode[STIX]{x1D702}(x^{\prime },y^{\prime },t^{\prime })]=\unicode[STIX]{x1D6FF}(t-t^{\prime })C_{d}(x-x^{\prime },y-y^{\prime \prime })$
. We assume that
 $C_{d}$
is statistically homogeneous such that it depends only on the difference
 $x-x^{\prime }$
and
 $y-y^{\prime }$
. We choose a particular normalization for the correlation function
 $C_{d}$
, such that
 $\unicode[STIX]{x1D716}$
is the energy injection rate per unit mass:
 $\unicode[STIX]{x1D716}$
has dimensions
 $\text{m}^{2}~\text{s}^{-3}$
. In the following, we will always assume that there is no direct energy injection in the zonal velocity profile, i.e. that
 $(1/L_{x})\int \text{d}x\,\unicode[STIX]{x1D702}(r,t)=0$
.
Non-dimensional equations and non-dimensional numbers are the clearest way to determine the flow regime. We choose here to set temporal and spatial units such that the mean kinetic energy is 1, and
 $L_{x}=1$
(please see Bouchet et al. (Reference Bouchet, Nardini and Tangarife2013) for more details, or Bouchet, Nardini & Tangarife (Reference Bouchet, Nardini, Tangarife and Galperin2016, pp. 2–3) for comparison with other common non-dimensionalizations of the stochastic barotropic equations). For simplicity, we use the same notation for the dimensional and non-dimensional velocity and vorticity. The non-dimensional equations are
 $$\begin{eqnarray}\displaystyle \left.\begin{array}{@{}c@{}}\unicode[STIX]{x2202}_{t}\unicode[STIX]{x1D6FA}+\boldsymbol{V}\boldsymbol{\cdot }\unicode[STIX]{x1D735}\unicode[STIX]{x1D6FA}=-\unicode[STIX]{x1D6FC}\unicode[STIX]{x1D6FA}-\unicode[STIX]{x1D6FD}V_{y}+\sqrt{2\unicode[STIX]{x1D6FC}}\unicode[STIX]{x1D702},\\ \unicode[STIX]{x1D735}\boldsymbol{\cdot }\boldsymbol{V}=0.\end{array}\right\} & & \displaystyle\end{eqnarray}$$
Now
 $\unicode[STIX]{x1D6FC}=L\sqrt{r^{3}/\unicode[STIX]{x1D716}}$
is a non-dimensional parameter, although we will often refer to it as the ‘friction’; and
 $\unicode[STIX]{x1D6FD}=\sqrt{r/\unicode[STIX]{x1D716}}L^{2}\unicode[STIX]{x1D6FD}_{d}$
is the new non-dimensional Coriolis parameter, while
 $\unicode[STIX]{x1D6FD}_{d}$
is the dimensional one. We note that
 $\unicode[STIX]{x1D6FD}=L^{2}/L_{R}^{2}$
, where
 $L_{R}=(\unicode[STIX]{x1D716}/r\unicode[STIX]{x1D6FD}_{d}^{2})^{1/4}$
is the Rhines scale. The zonostrophy index used in many references would be
 $R_{\unicode[STIX]{x1D6FD}}=\unicode[STIX]{x1D6FD}^{1/10}\unicode[STIX]{x1D716}^{1/20}r^{-1/4}$
. We find that
 $\unicode[STIX]{x1D6FC}\propto (R_{\unicode[STIX]{x1D6FD}})^{-5}$
, which implies that the inertial limit of vanishing
 $\unicode[STIX]{x1D6FC}$
corresponds to the limit of large
 $R_{\unicode[STIX]{x1D6FD}}$
. Let
 $C(r)$
be the non-dimensional expression of the noise correlation function
 $C_{d}(r)$
. We denote by
 ${\hat{C}}_{k,l}$
the Fourier coefficients of
 $C$
,
 $$\begin{eqnarray}C(x,y):=\mathop{\sum }_{k,l}{\hat{C}}_{k,l}\text{e}^{\text{i}kx+\text{i}ly},\end{eqnarray}$$
and
 $K^{2}=k^{2}+l^{2}$
. As a correlation function,
 $C$
is a positive definite function and as a consequence
 ${\hat{C}}_{k,l}$
is real and positive. Moreover, if we assume the symmetry
 $x\rightarrow -x$
and
 $y\rightarrow -y$
, the function
 ${\hat{C}}_{k,l}$
is symmetric with respect to
 $k\rightarrow -k$
and
 $l\rightarrow -l$
. The constraint that the mean kinetic energy is unity can be written as
 $$\begin{eqnarray}\frac{1}{2}\iint \text{d}k\,\text{d}l\,\frac{{\hat{C}}_{k,l}}{K^{2}}=1.\end{eqnarray}$$
From now on, the computations will be done with non-dimensional quantities. If we want to write a result in its dimensional formulation, we will reintroduce
 $[\unicode[STIX]{x1D716}/r]=\text{m}^{2}~\text{s}^{-2}$
and
 $[L_{x}]=\text{m}$
.
We separate the flow
 $\boldsymbol{V}$
into two parts:
 $\boldsymbol{V}(r,t)=U(y,t)\,\boldsymbol{e}_{x}+\left(\!\begin{smallmatrix}u(r,t)\\ v(r,t)\end{smallmatrix}\!\right)$
. The mean velocity
 $U\boldsymbol{e}_{x}=\langle \boldsymbol{V}\rangle$
is defined as the zonal and stochastic average of the velocity field. More precisely, we assume that the mean flow is parallel and we take
 $\langle \boldsymbol{V}\rangle =(1/L_{x})\int \text{d}x\,\mathbb{E}[\boldsymbol{V}(x,y)]$
. In the following, the angle bracket
 $\langle ~\rangle$
will be used for both the zonal and stochastic averages. The vorticity then separates into
 $\unicode[STIX]{x1D6FA}(r,t)=-U^{\prime }(y,t)+\unicode[STIX]{x1D714}(r,t)$
, where the prime denotes the derivative with respect to
 $y$
. We will refer to
 $U$
indifferently as the mean flow or zonal flow.
Using this decomposition and the continuity equation, we can obtain an equation for the zonal component of the vorticity, and then integrate over
 $y$
to get the equation for the mean velocity
 $U$
,
 $$\begin{eqnarray}\unicode[STIX]{x2202}_{t}U+\unicode[STIX]{x2202}_{y}\langle uv\rangle =-rU.\end{eqnarray}$$
Equation (2.5) shows that the mean flow is forced by the divergence of the Reynolds stress
 $\unicode[STIX]{x2202}_{y}\langle uv\rangle$
. In order to reach an equilibrium, this latter term has to balance the dissipation coming from linear friction.
2.2 Quasi-linear approximation and pseudo-momentum balance
In this section we define the quasi-linear approximation. We recall basic concepts about linear dynamics and the relation between stochastic and deterministic linear dynamics.
In the following we are interested in the small-
 $\unicode[STIX]{x1D6FC}$
regime (the inertial or weak forces and dissipation regime). In the limit where
 $\unicode[STIX]{x1D6FC}$
goes to zero in (2.2), we can neglect the nonlinear eddy–eddy interactions. This approximation is called the quasi-linear approximation. The quasi-linear approximation has been shown to be self-consistent by Bouchet et al. (Reference Bouchet, Nardini and Tangarife2013) with some assumptions on the profile of
 $U$
(stability, no zero modes). We will not develop the full justification of the quasi-linear approximation here; the interested reader is referred to Bouchet et al. (Reference Bouchet, Nardini and Tangarife2013). Let us simply recall the heuristic ideas leading to the quasi-linear approximation. First, we note that the strength of the noise is of the order of
 $\sqrt{\unicode[STIX]{x1D6FC}}$
. As fluctuations are sheared and transferred to the largest scales on a time scale of order one, it is a natural hypothesis to expect fluctuations
 $(u,v)$
to be of the same order. This was proven to be self-consistent in Bouchet et al. (Reference Bouchet, Nardini and Tangarife2013). We make the rescaling
 $(u,v):=\sqrt{2\unicode[STIX]{x1D6FC}}(u^{\prime },v^{\prime })$
in (2.2), and we omit the prime in the following for clarity. The eddy–eddy interaction terms are of the order of
 $\unicode[STIX]{x1D6FC}^{3/2}$
, and can then be neglected. We are left with the set of equations
 $$\begin{eqnarray}\displaystyle & \unicode[STIX]{x2202}_{t}U=-\unicode[STIX]{x1D6FC}[\unicode[STIX]{x2202}_{y}\langle uv\rangle +U], & \displaystyle\end{eqnarray}$$
 $$\begin{eqnarray}\displaystyle & \unicode[STIX]{x2202}_{t}\unicode[STIX]{x1D714}+U\unicode[STIX]{x2202}_{x}\unicode[STIX]{x1D714}+(\unicode[STIX]{x1D6FD}-U^{\prime \prime })v=-\unicode[STIX]{x1D6FC}\unicode[STIX]{x1D714}+\unicode[STIX]{x1D702}, & \displaystyle\end{eqnarray}$$
where
 $\unicode[STIX]{x1D714}=\unicode[STIX]{x2202}_{x}v-\unicode[STIX]{x2202}_{y}u=\unicode[STIX]{x0394}\unicode[STIX]{x1D713}$
is the rescaled vorticity fluctuation. Equation (2.6) shows that the typical time scale for the evolution of the mean flow
 $U$
is
 $1/\unicode[STIX]{x1D6FC}$
. By contrast, (2.7) shows that the time scale for eddy dynamics is of order one. Using this time-scale separation, we will consider that
 $U$
is a constant field in the second equation (2.7), and we will solve
 $\unicode[STIX]{x1D714}(t)$
for a given profile
 $U$
. Once
 $U$
is considered as given, the eddy equation is linear. This time-scale separation is observed for example on Jupiter, where the typical time of eddy evolution ranges from a few days to a few weeks, whereas significant changes in the mean flow are only detected over decades (see e.g. Porco et al.
Reference Porco, West, McEwen, Del Genio, Ingersoll, Thomas, Squyres, Dones, Murray and Johnson2003).
Without forces and dissipation, the quasi-linear equations conserve energy and enstrophy, as do the full barotropic flow equations. One of the key relations we will use in this paper comes from the fluctuation enstrophy balance,
 $$\begin{eqnarray}{\textstyle \frac{1}{2}}\unicode[STIX]{x2202}_{t}\langle \unicode[STIX]{x1D714}^{2}\rangle -(\unicode[STIX]{x1D6FD}-U^{\prime \prime })\unicode[STIX]{x2202}_{y}\langle uv\rangle =-\unicode[STIX]{x1D6FC}\langle \unicode[STIX]{x1D714}^{2}\rangle +{\textstyle \frac{1}{2}}C(0),\end{eqnarray}$$
where we have used
 $$\begin{eqnarray}\langle v\unicode[STIX]{x1D714}\rangle =-\unicode[STIX]{x2202}_{y}\langle uv\rangle ,\end{eqnarray}$$
which is a consequence of incompressibility.
As a consequence, if
 $U^{\prime \prime }-\unicode[STIX]{x1D6FD}$
has a constant sign in the flow, without forces and dissipation, the left-hand side of the equation (2.7) conserves the pseudo-momentum
 $\int \langle \unicode[STIX]{x1D714}^{2}\rangle /(U^{\prime \prime }-\unicode[STIX]{x1D6FD})\,\text{d}y$
. The pseudo-momentum does not allow any instability to occur and the flow is stable. This is called the Rayleigh–Kuo criterion for stability of shear flows. If
 $U^{\prime \prime }-\unicode[STIX]{x1D6FD}$
vanishes somewhere in the flow, an instability may or may not exist. The fact that
 $U^{\prime \prime }-\unicode[STIX]{x1D6FD}$
vanishes is a necessary condition for instability, not a sufficient one.
As we assume a time-scale separation between the zonal flow and fluctuation dynamics, we are interested in the long-term behaviour of the Reynolds stress
 $\unicode[STIX]{x2202}_{y}\langle uv\rangle$
. When the vorticity fluctuation
 $\unicode[STIX]{x1D714}$
reaches its stationary distribution, we have the relation
 $$\begin{eqnarray}\unicode[STIX]{x2202}_{y}\langle uv\rangle =-\frac{1}{U^{\prime \prime }-\unicode[STIX]{x1D6FD}}\left[\unicode[STIX]{x1D6FC}\langle \unicode[STIX]{x1D714}^{2}\rangle -\frac{1}{2}C(0)\right].\end{eqnarray}$$
This equation for the Reynolds stress will be extremely useful.
We now take the Fourier transform of (2.7) in
 $x$
:
 $\unicode[STIX]{x1D714}_{k}(y):=(1/L_{x})\int \text{d}x\,\unicode[STIX]{x1D714}(x,y)\text{e}^{-\text{i}kx}$
, with
 $k$
taking the values
 $(2\unicode[STIX]{x03C0}/L_{x})n$
, with
 $n$
an integer. We also use the linearity to express the solution as the sum of particular solutions for independent stochastic forcings
 $\unicode[STIX]{x1D702}_{l}(y,t)$
. We denote by
 $\unicode[STIX]{x1D714}_{k,l}(y,t)$
the solution of
 $$\begin{eqnarray}\unicode[STIX]{x2202}_{t}\unicode[STIX]{x1D714}_{k,l}+L_{k}[\unicode[STIX]{x1D714}_{k,l}]=-\unicode[STIX]{x1D6FC}\unicode[STIX]{x1D714}_{k,l}+\unicode[STIX]{x1D702}_{l},\end{eqnarray}$$
where
 $$\begin{eqnarray}L_{k}[\unicode[STIX]{x1D714}_{k,l}]=\text{i}kU\unicode[STIX]{x1D714}_{k,l}+\text{i}k(\unicode[STIX]{x1D6FD}-U^{\prime \prime })\unicode[STIX]{x1D713}_{k,l},\end{eqnarray}$$
and where
 $\unicode[STIX]{x1D702}_{l}$
is a Gaussian white noise with correlations
 $\mathbb{E}[\unicode[STIX]{x1D702}_{l}(y,t)\unicode[STIX]{x1D702}_{l}(y^{\prime },t)]=\text{e}^{\text{i}l(y-y^{\prime })}\unicode[STIX]{x1D6FF}(t-t^{\prime })$
. From (2.10) we obtain
 $$\begin{eqnarray}\unicode[STIX]{x2202}_{y}\langle uv\rangle =-\frac{1}{U^{\prime \prime }-\unicode[STIX]{x1D6FD}}\mathop{\sum }_{k,l}\frac{{\hat{C}}_{k,l}}{2}[2\unicode[STIX]{x1D6FC}\langle |\unicode[STIX]{x1D714}_{k,l}|^{2}\rangle -1],\end{eqnarray}$$
where the positive constants
 ${\hat{C}}_{k,l}$
are defined by (2.3). We stress that in this formula the bracket
 $\langle |\unicode[STIX]{x1D714}_{k,l}|^{2}\rangle$
denotes a stochastic average, because the zonal average is already taken into account by the sum over all vectors
 $\boldsymbol{k}$
.
We now proceed to a further simplification, showing that the stochastic eddy dynamics can be computed from a set of deterministic linear problems, following Bouchet et al. (Reference Bouchet, Nardini and Tangarife2013). We use that (2.12) is a linear operator for a given
 $U$
and that the noise
 $\unicode[STIX]{x1D702}_{k,l}$
is white in time and has an exponential correlation function
 $c_{l}(y)=\text{e}^{\text{i}ly}$
to express the stationary average
 $\langle |\unicode[STIX]{x1D714}_{k,l}|^{2}\rangle$
as
 $$\begin{eqnarray}\langle |\unicode[STIX]{x1D714}_{k,l}|^{2}\rangle =\int _{-\infty }^{0}\text{d}t\,\text{e}^{2\unicode[STIX]{x1D6FC}t}|\text{e}^{tL_{k}}[c_{l}]|^{2},\end{eqnarray}$$
where
 $\text{e}^{tL_{k}}[c_{l}]$
is the solution at time
 $t$
of the deterministic equation
 $$\begin{eqnarray}\unicode[STIX]{x2202}_{t}\unicode[STIX]{x1D714}_{d}+L_{k}[\unicode[STIX]{x1D714}_{d}]=0,\end{eqnarray}$$
with initial condition
 $c_{l}:=y\rightarrow \text{e}^{\text{i}ly}$
.
Equations (2.13), (2.14) and (2.6) give a way to compute Reynolds stresses and the velocity profile
 $U$
from classical and much-studied deterministic hydrodynamic problems. Equation (2.16) is however tricky and has no simple explicit expression in the general case. We will be able to get an explicit result only in asymptotic regimes.
2.3 Simplifications in asymptotic regimes
Expression (2.14) is still complicated because, to get explicit results, it requires to know the behaviour of the solution
 $\text{e}^{tL_{k}}[c_{l}]$
up to times of order
 $1/\unicode[STIX]{x1D6FC}$
. Two parameters can be used to further simplify the problem: the vector
 $\boldsymbol{k}=(k,l)$
and the damping
 $\unicode[STIX]{x1D6FC}$
. We denote
 $K:=|\boldsymbol{k}|$
. We will be interested in both the regime
 $K\rightarrow \infty$
and
 $\unicode[STIX]{x1D6FC}\rightarrow 0$
. The large-
 $K$
regime is a small-scale forcing regime.
The inertial limit
 $\unicode[STIX]{x1D6FC}\rightarrow 0$
is the most difficult one, because turbulence can develop over a very long time. But the inertial limit is also the most interesting from a physical point of view because it corresponds to fully turbulent regimes, and is the most relevant one to describe Jupiter’s atmosphere. In this section we prove that (2.13) and (2.14) can be further simplified and computed through the asymptotic behaviour of a linear dynamics without dissipation, in the inertial regime.
The result in the inertial regime crucially depends on whether the deterministic equation without dissipation,
 $$\begin{eqnarray}\unicode[STIX]{x2202}_{t}\unicode[STIX]{x1D714}_{d}+\text{i}kU\unicode[STIX]{x1D714}_{d}+\text{i}k(\unicode[STIX]{x1D6FD}-U^{\prime \prime })\unicode[STIX]{x1D713}_{d}=0,\end{eqnarray}$$
with initial condition
 $\unicode[STIX]{x1D714}_{d}(y,0)=c_{l}$
, sustains neutral modes or not. A neutral mode is defined as a solution of this equation of the form
 $\unicode[STIX]{x1D714}_{d}(y,t)=\unicode[STIX]{x1D709}^{a}(y)\text{e}^{\text{i}c_{a}t}$
, where
 $c_{a}$
is a real constant. It is also sometimes called ‘modified Rossby waves’ in this context, when the jet velocity is non-zero. Two cases can be encountered. In the first case, without neutral modes, Bouchet & Morita (Reference Bouchet and Morita2010) have shown that
 $\unicode[STIX]{x1D714}_{d}$
behaves asymptotically for long times as
 $\unicode[STIX]{x1D714}_{d}(y,t){\sim}_{t\rightarrow \infty }\unicode[STIX]{x1D714}^{\infty }(y)\text{e}^{\text{i}kUt}$
, even for non-monotonic velocity profiles
 $U$
. Please note that we should write
 $\unicode[STIX]{x1D714}_{kl}^{\infty }(y)$
because the asymptotic limit of
 $\unicode[STIX]{x1D714}_{d}$
depends on the wavevector, but we choose to omit the indices
 $k,l$
for clarity. Moreover, Bouchet & Morita (Reference Bouchet and Morita2010) give a method to compute this
 $\unicode[STIX]{x1D714}^{\infty }$
using Laplace transform tools. In this case, in the limit
 $\unicode[STIX]{x1D6FC}\rightarrow 0$
, the Reynolds stress can be written as
 $$\begin{eqnarray}\unicode[STIX]{x2202}_{y}\langle uv\rangle =-\frac{1}{U^{\prime \prime }-\unicode[STIX]{x1D6FD}}\mathop{\sum }_{k,l}\frac{{\hat{C}}_{k,l}}{2}[|\unicode[STIX]{x1D714}^{\infty }|^{2}-1].\end{eqnarray}$$
We give the full justification of this result in appendix A.
In the second case, with neutral modes, we have to modify expression (2.17) to take into account the presence of modes. Again, we leave the technical details to appendix A and we give the final result:
 $$\begin{eqnarray}\unicode[STIX]{x2202}_{y}\langle uv\rangle =-\frac{1}{U^{\prime \prime }-\unicode[STIX]{x1D6FD}}\mathop{\sum }_{k,l}\frac{{\hat{C}}_{k,l}}{2}\left[|\tilde{\unicode[STIX]{x1D714}}^{\infty }|^{2}-1+\mathop{\sum }_{modes\,a}|\unicode[STIX]{x1D714}^{a}|^{2}\right].\end{eqnarray}$$
This result means that we have to project first the initial condition
 $c_{l}$
over the modes labelled by
 $a$
. The component over the
 $a$
mode gives the term
 $\unicode[STIX]{x1D714}^{a}(y)$
. These new terms are related to the wave pseudo-momentum balance. Then we compute the asymptotic solution
 $\tilde{\unicode[STIX]{x1D714}}^{\infty }$
of (2.16) using as initial condition not
 $c_{l}$
but
 $c_{l}-\sum \unicode[STIX]{x1D714}^{a}$
. Briefly speaking, the first reason why there are no cross-terms of the form
 $\unicode[STIX]{x1D714}^{a}\tilde{\unicode[STIX]{x1D714}}$
between modes and the remaining part of the spectrum is because the frequencies
 $c_{a}$
of the modes are always outside of the range of
 $U$
, as shown by Drazin, Beaumont & Coaker (Reference Drazin, Beaumont and Coaker1982) and Pedlosky (Reference Pedlosky1964). The cross-terms have an oscillatory part of frequency
 $(1/\unicode[STIX]{x1D6FC})(c_{a}-U)$
that gives a vanishing contribution in the small-
 $\unicode[STIX]{x1D6FC}$
limit.
Both formulae (2.17) and (2.18) are independent of
 $\unicode[STIX]{x1D6FC}$
in the limit of vanishing
 $\unicode[STIX]{x1D6FC}$
. This is a non-trivial result. The formulae will be used to study the inertial limit in § 3.
3 Explicit velocity profile in the inertial and small-scale forcing regime
Observations collected by the Galileo and Cassini probes (see Porco et al. (Reference Porco, West, McEwen, Del Genio, Ingersoll, Thomas, Squyres, Dones, Murray and Johnson2003) and others) allow one to estimate typical values for
 $K$
and
 $\unicode[STIX]{x1D6FC}$
. The forcing length scale
 $1/K$
can be estimated to be of the order of 1000 km, the typical size of cyclones due to convective activity in Jupiter’s troposphere. The dissipation on Jupiter involves different mechanisms, which are roughly modelled by our linear friction. What could be a relevant typical time scale for dissipation is not obvious. Based on Jupiter observations, many authors (Porco et al.
Reference Porco, West, McEwen, Del Genio, Ingersoll, Thomas, Squyres, Dones, Murray and Johnson2003; Vasavada & Showman Reference Vasavada and Showman2005; Salyk et al.
Reference Salyk, Ingersoll, Lorre, Vasavada and Del Genio2006) consider a large-scale dissipation time
 $1/r$
of the order of a few years. To compute an order of magnitude for the non-dimensional parameter
 $\unicode[STIX]{x1D6FC}$
, we have chosen
 $1/r=5$
years. The mean flow value is easily estimated from the observations, and the Coriolis parameter
 $\unicode[STIX]{x1D6FD}$
is easily computed from the rotation rate of Jupiter. After non-dimensionalization, following the discussion in the previous section, we estimate the orders of magnitude to be
 $K\sim 10$
and
 $\unicode[STIX]{x1D6FC}\sim 10^{-3}$
. Jupiter is thus in the asymptotic regime
 $\unicode[STIX]{x1D6FC}\rightarrow 0$
and
 $K\rightarrow +\infty$
. The two limits do not necessarily commute, so we have to be careful which limit we are going to take first. The turbulent nature of the dynamics at the forcing scale suggests the limit
 $\unicode[STIX]{x1D6FC}\rightarrow 0$
first, and then
 $K\rightarrow +\infty$
.
3.1 Computation of the long-time limit of eddy vorticity
In the following and until § 5, we assume that there are no Rossby waves in the flow. It was shown long ago that those waves travel in a barotropic flow at a velocity
 $c<U_{min}$
(Pedlosky Reference Pedlosky1964; Drazin et al.
Reference Drazin, Beaumont and Coaker1982). In § 5, we will explain how we can compute Rossby waves in the case of a parabolic profile.
In this subsection, we summarize the main result obtained by Bouchet & Morita (Reference Bouchet and Morita2010) that allows us to compute the function
 $\unicode[STIX]{x1D714}^{\infty }$
appearing in (2.17). Then
 $\unicode[STIX]{x1D714}^{\infty }$
gives an easy access to the small-
 $\unicode[STIX]{x1D6FC}$
limit, independently of the large-
 $K$
limit.
We start from (2.16) that describes the linear evolution of a perturbation
 $\unicode[STIX]{x1D714}(y,t)\text{e}^{\text{i}kx}$
of meridional wavenumber
 $k$
and with streamfunction
 $\unicode[STIX]{x1D713}(y,t)\text{e}^{\text{i}kx}$
. In the following, we will stop using the subscript
 $d$
for the deterministic solution
 $\unicode[STIX]{x1D714}_{d}$
in (2.16). We introduce the function
 $\unicode[STIX]{x1D711}_{\unicode[STIX]{x1D716}}(y,c)$
, which is the Laplace transform of the streamfunction
 $\unicode[STIX]{x1D713}(y,t)$
, i.e.
 $\unicode[STIX]{x1D711}_{\unicode[STIX]{x1D716}}(c):=\int _{0}^{\infty }\text{d}t\,\unicode[STIX]{x1D713}(y,t)\text{e}^{\text{i}k(c+\text{i}\unicode[STIX]{x1D716})t}$
. To avoid any confusion, we stress that, in this section,
 $\unicode[STIX]{x1D716}$
will always denote a small parameter and not the energy injection rate. The Laplace transform
 $\unicode[STIX]{x1D711}_{\unicode[STIX]{x1D716}}$
is well defined for any non-zero value of the real variable
 $\unicode[STIX]{x1D716}$
with a strictly positive product
 $k\unicode[STIX]{x1D716}$
. Here
 $c$
has to be understood as the phase speed of the wave, and
 $k\unicode[STIX]{x1D716}$
is the exponential growth rate of the wave. Note that
 $k\unicode[STIX]{x1D716}$
exactly corresponds to a linear friction in (2.16), such that the inertial limit
 $\unicode[STIX]{x1D6FC}\rightarrow 0$
is equivalent to the limit
 $\unicode[STIX]{x1D716}\rightarrow 0$
. The equation for
 $\unicode[STIX]{x1D711}_{\unicode[STIX]{x1D716}}$
is (see Bouchet & Morita Reference Bouchet and Morita2010)
 $$\begin{eqnarray}\left(\frac{\text{d}^{2}}{\text{d}y^{2}}-k^{2}\right)\unicode[STIX]{x1D711}_{\unicode[STIX]{x1D716}}(y,c)+\frac{\unicode[STIX]{x1D6FD}-U^{\prime \prime }(y)}{U(y)-c-\text{i}\unicode[STIX]{x1D716}}\unicode[STIX]{x1D711}_{\unicode[STIX]{x1D716}}(y,c)=\frac{\unicode[STIX]{x1D714}(y,0)}{\text{i}k(U(y)-c-\text{i}\unicode[STIX]{x1D716})},\end{eqnarray}$$
with vanishing boundary conditions at infinity. We do not have an infinite flow in the
 $y$
direction, but the properties of the flow become local for large
 $K$
. The choice to take vanishing boundary conditions at infinity is done for convenience and it is expected that this particular choice does not modify the physical behaviour of the perturbation.
For all
 $\unicode[STIX]{x1D716}>0$
the function
 $\unicode[STIX]{x1D711}_{\unicode[STIX]{x1D716}}$
is well defined. The inhomogeneous Rayleigh equation (3.1) is singular for
 $\unicode[STIX]{x1D716}=0$
at any critical point (or critical layer)
 $y_{c}$
such that the zonal velocity is equal to the phase speed:
 $U(y_{c})=c$
. One can show that
 $\unicode[STIX]{x1D711}_{\unicode[STIX]{x1D716}}$
has a limit denoted
 $\unicode[STIX]{x1D711}_{+}$
when
 $\unicode[STIX]{x1D716}$
goes to zero. The function
 $\unicode[STIX]{x1D714}^{\infty }$
is then given by (see Bouchet & Morita Reference Bouchet and Morita2010)
 $$\begin{eqnarray}\unicode[STIX]{x1D714}^{\infty }(y)=\text{i}k(U^{\prime \prime }(y)-\unicode[STIX]{x1D6FD})\unicode[STIX]{x1D711}_{+}(y,U(y))+\unicode[STIX]{x1D714}(y,0).\end{eqnarray}$$
The function
 $\unicode[STIX]{x1D714}^{\infty }$
depends on the Laplace transform of the streamfunction but for a phase velocity
 $c$
equal to the zonal velocity at latitude
 $y$
. From a mathematical point of view, it corresponds to the value of
 $\unicode[STIX]{x1D711}_{+}$
exactly at its singularity. The singularity in (3.1) is of degree one (proportional to
 $1/y$
) except at the extrema of the jets, where it is of degree two. A singularity of order two would create a divergence for the solution, but it happens that the numerator in (3.1) vanishes at such points and the solution is still defined at the extrema of a jet. A non-trivial consequence of that is
 $$\begin{eqnarray}\unicode[STIX]{x1D714}^{\infty }(y_{cr})=0\end{eqnarray}$$
at all critical latitudes
 $y_{cr}$
where
 $U^{\prime }(y_{cr})=0$
. This result, called depletion of vorticity fluctuation at the jet critical points in Bouchet & Morita (Reference Bouchet and Morita2010), has important physical consequences that influence the dynamics of a jet.
As described in Bouchet & Morita (Reference Bouchet and Morita2010), using formula (3.1) and (3.2), one can numerically compute the function
 $\unicode[STIX]{x1D714}^{\infty }$
: we first have to solve a set of boundary value problems for ordinary differential equations parametrized by
 $c$
and
 $\unicode[STIX]{x1D716}$
to obtain a solution family
 $\unicode[STIX]{x1D711}_{\unicode[STIX]{x1D716}}(c)$
. Then we evaluate, for small enough
 $\unicode[STIX]{x1D716}$
, each solution
 $\unicode[STIX]{x1D711}_{\unicode[STIX]{x1D716}}(c)$
at the value
 $y_{c}$
satisfying
 $U(y_{c})=c$
. This method is much faster and has less numerical cost than computing the long-time evolution of the partial differential equation (2.16). We use this method in the remainder of this section.
3.2 Limit of small-scale forcing for monotonic profiles, and explicit expression of the Reynolds stress
Again, we assume that there are no Rossby waves. We will now consider the limit of small-scale forcing
 $K\rightarrow \infty$
. The calculations are rather technical and can be skipped in the first reading. The result of this section is (3.10)
We start from (3.1) that describes the inertial behaviour of a deterministic evolution of a perturbation
 $\unicode[STIX]{x1D714}(y,0)$
when
 $\unicode[STIX]{x1D716}$
vanishes. Using the Green function
 $H_{k}(y)$
of
 $(\unicode[STIX]{x2202}_{y}^{2}-k^{2})$
we write
 $$\begin{eqnarray}\displaystyle \unicode[STIX]{x1D711}_{\unicode[STIX]{x1D716}}(y,c) & = & \displaystyle (U^{\prime \prime }(y)-\unicode[STIX]{x1D6FD})\int \text{d}y^{\prime }\,H_{k}(y^{\prime })\frac{\unicode[STIX]{x1D711}_{\unicode[STIX]{x1D716}}(y-y^{\prime },c)}{U(y-y^{\prime })-c-\text{i}\unicode[STIX]{x1D716}}\nonumber\\ \displaystyle & & \displaystyle +\int \text{d}y^{\prime }\,H_{k}(y^{\prime })\frac{\unicode[STIX]{x1D714}(y-y^{\prime },0)}{\text{i}k(U(y-y^{\prime })-c-\text{i}\unicode[STIX]{x1D716})}.\end{eqnarray}$$
Now we make the change of variable
 $Y=ky^{\prime }$
. The Green function has the scaling
 $H_{k}(y^{\prime }):=-[1/(2k)]H_{0}(Y)$
. Recalling that
 $\unicode[STIX]{x1D711}_{+}(y,c)=\lim _{\unicode[STIX]{x1D716}\downarrow 0}\unicode[STIX]{x1D711}_{\unicode[STIX]{x1D716}}(y,c)$
, it follows that
 $$\begin{eqnarray}\displaystyle \unicode[STIX]{x1D711}_{+}(y,c) & = & \displaystyle -\frac{(U^{\prime \prime }(y)-\unicode[STIX]{x1D6FD})}{2k^{2}}\lim _{\unicode[STIX]{x1D716}\rightarrow 0}\int \text{d}Y\,H_{0}(Y)\frac{\unicode[STIX]{x1D711}_{\unicode[STIX]{x1D716}}\left(y-{\displaystyle \frac{Y}{k}},c\right)}{U\left(y-{\displaystyle \frac{Y}{k}}\right)-c-\text{i}\unicode[STIX]{x1D716}}\nonumber\\ \displaystyle & & \displaystyle -\,\frac{1}{2\text{i}k^{3}}\lim _{\unicode[STIX]{x1D716}\rightarrow 0}\int \text{d}Y\,H_{0}(Y)\frac{\unicode[STIX]{x1D714}\left(y-{\displaystyle \frac{Y}{k}},0\right)}{U\left(y-{\displaystyle \frac{Y}{k}}\right)-c-\text{i}\unicode[STIX]{x1D716}}.\end{eqnarray}$$
Please note that we are making the assumption that
 $l/k:=\tan \unicode[STIX]{x1D703}$
is finite and thus
 $K\rightarrow \infty$
implies
 $k\rightarrow \infty$
. Let us recap here that it is crucial to take the limit
 $\unicode[STIX]{x1D716}\rightarrow 0$
first before
 $K\rightarrow \infty$
because
 $\unicode[STIX]{x1D716}$
plays exactly the role of the non-dimensional linear friction
 $\unicode[STIX]{x1D6FC}$
. If we want to study the inertial regime, we have to take first a vanishing friction limit.
Consider now the magnitude of both terms on the right-hand side of (3.5). We have a term depending on
 $\unicode[STIX]{x1D711}_{\unicode[STIX]{x1D716}}$
and another depending on the initial condition
 $\unicode[STIX]{x1D714}(y,0)$
. The initial condition is of order 1, and then the second term will be of order
 $1/k^{3}$
. As a consequence, the first term in the asymptotic expansion of
 $\unicode[STIX]{x1D711}_{+}$
will be of order
 $1/k^{3}$
. The first term on the right-hand side of (3.5) gives the next order of the asymptotic expansion and is thus negligible. We write
 $$\begin{eqnarray}\unicode[STIX]{x1D711}_{+}(y,c)\underset{K\rightarrow \infty }{{\sim}}-\frac{1}{2\text{i}k^{3}}\lim _{\unicode[STIX]{x1D716}\rightarrow 0}\int \text{d}Y\,H_{0}(Y)\frac{\unicode[STIX]{x1D714}\left(y-{\displaystyle \frac{Y}{k}},0\right)}{U\left(y-{\displaystyle \frac{Y}{k}}\right)-c-\text{i}\unicode[STIX]{x1D716}}.\end{eqnarray}$$
Combining (3.2) and (3.6) we find that
 $$\begin{eqnarray}|\unicode[STIX]{x1D714}^{\infty }(y)|^{2}\underset{K\rightarrow \infty }{{\sim}}|\unicode[STIX]{x1D714}(y,0)|^{2}-\frac{U^{\prime \prime }-\unicode[STIX]{x1D6FD}}{k^{2}}\,\text{Re}\left\{\lim _{\unicode[STIX]{x1D716}\rightarrow 0}\int \text{d}Y\,H_{0}(Y)\frac{\unicode[STIX]{x1D714}^{\ast }(y,0)\unicode[STIX]{x1D714}\left(y-{\displaystyle \frac{Y}{k}},0\right)}{U\left(y-{\displaystyle \frac{Y}{k}}\right)-U(y)-\text{i}\unicode[STIX]{x1D716}}\right\}.\end{eqnarray}$$
The final step is to use
 $\unicode[STIX]{x1D714}(y,0)=\text{e}^{\text{i}ly}$
and
 $H_{0}(Y)=\text{e}^{-|Y|}$
. We also use the Sokhotski–Plemelj formula:
 $\lim _{\unicode[STIX]{x1D716}\rightarrow 0}1/x-\text{i}\unicode[STIX]{x1D716}=\text{i}\unicode[STIX]{x03C0}\unicode[STIX]{x1D6FF}(x)+{\mathcal{P}}(1/x)$
, where
 ${\mathcal{P}}$
is the Cauchy principal value of an integral. We obtain
 $$\begin{eqnarray}\displaystyle |\unicode[STIX]{x1D714}^{\infty }(y)|^{2} & \underset{K\rightarrow \infty }{{\sim}} & \displaystyle |\unicode[STIX]{x1D714}(y,0)|^{2}-\frac{U^{\prime \prime }-\unicode[STIX]{x1D6FD}}{k^{2}}\,\text{Re}\left\{\lim _{\unicode[STIX]{x1D716}\rightarrow 0}\int \text{d}Y\,\text{e}^{-|Y|}\frac{\text{e}^{-\text{i}Y\tan \unicode[STIX]{x1D703}}}{U\left(y-{\displaystyle \frac{Y}{k}}\right)-U(y)-\text{i}\unicode[STIX]{x1D716}}\right\}\nonumber\\ \displaystyle & \underset{K\rightarrow \infty }{{\sim}} & \displaystyle |\unicode[STIX]{x1D714}(y,0)|^{2}-\frac{U^{\prime \prime }-\unicode[STIX]{x1D6FD}}{k^{2}}\,\text{Re}\left\{\text{i}\unicode[STIX]{x03C0}\!\int \text{d}Y\,\text{e}^{-|Y|}\text{e}^{-\text{i}Y\tan \unicode[STIX]{x1D703}}\unicode[STIX]{x1D6FF}\!\left(U\!\left(y-\frac{Y}{k}\right)\!-U(y)\right)\!\right\}\nonumber\\ \displaystyle & & \displaystyle -\,\frac{U^{\prime \prime }-\unicode[STIX]{x1D6FD}}{k^{2}}\,\text{Re}\left\{{\mathcal{P}}\left\{\int \text{d}Y\,\text{e}^{-|Y|}\frac{\text{e}^{-\text{i}Y\tan \unicode[STIX]{x1D703}}}{U\left(y-{\displaystyle \frac{Y}{k}}\right)-U(y)}\right\}\right\}\nonumber\\ \displaystyle & \underset{K\rightarrow \infty }{{\sim}} & \displaystyle |\unicode[STIX]{x1D714}(y,0)|^{2}-\frac{U^{\prime \prime }-\unicode[STIX]{x1D6FD}}{k^{2}}\,{\mathcal{P}}\left\{\int \text{d}Y\,\text{e}^{-|Y|}\frac{\cos (Y\tan \unicode[STIX]{x1D703})}{U\left(y-{\displaystyle \frac{Y}{k}}\right)-U(y)}\right\},\end{eqnarray}$$
where we have used that the term
 $\text{i}\unicode[STIX]{x03C0}\int \text{d}Y\,\text{e}^{-|Y|}\text{e}^{-\text{i}Y\tan \unicode[STIX]{x1D703}}\unicode[STIX]{x1D6FF}(U(y-Y/k)-U(y))$
is purely imaginary. Injecting this result in (2.17) gives the contribution of one Fourier mode
 $k,l$
with
 $k/l=\tan \unicode[STIX]{x1D703}$
to the Reynolds stress divergence,
 $$\begin{eqnarray}\text{Re}\langle v_{\unicode[STIX]{x1D703}}^{\ast }\unicode[STIX]{x1D714}_{\unicode[STIX]{x1D703}}\rangle \underset{K\rightarrow \infty }{{\sim}}-\frac{{\hat{C}}_{k,l}}{2k^{2}}\,{\mathcal{P}}\left\{\int \text{d}Y\,\text{e}^{-|Y|}\frac{\cos (Y\tan \unicode[STIX]{x1D703})}{U\left(y-{\displaystyle \frac{Y}{k}}\right)-U(y)}\right\}.\end{eqnarray}$$
Some lengthy but straightforward calculations are then required to show that this expression coincides with
 $U^{\prime \prime }/U^{\prime 2}$
(for an energy injection rate set to one). The computation is discussed in appendix B. But we have to make an additional assumption: the asymptotic expansion is valid only if
 $kU^{\prime }/U^{\prime \prime }\rightarrow \infty$
. There should exist a small region in the vicinity of the extremum
 $U^{\prime }=0$
where the calculation breaks down. The formula can be valid only for strictly monotonic profiles or for the monotonic part between two extrema of a jet.
We have derived the first main result of the present paper,
 $$\begin{eqnarray}\unicode[STIX]{x2202}_{y}\langle uv\rangle =-\frac{U^{\prime \prime }}{U^{\prime 2}},\end{eqnarray}$$
in the limits
 $\unicode[STIX]{x1D6FC}\rightarrow 0$
and
 $K\rightarrow +\infty$
taken in this order. With the dimensional physical fields, the result (3.10) can be written as
 $$\begin{eqnarray}\unicode[STIX]{x2202}_{y}\langle uv\rangle =-\unicode[STIX]{x1D716}\frac{U^{\prime \prime }}{U^{\prime 2}},\end{eqnarray}$$
where
 $\unicode[STIX]{x1D716}$
is the energy injection rate.
We have proven that, in the limit of vanishing friction and small-scale forcing, we are able to give an explicit expression for the Reynolds stress divergence that does not depend on the shape of the stochastic forcing. The result (3.11) has been obtained taking the limit
 $\unicode[STIX]{x1D6FC}\rightarrow 0$
first. It has been shown by Woillez & Bouchet (Reference Woillez and Bouchet2017) that the result (3.11) can also be recovered taking the limit
 $K\rightarrow +\infty$
before
 $\unicode[STIX]{x1D6FC}\rightarrow 0$
, which means that the two limits do commute in the present case. It is worth emphasizing that our results are asymptotic results. The behaviour may be really different for finite friction and finite
 $K$
. The work done in Srinivasan & Young (Reference Srinivasan and Young2014) shows that the shape of the stochastic forcing matters in the general case.
3.3 Prediction of the stationary velocity profile
With the asymptotic result (3.11), we are now able to derive a closed equation for the mean velocity profile
 $U$
. Relation (3.11) together with (2.5) gives
 $$\begin{eqnarray}\unicode[STIX]{x2202}_{t}U-\frac{\unicode[STIX]{x1D716}U^{\prime \prime }}{U^{\prime 2}}=-rU.\end{eqnarray}$$
From the latter result, we deduce that the stationary velocity profile
 $U_{0}$
satisfies the equation
 $$\begin{eqnarray}\frac{\unicode[STIX]{x1D716}U_{0}^{\prime \prime }}{U_{0}^{\prime 2}}=rU_{0}.\end{eqnarray}$$
Equation (3.13) surprisingly has a Newtonian structure: it has a first integral that can be interpreted as the sum of a kinetic energy and a potential energy. Multiplying both sides by
 $U_{0}^{\prime }$
and integrating over
 $y$
leads to
 $$\begin{eqnarray}\frac{1}{2}U_{0}^{2}-\frac{\unicode[STIX]{x1D716}}{r}\ln (|U_{0}^{\prime }|)=C,\end{eqnarray}$$
where
 $C$
is an integration constant.
In (3.14), the function
 $V(x):=-(\unicode[STIX]{x1D716}/r)\ln (|x|)$
plays the role of a potential. The dynamics defined by (3.14) is completely similar to a particle moving in a potential
 $V$
with equation
 $$\begin{eqnarray}{\textstyle \frac{1}{2}}{\dot{x}}^{2}+V(x)=C.\end{eqnarray}$$
The only difference is that the roles of
 $U$
and
 $U^{\prime }$
are exchanged compared to the role of
 $x$
and
 ${\dot{x}}$
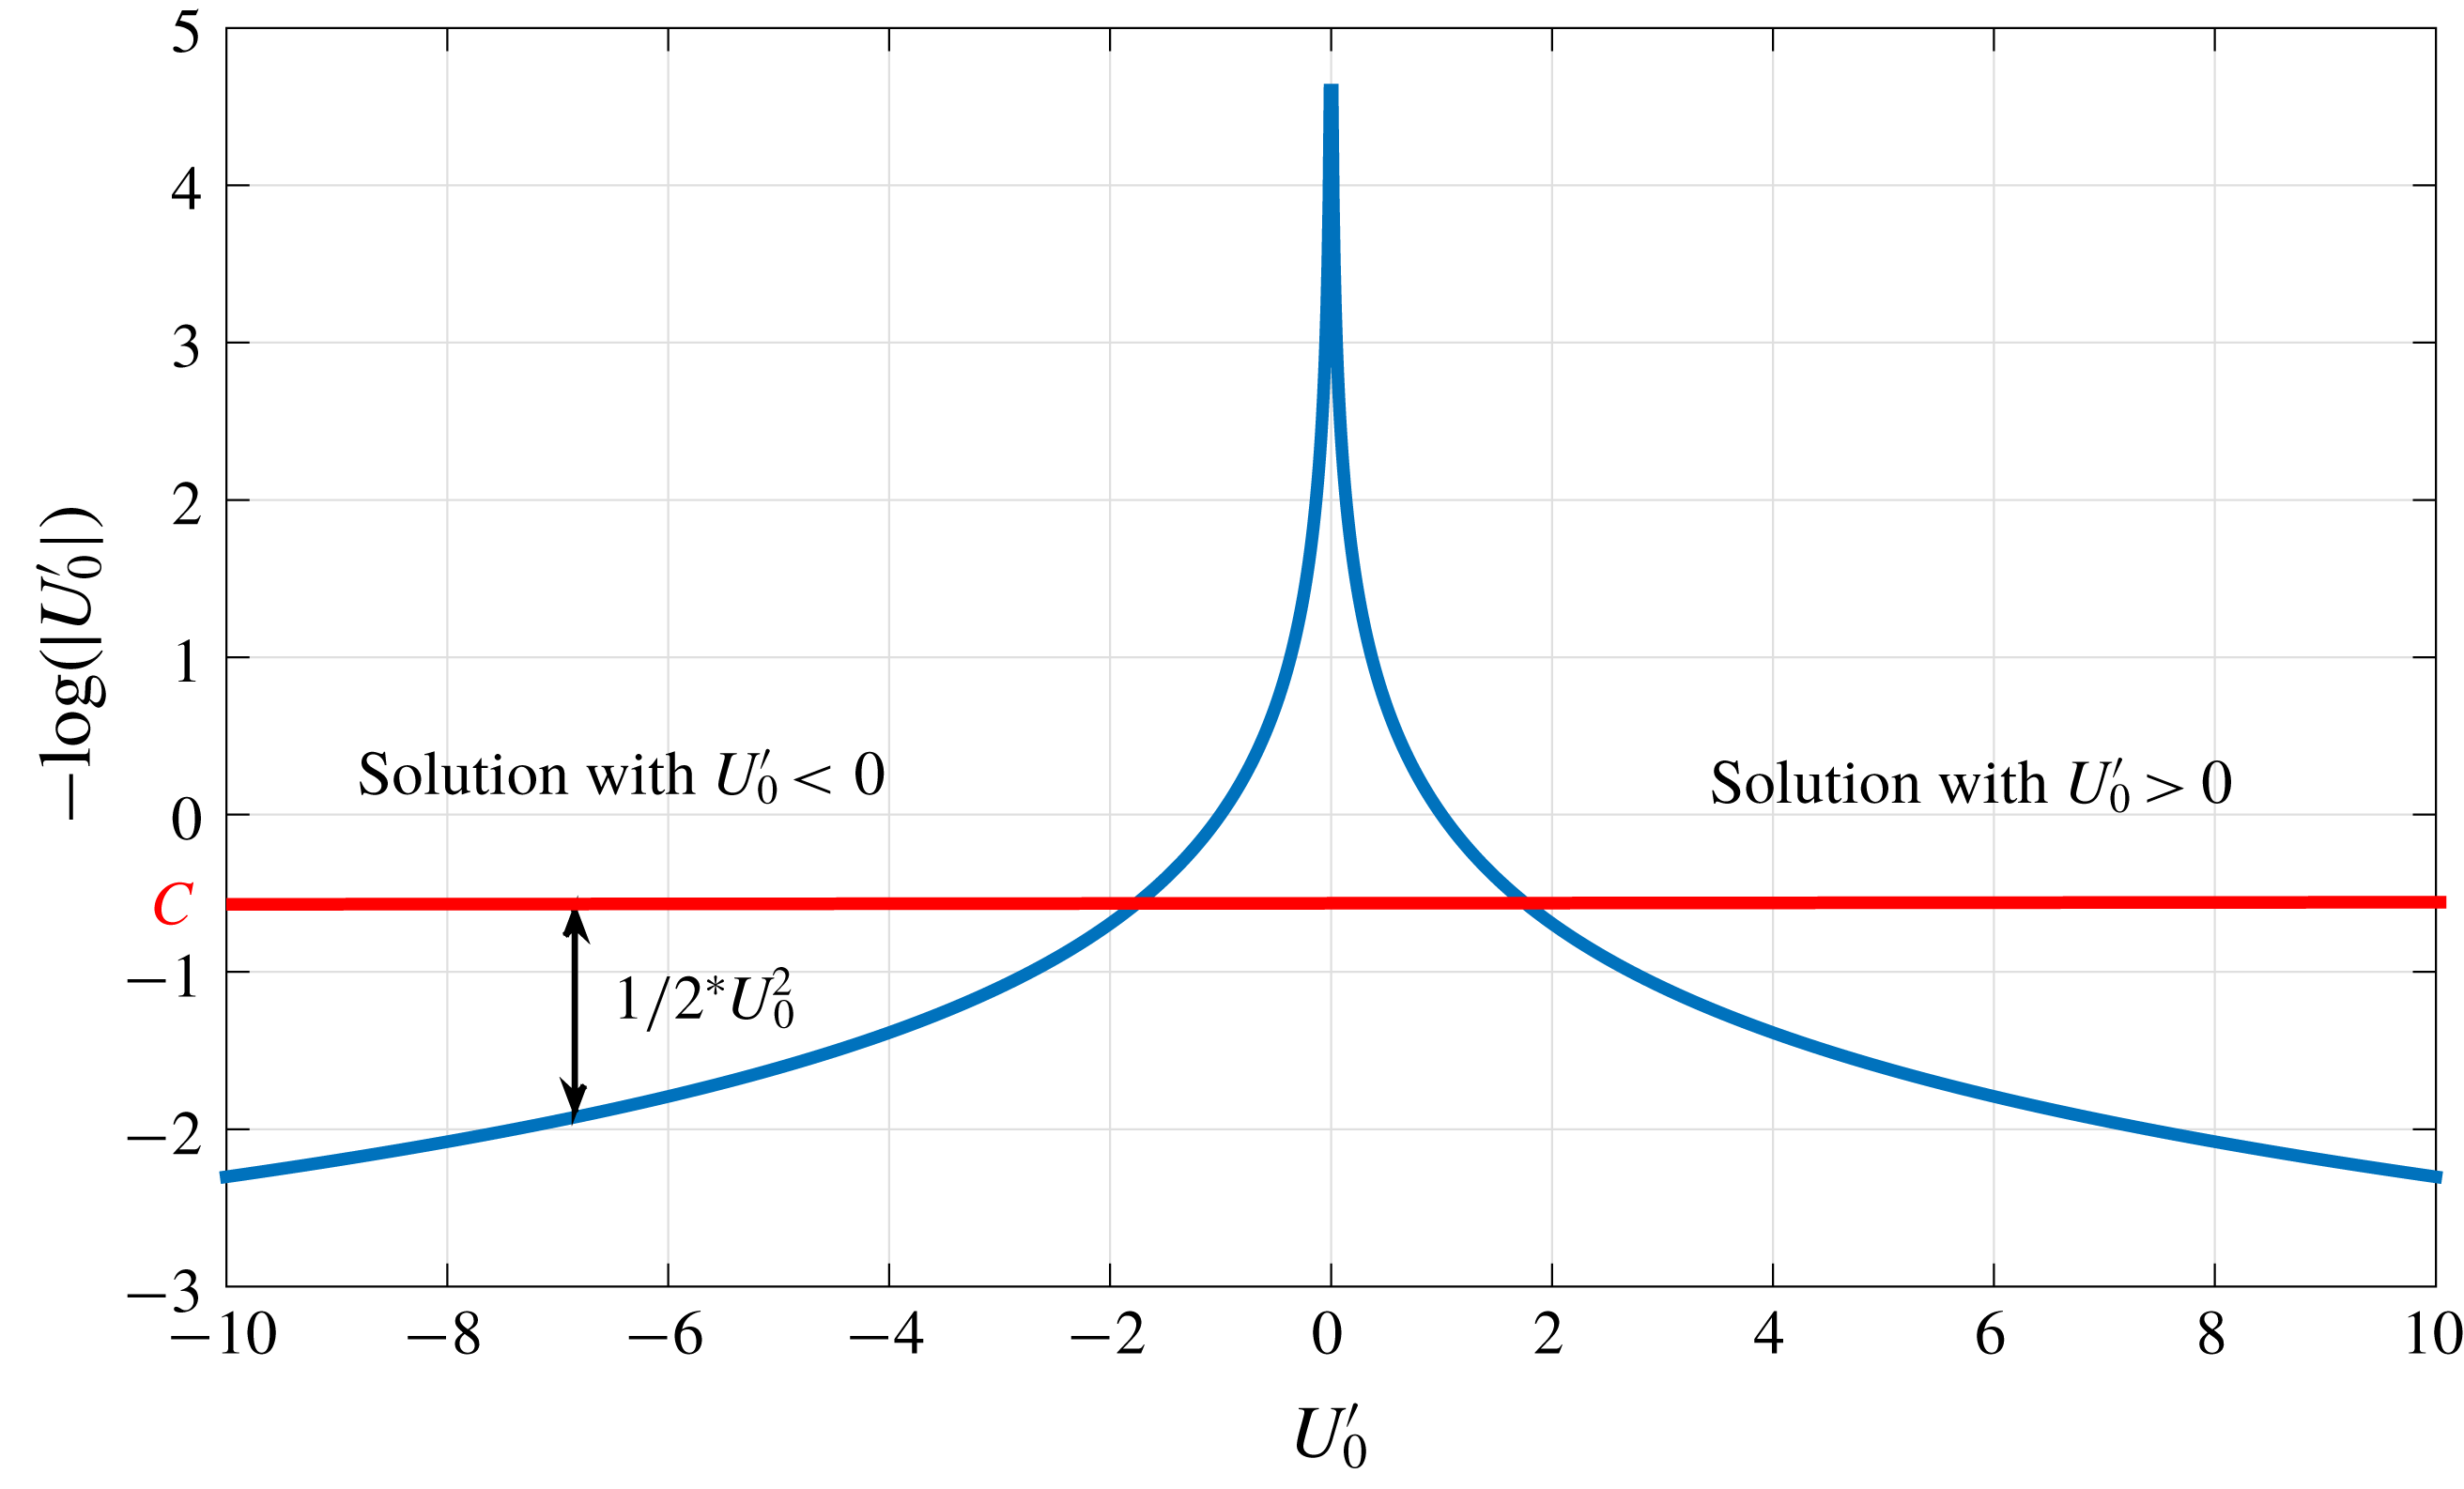
for a particle in a potential. The situation is represented in figure 1.
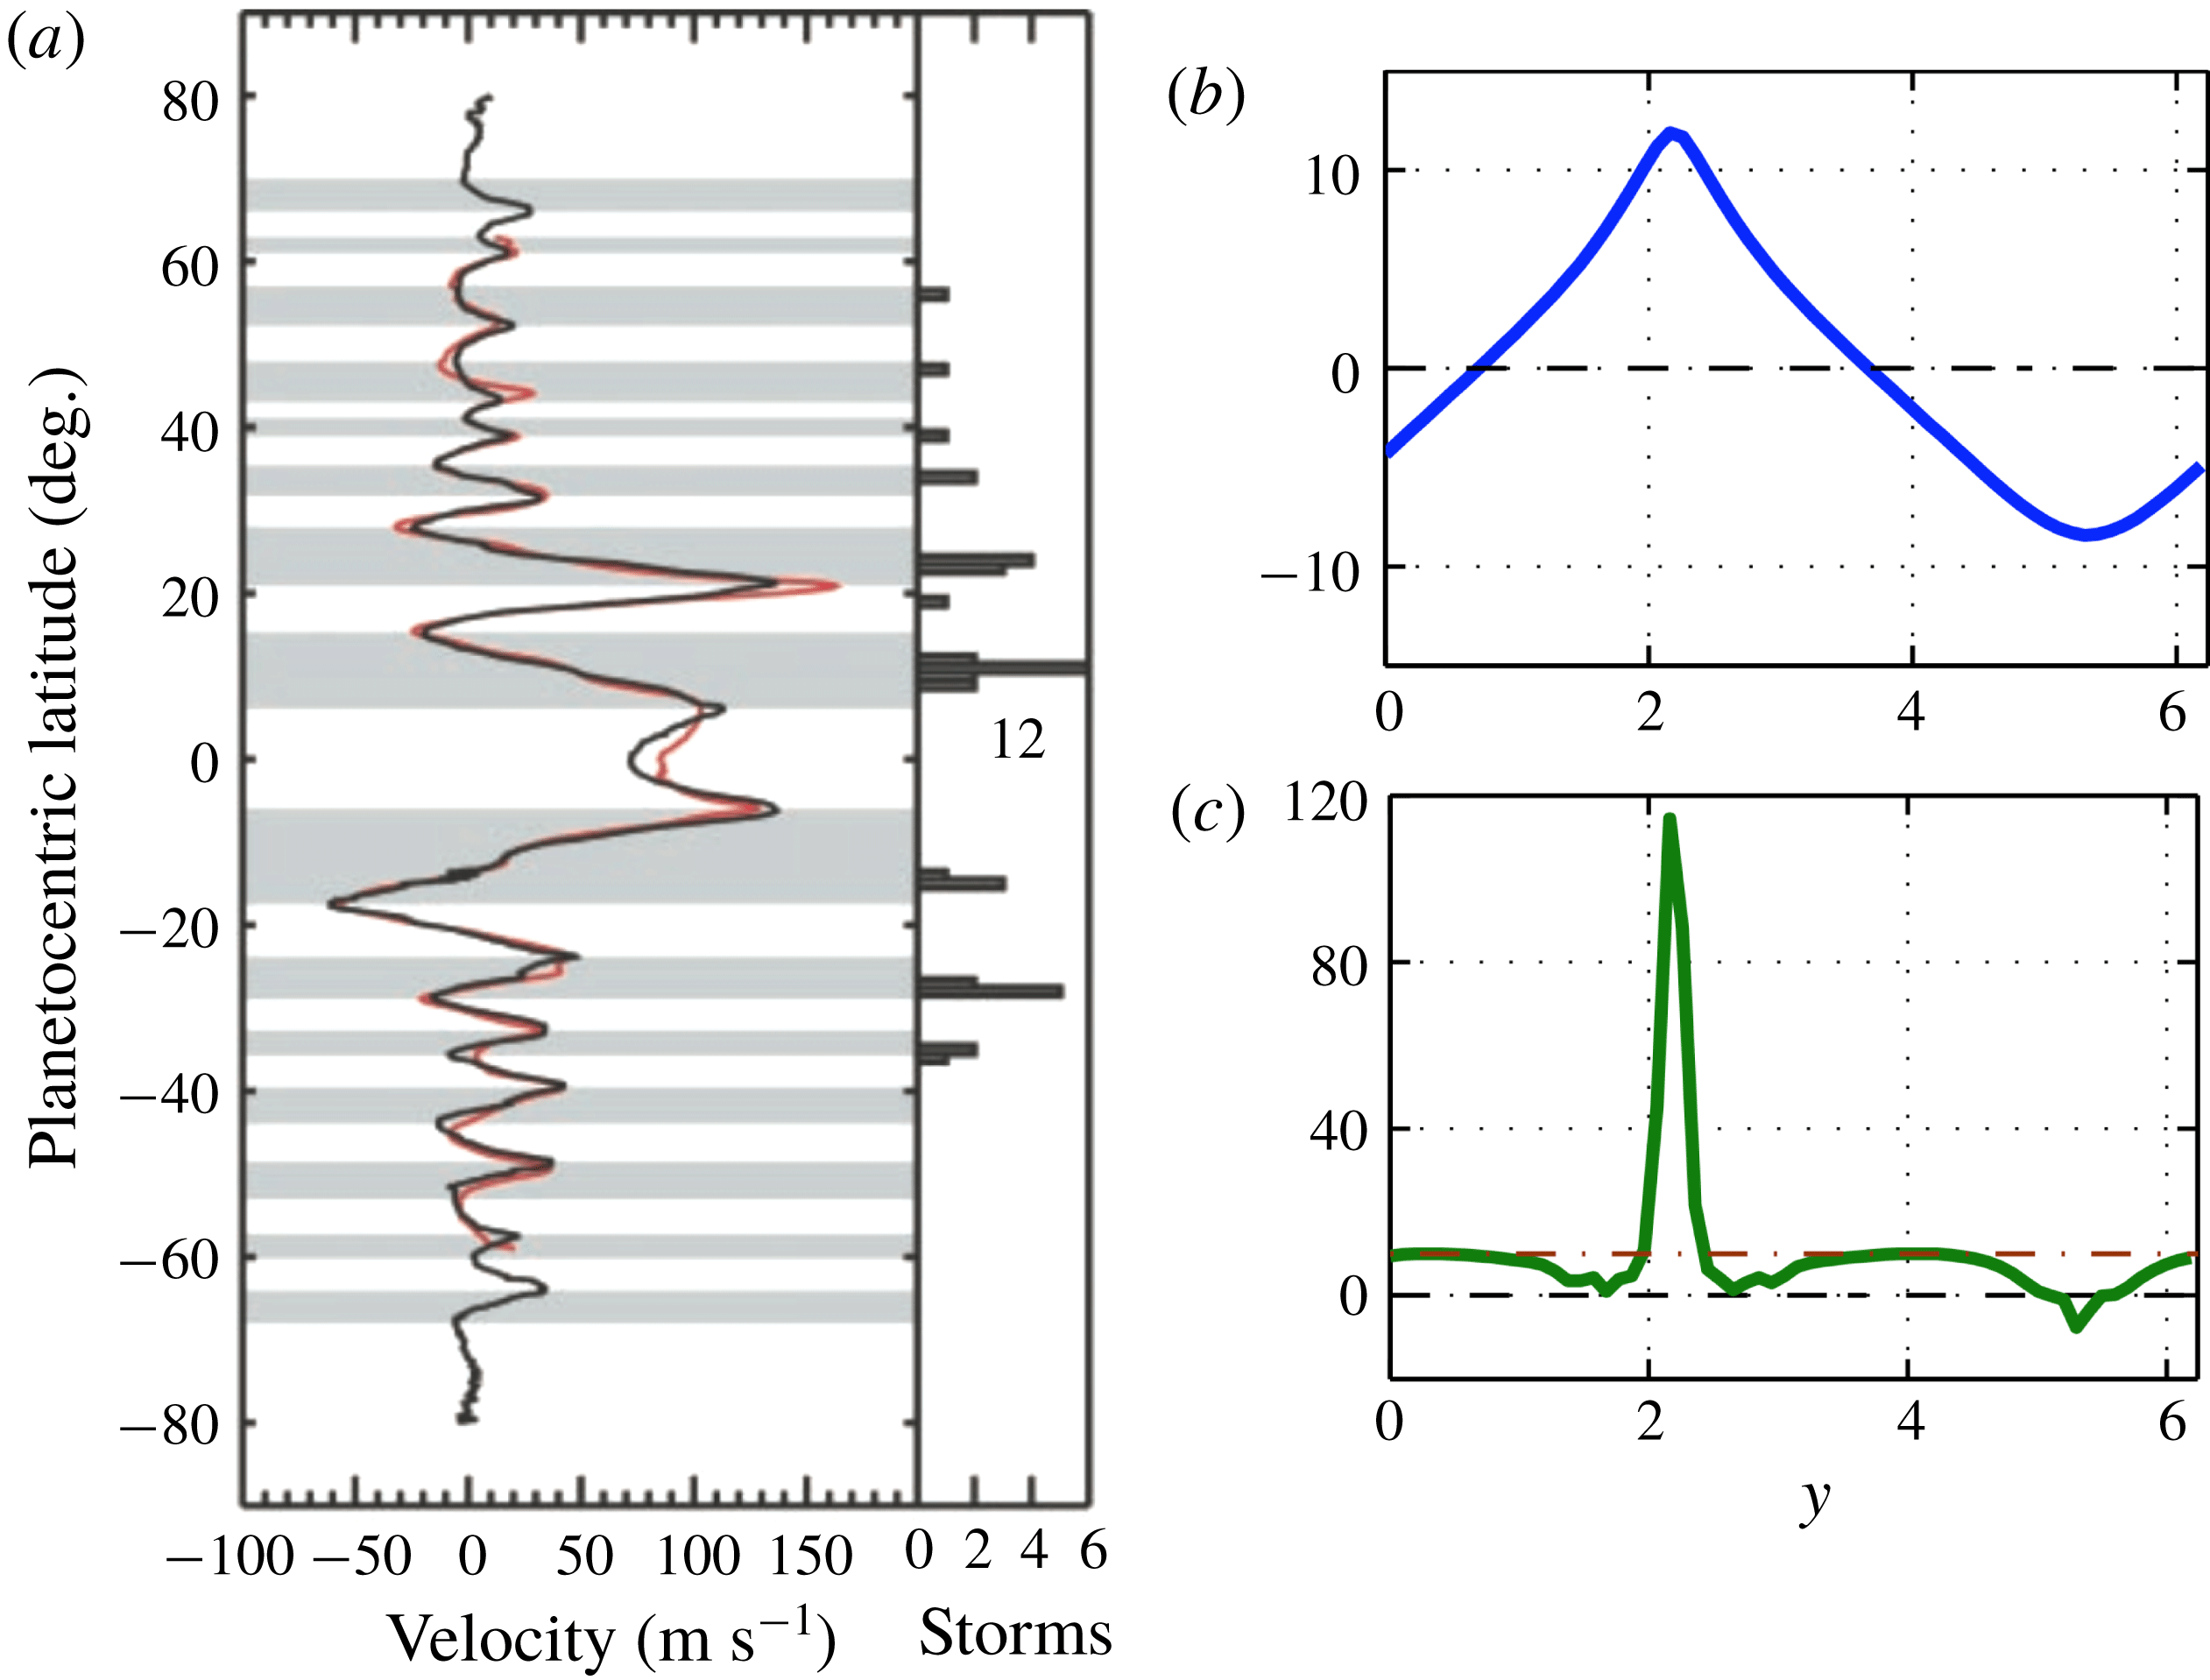
Newtonian structure of the mean flow dynamics. The stationary zonal flow satisfies a Newtonian equation similarly to a particle in a potential. Whatever the value of the integration constant
 $C$
, two classes of solutions exist: one profile has an increasing velocity, the other one has a decreasing velocity.

Whatever the value of the constant
 $C$
, the velocity profile
 $U_{0}$
always diverges. The derivative
 $U_{0}^{\prime }$
cannot change sign. There are two classes of solutions: either solutions with
 $U_{0}^{\prime }>0$
or solutions with
 $U_{0}^{\prime }<0$
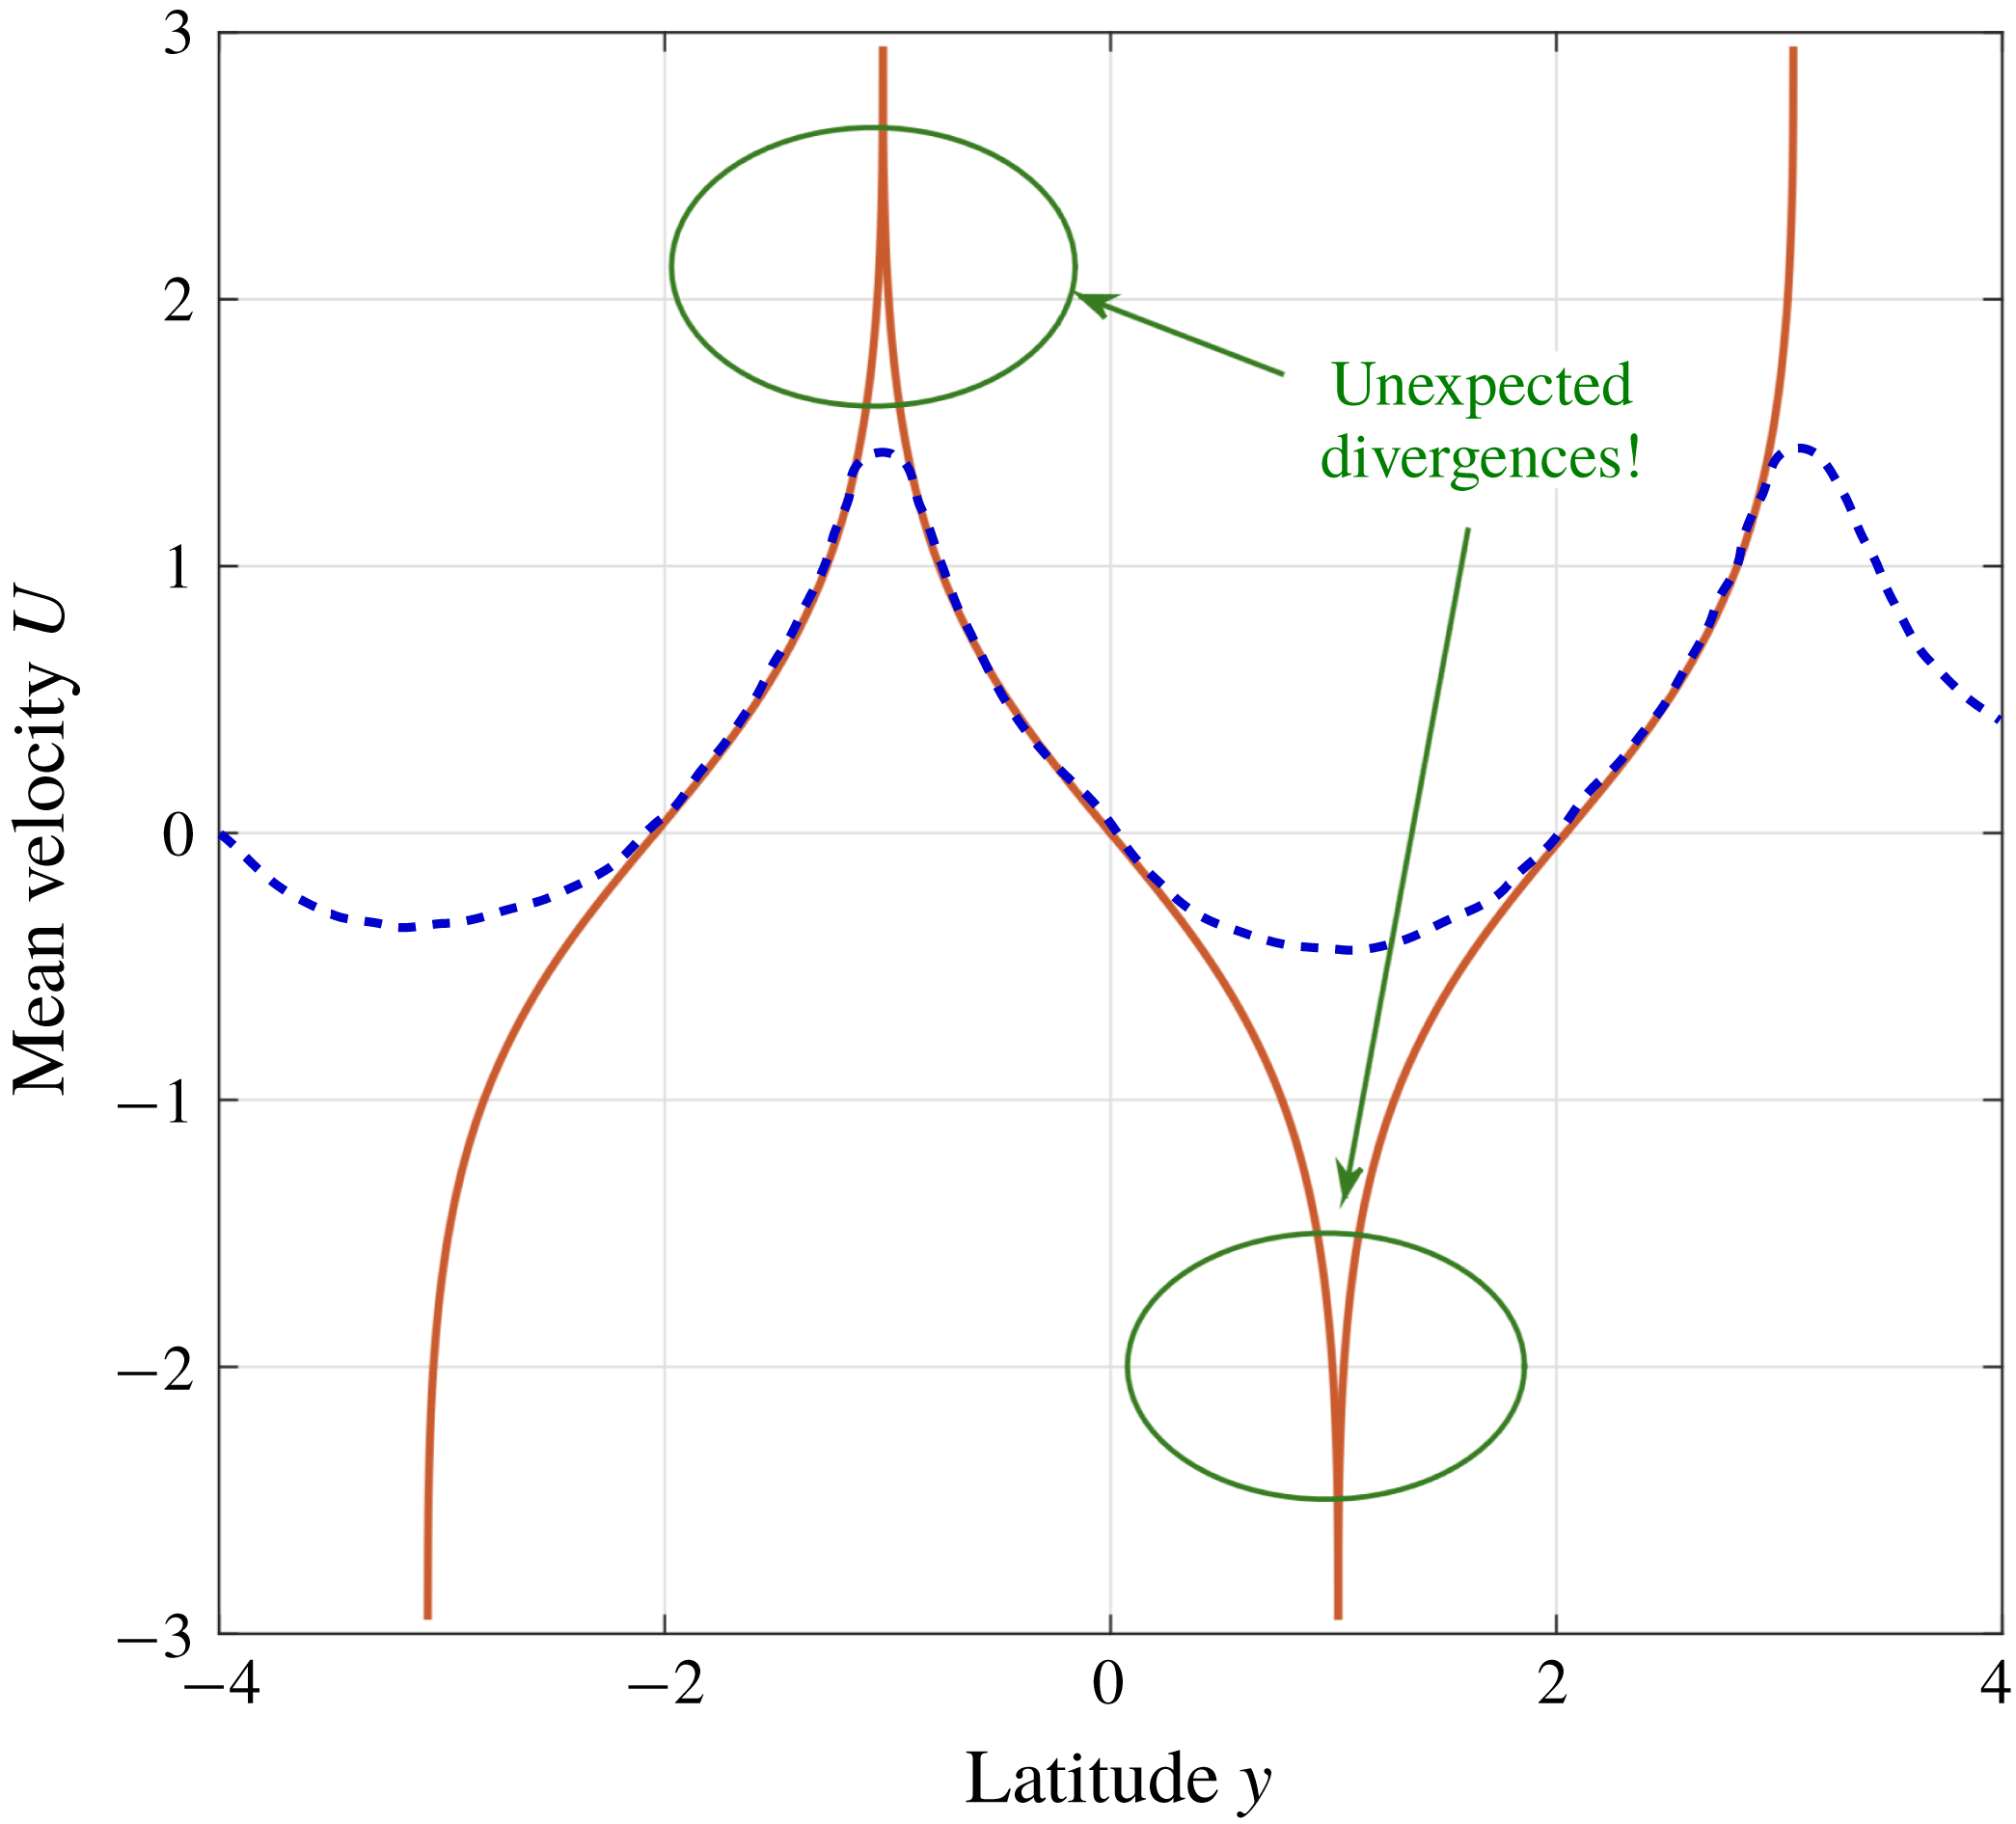
. The two classes of solutions correspond to the two sides of a jet. The solution of (3.14) is represented in figure 2. Equation (3.14) predicts that zonal jets are composed of a succession of diverging velocity profiles, with successively increasing and decreasing values of the velocity. The side with increasing velocity of a jet is totally independent of the side with decreasing velocity. The velocity profiles of westward and eastward jets are symmetric, with in both cases a diverging value of the velocity at the extremum. Such a velocity profile is of course not realistic because the velocity of zonal winds have finite values. By contrast, the qualitative shape of a real profile is displayed by the blue curve in figure 2. Equation (3.14) predicts the velocity profile in the intermediate regions of monotonic velocity, away from the jet edges.
Mean velocity profile in the inertial small-scale forcing limit. The red curve displays the stationary velocity profile of the zonal flow predicted by (3.14), in the inertial small-scale forcing limit. Equation (3.14) predicts symmetric eastward and westward jets, with diverging values of the velocity at the extrema. The blue curve displays the qualitative shape of a real profile as observed on Jupiter or in numerical simulations (see e.g. figures 3 and 5). Two different regularization mechanisms prevent the jet divergence in the eastward part and in the westward part, respectively.

The
 $24^{\circ }$
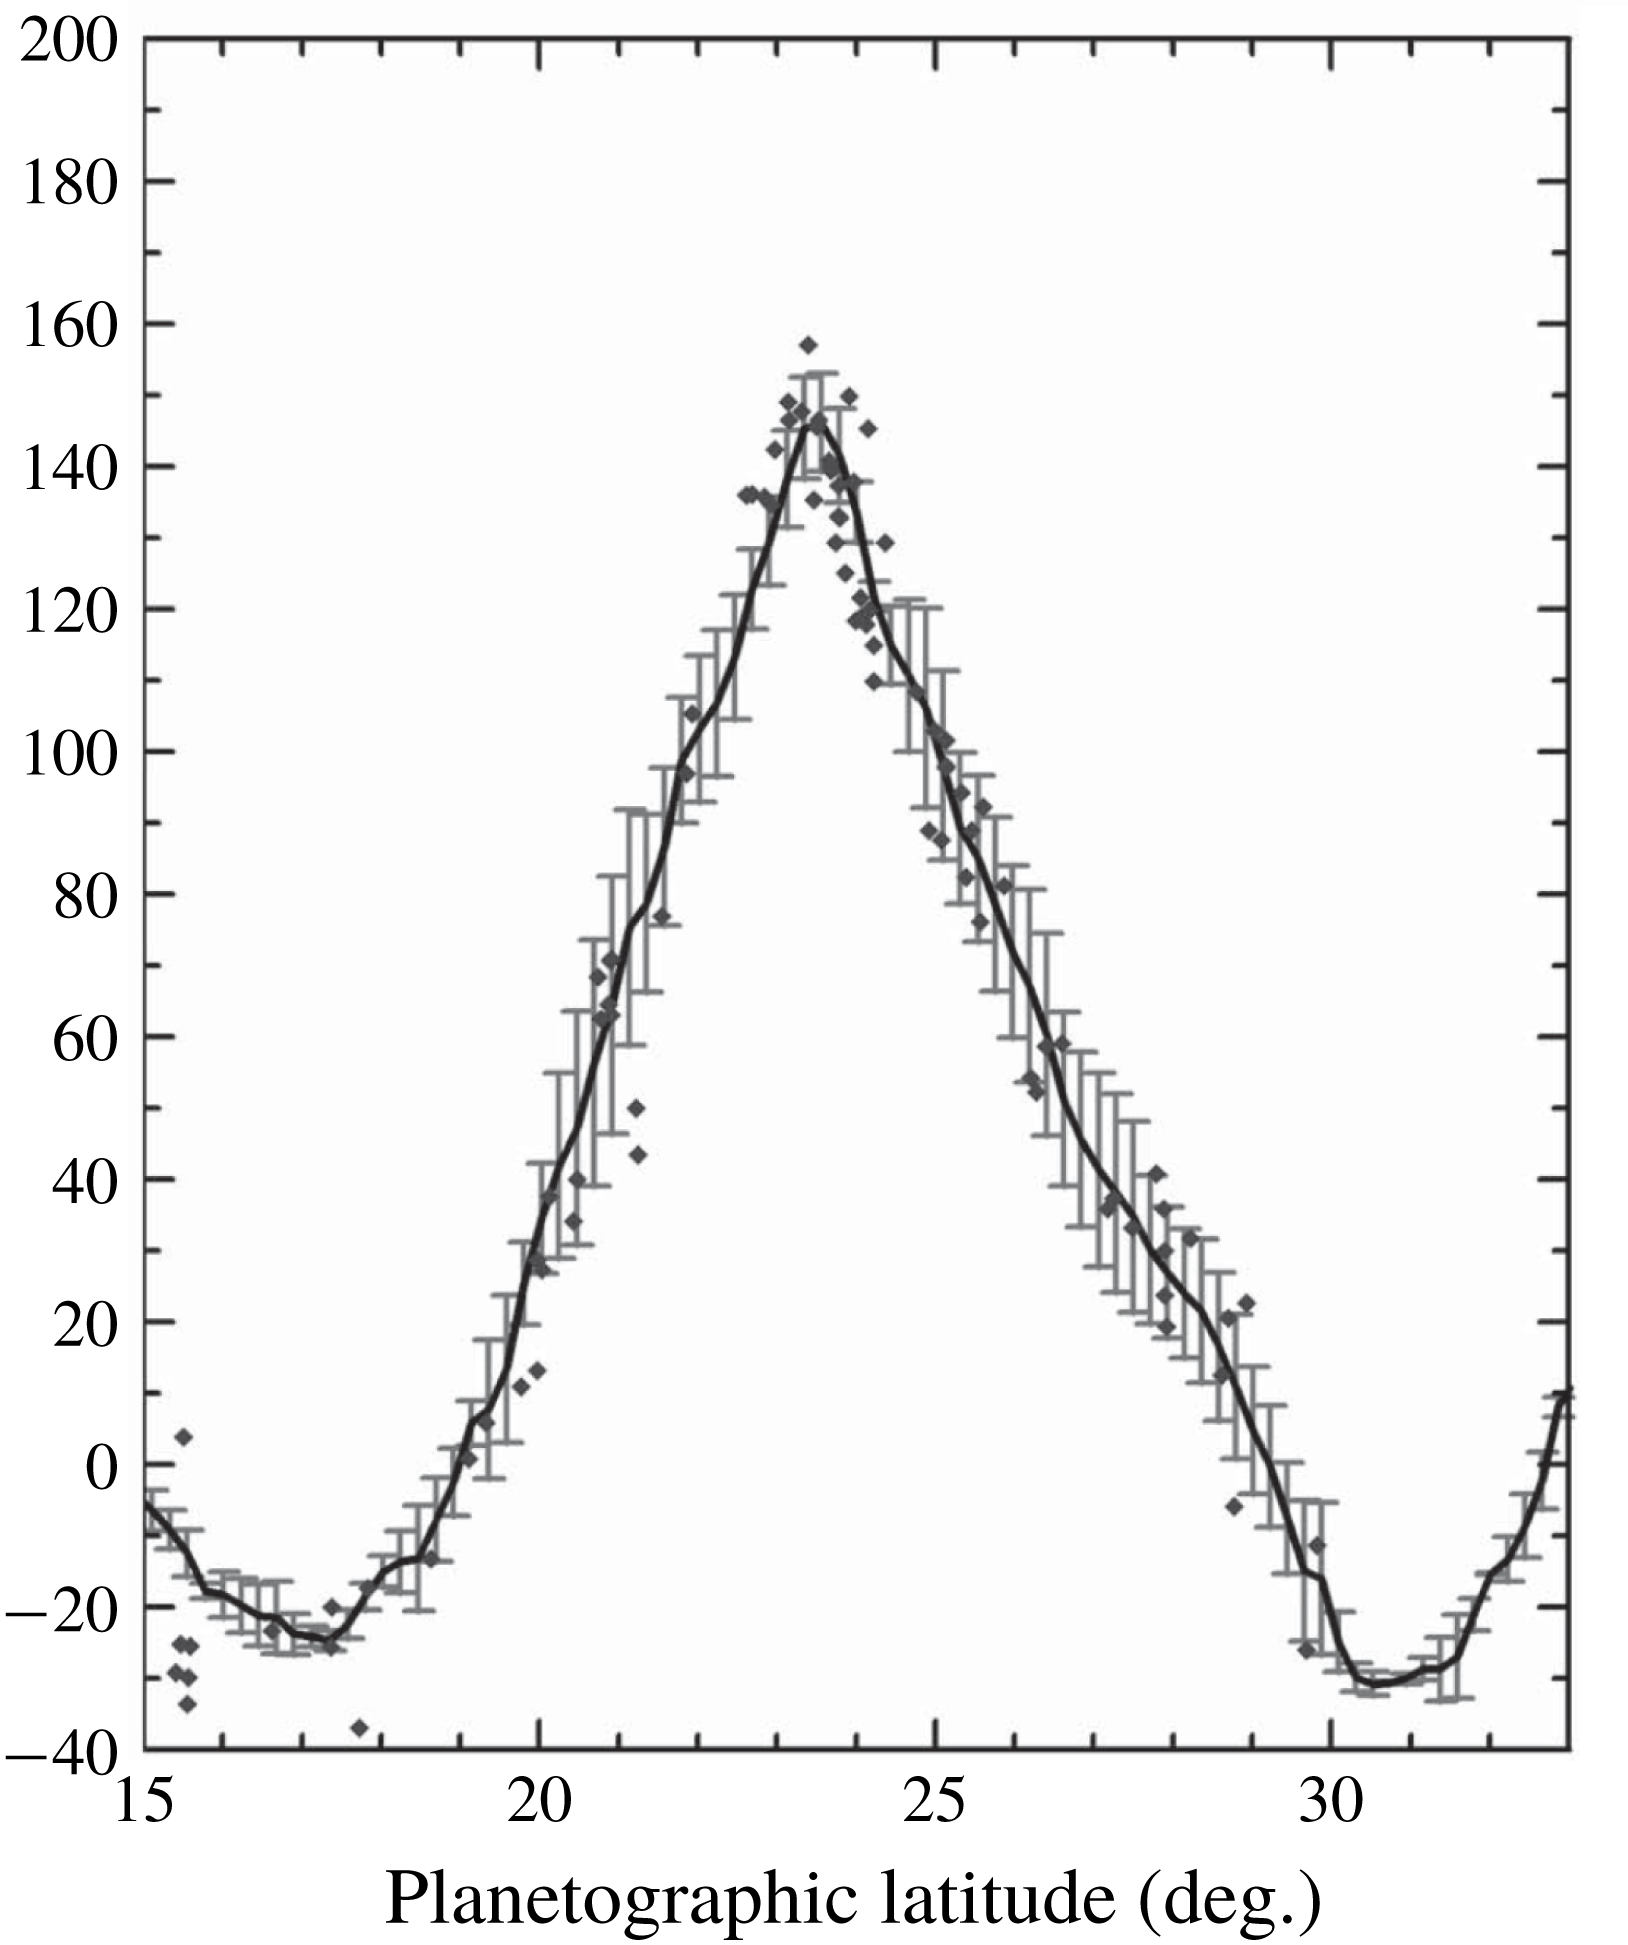
N Jupiter eastward jet (taken from Sánchez-Lavega et al. (Reference Sánchez-Lavega, Orton, Hueso, García-Melendo, Pérez-Hoyos, Simon-Miller, Rojas, Gómez, Yanamandra-Fisher and Fletcher2008)). The vertical scale is the mean velocity of the wind (
 $\text{m}~\text{s}^{-1}$
).

The fact that (3.14) predicts divergent velocity profiles means that some of the hypotheses leading to the result (3.11) are broken at the extrema of zonal jets. The asymptotic expansion has been obtained using two major assumptions: first, the limit
 $kU^{\prime }/U^{\prime \prime }\rightarrow \infty$
should be satisfied; and second, the mean flow should be hydrodynamically stable (no unstable modes in (3.1)). The first assumption is broken at the eastward extrema of jets, and the second is broken at the westward extrema. Section 4 explains the regularization mechanism that creates a cusp at the eastward extremum, and § 5.3 shows that a hydrodynamic instability stops the growth of the westward jet at the maximal curvature
 $\unicode[STIX]{x1D6FD}$
. By taking those physical mechanisms into account, it is possible to get realistic jets that correspond to the observations on Jupiter’s troposphere. The width of the jets is not constrained by (3.13). The typical width of a jet is set by the limit curvature
 $\unicode[STIX]{x1D6FD}$
at the westward extremum that imposes a minimal spacing between two consecutive jets.
3.4 Interpretation of (3.11) from the energy balance
We now give a very enlightening interpretation of the result (3.11) in terms of the energy balance. Multiplying both sides of (2.5) by
 $U$
, we obtain the energy balance equation for the large scales of the flow:
 $$\begin{eqnarray}\unicode[STIX]{x2202}_{t}({\textstyle \frac{1}{2}}U^{2})+\unicode[STIX]{x2202}_{y}(U\langle uv\rangle )=U^{\prime }\langle uv\rangle -rU^{2}.\end{eqnarray}$$
We interpret the different terms in (3.16). The term
 $U^{2}/2$
is the kinetic energy density. The term
 $\unicode[STIX]{x2202}_{y}(U\langle uv\rangle )$
is a divergence, and thus the quantity
 $U\langle uv\rangle$
can be interpreted as the spatial energy flux at large scales. Energy is dissipated by the term
 $-rU^{2}$
. Finally, the term
 $U^{\prime }\langle uv\rangle$
can be interpreted as the energy injection rate in the zonal component of the flow. On the other hand, (3.11) can be written as
 $$\begin{eqnarray}U^{\prime }\langle uv\rangle =\unicode[STIX]{x1D716}\end{eqnarray}$$
after integration over
 $y$
. From the energy balance (3.16), the term
 $U^{\prime }\langle uv\rangle$
can be interpreted as the rate of energy transferred from the small-scale eddies to the mean flow. In (3.17)
 $\unicode[STIX]{x1D716}$
is the total energy injection rate. Relation (3.17) thus means that all energy injected at small scale is transferred locally to the largest scale of the flow. The fact that all energy is transferred to the largest scale before being dissipated can be explained by the limits
 $\unicode[STIX]{x1D6FC}\rightarrow 0$
and
 $K\rightarrow +\infty$
. The inertial limit
 $\unicode[STIX]{x1D6FC}\rightarrow 0$
corresponds to a vanishing value of the friction coefficient
 $r$
. In the limit of vanishing friction, the system has no time to dissipate energy at small scale and all energy is transferred to the largest scale. The small-scale forcing limit
 $K\rightarrow +\infty$
prevents energy transfers between the different parts of the flow. The velocity fluctuations at latitude
 $y$
only interact with the flow in a small region of size of the order of
 $1/K$
. Thus, spatial energy transfer is impossible and energy has to be transferred to the mean flow at the same latitude
 $y$
. For the local velocity fluctuations, the mean flow at scale
 $1/K$
looks like a parabolic profile with derivative
 $U^{\prime }(y)$
and second derivative
 $U^{\prime \prime }(y)$
, which is why the asymptotic development of the Reynolds stress divergence is expressed in terms of
 $U^{\prime }$
and
 $U^{\prime \prime }$
.
To sum up this idea, we can say that the energy transfer is local in physical space, but non-local in Fourier space. Energy is transferred directly from the scale
 $1/K$
to the mean flow through direct interaction between the mean flow and the eddies, and not through an inverse energy cascade in Fourier space. Energy transfer is possible only if
 $U^{\prime }\neq 0$
. At the extrema of jets, expression (3.17) breaks down because direct energy transfer from small scales to the mean flow is impossible.
4 Cusps for eastward jets
We now assume that there are no hydrodynamic instabilities in the eastward part of zonal jets. In the previous parts of this paper, we saw that the formula (3.11),
 $\unicode[STIX]{x2202}_{y}\langle uv\rangle =-\unicode[STIX]{x1D716}(U^{\prime \prime }/U^{\prime 2})$
, gives a divergent mean velocity profile and we discussed that this formula can be valid only in the limit
 $KU^{\prime }/U^{\prime \prime }\rightarrow \infty$
. The latter limit is not satisfied close to the eastward extrema. The result (3.14) shows that the ratio
 $KU^{\prime }/U^{\prime \prime }$
behaves as
 $K(y_{cr}-y)$
, where
 $y_{cr}$
is the critical latitude of the eastward divergence. Even for large values of
 $K$
, the asymptotic expansion breaks down in a narrow region of size
 $1/K$
around the eastward peak. The limit (3.11) is only valid between the extrema of the jet. But in a region of size
 $1/K$
around the extremum, another mechanism takes place to stop the jet growth and regularize the mean velocity profile at scale
 $1/K$
. On Jupiter, the data collected by Galileo and Cassini, displayed in figure 3, indicate that the eastward jets have ‘cusps’, while the westward jets seem smoother. We first discuss the eastward jet cusps.
Looking more precisely at the cusp of figure 3, we see that its size is approximately 1 degree, i.e. a scale of approximately 1000 km. When we observe Jupiter’s surface, we can see the fluctuating vortices evolving in a time scale of a few days (Porco et al.
Reference Porco, West, McEwen, Del Genio, Ingersoll, Thomas, Squyres, Dones, Murray and Johnson2003). The size of those vortices is related to three-dimensional motions, producing convection plumes that develop PV disturbances at a scale that is approximately the Rossby deformation radius of order 1000 km and with PV of order
 $\unicode[STIX]{x1D6FD}$
, the Coriolis parameter. In our effective model of barotropic flows, all these convective phenomena are modelled by the stochastic force. Accordingly, we choose the forcing scale
 $1/K$
to be of the order of 1000 km.
A natural question is: can we have a cusp solution of the stationary equation
 $$\begin{eqnarray}\langle v\unicode[STIX]{x1D714}\rangle [U]=U\end{eqnarray}$$
in the limit
 $K\rightarrow \infty$
?
In order to address this question, we consider (3.1) and study its large-
 $K$
asymptote after changing the scale
 $y\leftarrow Ky$
. We denote by
 $\unicode[STIX]{x1D703}$
the angle defined through the relation
 $\cos \unicode[STIX]{x1D703}:=k/K$
. As we are looking for a cusp of size
 $1/K$
, it will be convenient to set
 $\tilde{U} (y)=U(y/K)$
. This implies that
 $(1/K^{2})U^{\prime \prime }(y/K)=\tilde{U} ^{\prime \prime }(y)$
. Equation (3.1) becomes
 $$\begin{eqnarray}\left(\frac{\text{d}^{2}}{\text{d}y^{2}}-\cos ^{2}\unicode[STIX]{x1D703}\right)\unicode[STIX]{x1D711}_{\unicode[STIX]{x1D716}}(y/K,c)+\frac{\unicode[STIX]{x1D6FD}/K^{2}-\tilde{U} ^{\prime \prime }(y)}{\tilde{U} (y)-c-\text{i}\unicode[STIX]{x1D716}}\unicode[STIX]{x1D711}_{\unicode[STIX]{x1D716}}(y/K,c)=\frac{\unicode[STIX]{x1D714}(y/K,0)}{\text{i}kK^{2}(\tilde{U} (y)-c-\text{i}\unicode[STIX]{x1D716})}.\end{eqnarray}$$
We set
 $\text{i}kK^{2}\unicode[STIX]{x1D711}(y/K,c):=\unicode[STIX]{x1D719}(y,c)$
. From (3.2) the function
 $\unicode[STIX]{x1D714}^{\infty }$
satisfies
 $$\begin{eqnarray}\unicode[STIX]{x1D714}^{\infty }\left(\frac{y}{K}\right)=\unicode[STIX]{x1D714}\left(\frac{y}{K},0\right)+\left(\tilde{U} ^{\prime \prime }(y)-\frac{\unicode[STIX]{x1D6FD}}{K^{2}}\right)\unicode[STIX]{x1D719}_{+}(y,c).\end{eqnarray}$$
Expression (4.3) shows that the limit of large
 $K$
completely cancels the effect of the parameter
 $\unicode[STIX]{x1D6FD}$
. However, the solution
 $\tilde{U}$
still depends on
 $\unicode[STIX]{x1D703}$
. We first consider the case where the spectrum has only one component
 $\unicode[STIX]{x1D703}$
. Let
 $w_{\unicode[STIX]{x1D703}}(y):=\unicode[STIX]{x1D714}^{\infty }(y/K)$
. Equations (2.17), (3.1) and (3.2) give the set of equations defining the Reynolds stress divergence
 $\langle v\unicode[STIX]{x1D714}\rangle [\tilde{U} ]$
in the large-
 $K$
limit:
 $$\begin{eqnarray}\left.\begin{array}{@{}c@{}}\left({\displaystyle \frac{\text{d}^{2}}{\text{d}y^{2}}}-\tan ^{2}\unicode[STIX]{x1D703}\right)\unicode[STIX]{x1D719}_{\unicode[STIX]{x1D716}}(y,c)-{\displaystyle \frac{\tilde{U} ^{\prime \prime }(y)}{\tilde{U} (y)-c-\text{i}\unicode[STIX]{x1D716}}}\unicode[STIX]{x1D719}_{\unicode[STIX]{x1D716}}(y,c)={\displaystyle \frac{\text{e}^{\text{i}\sin \unicode[STIX]{x1D703}y}}{\tilde{U} (y)-c-\text{i}\unicode[STIX]{x1D716}}},\\ \text{e}^{\text{i}\sin \unicode[STIX]{x1D703}y}+\tilde{U} ^{\prime \prime }(y)\unicode[STIX]{x1D719}_{+}(y,\tilde{U} (y))=w_{\unicode[STIX]{x1D703}}(y),\\ {\displaystyle \frac{1}{\tilde{U} ^{\prime \prime }(y)}}[|w_{\unicode[STIX]{x1D703}}(y)|^{2}-1]=\langle v\unicode[STIX]{x1D714}\rangle _{\unicode[STIX]{x1D703}}[\tilde{U} ].\end{array}\right\}\end{eqnarray}$$
The first equation is the inhomogeneous Rayleigh equation without the
 $\unicode[STIX]{x1D6FD}$
-effect. The second one is the modified expression to compute
 $\unicode[STIX]{x1D714}^{\infty }$
, and the last one is the pseudo-momentum balance giving access to the Reynolds stress divergence.
Before we go on with numerical analysis, let us give some analytic results on the set of equations (4.4).
(i) We have already given expression (3.10) for the Reynolds stress divergence in the limit
$K\rightarrow +\infty$
, away from the extremum of the jet. As we have used the scaling
$y\leftarrow Ky$
to find (4.4), we expect to recover the asymptotic equation (3.10) in the limit
$y\rightarrow \infty$
. For a given profile
$\tilde{U}$
, we have the asymptotic result
$\langle v\unicode[STIX]{x1D714}\rangle [\tilde{U} ]{\sim}_{y\rightarrow \infty }-\tilde{U} ^{\prime \prime }/\tilde{U} ^{\prime 2}$
.(ii) We know that the relation
$\unicode[STIX]{x1D714}^{\infty }(y_{cr})=0$
holds at the extremum (see § 3.1), which corresponds here to
$w_{\unicode[STIX]{x1D703}}(y_{cr})=0$
. At the extremum, the third equality in (4.4) shows that
$\langle v\unicode[STIX]{x1D714}\rangle =-1/\tilde{U} ^{\prime \prime }$
. At a maximum of
$U$
(eastward jet),
$\tilde{U} ^{\prime \prime }<0$
and the Reynolds stress divergence thus forces the profile
$\tilde{U}$
to grow. The opposite happens at a minimum of
$U$
: we have
$\tilde{U} ^{\prime \prime }>0$
and the velocity decays, such that its magnitude grows. The consequence is that the turbulence always forces the jet to grow. The growth can be stopped by either linear friction or nonlinear effects beyond the quasi-linear approximation. For westward jets, we will see in § 5.3 that it can also be stopped by a hydrodynamic instability.(iii) The formula
(4.5)is in itself noteworthy. It comes from the phenomenon of depletion of vorticity at the stationary streamlines, which has already been emphasized by Bouchet & Morita (Reference Bouchet and Morita2010). To reach the stationary profile,$$\begin{eqnarray}\langle v\unicode[STIX]{x1D714}\rangle (y_{cr})=-\frac{1}{\tilde{U} ^{\prime \prime }(y_{cr})}\end{eqnarray}$$
$\langle v\unicode[STIX]{x1D714}\rangle$
has to equilibrate the linear friction. At the jet extremum, the stationary state of
$U$
in (2.6) gives the equality (4.6)We can thus link the value of the velocity at the extremum of the jet and the curvature of the cusp. Relations (4.5) and (4.6) give the second important result of this paper:$$\begin{eqnarray}\langle v\unicode[STIX]{x1D714}\rangle (y_{cr})=\tilde{U} (y_{cr}).\end{eqnarray}$$
(4.7)Coming back to dimensional fields, the eastward cusp satisfies the relation$$\begin{eqnarray}\tilde{U} (y_{cr})=-\frac{1}{\tilde{U} ^{\prime \prime }(y_{cr})}.\end{eqnarray}$$
(4.8)where$$\begin{eqnarray}U(y_{cr})=-\frac{\unicode[STIX]{x1D716}K^{2}}{rU^{\prime \prime }(y_{cr})},\end{eqnarray}$$
$\unicode[STIX]{x1D716}$
is the energy injection rate. Relation (4.8) is a universal property of stationary jet profiles. It relates the strength of a jet to its curvature, and the physical parameters
$\unicode[STIX]{x1D716}$
,
$r$
and
$K$
. It does not depend on the forcing Fourier spectrum, but only on the scale
$1/K$
at which energy is injected.


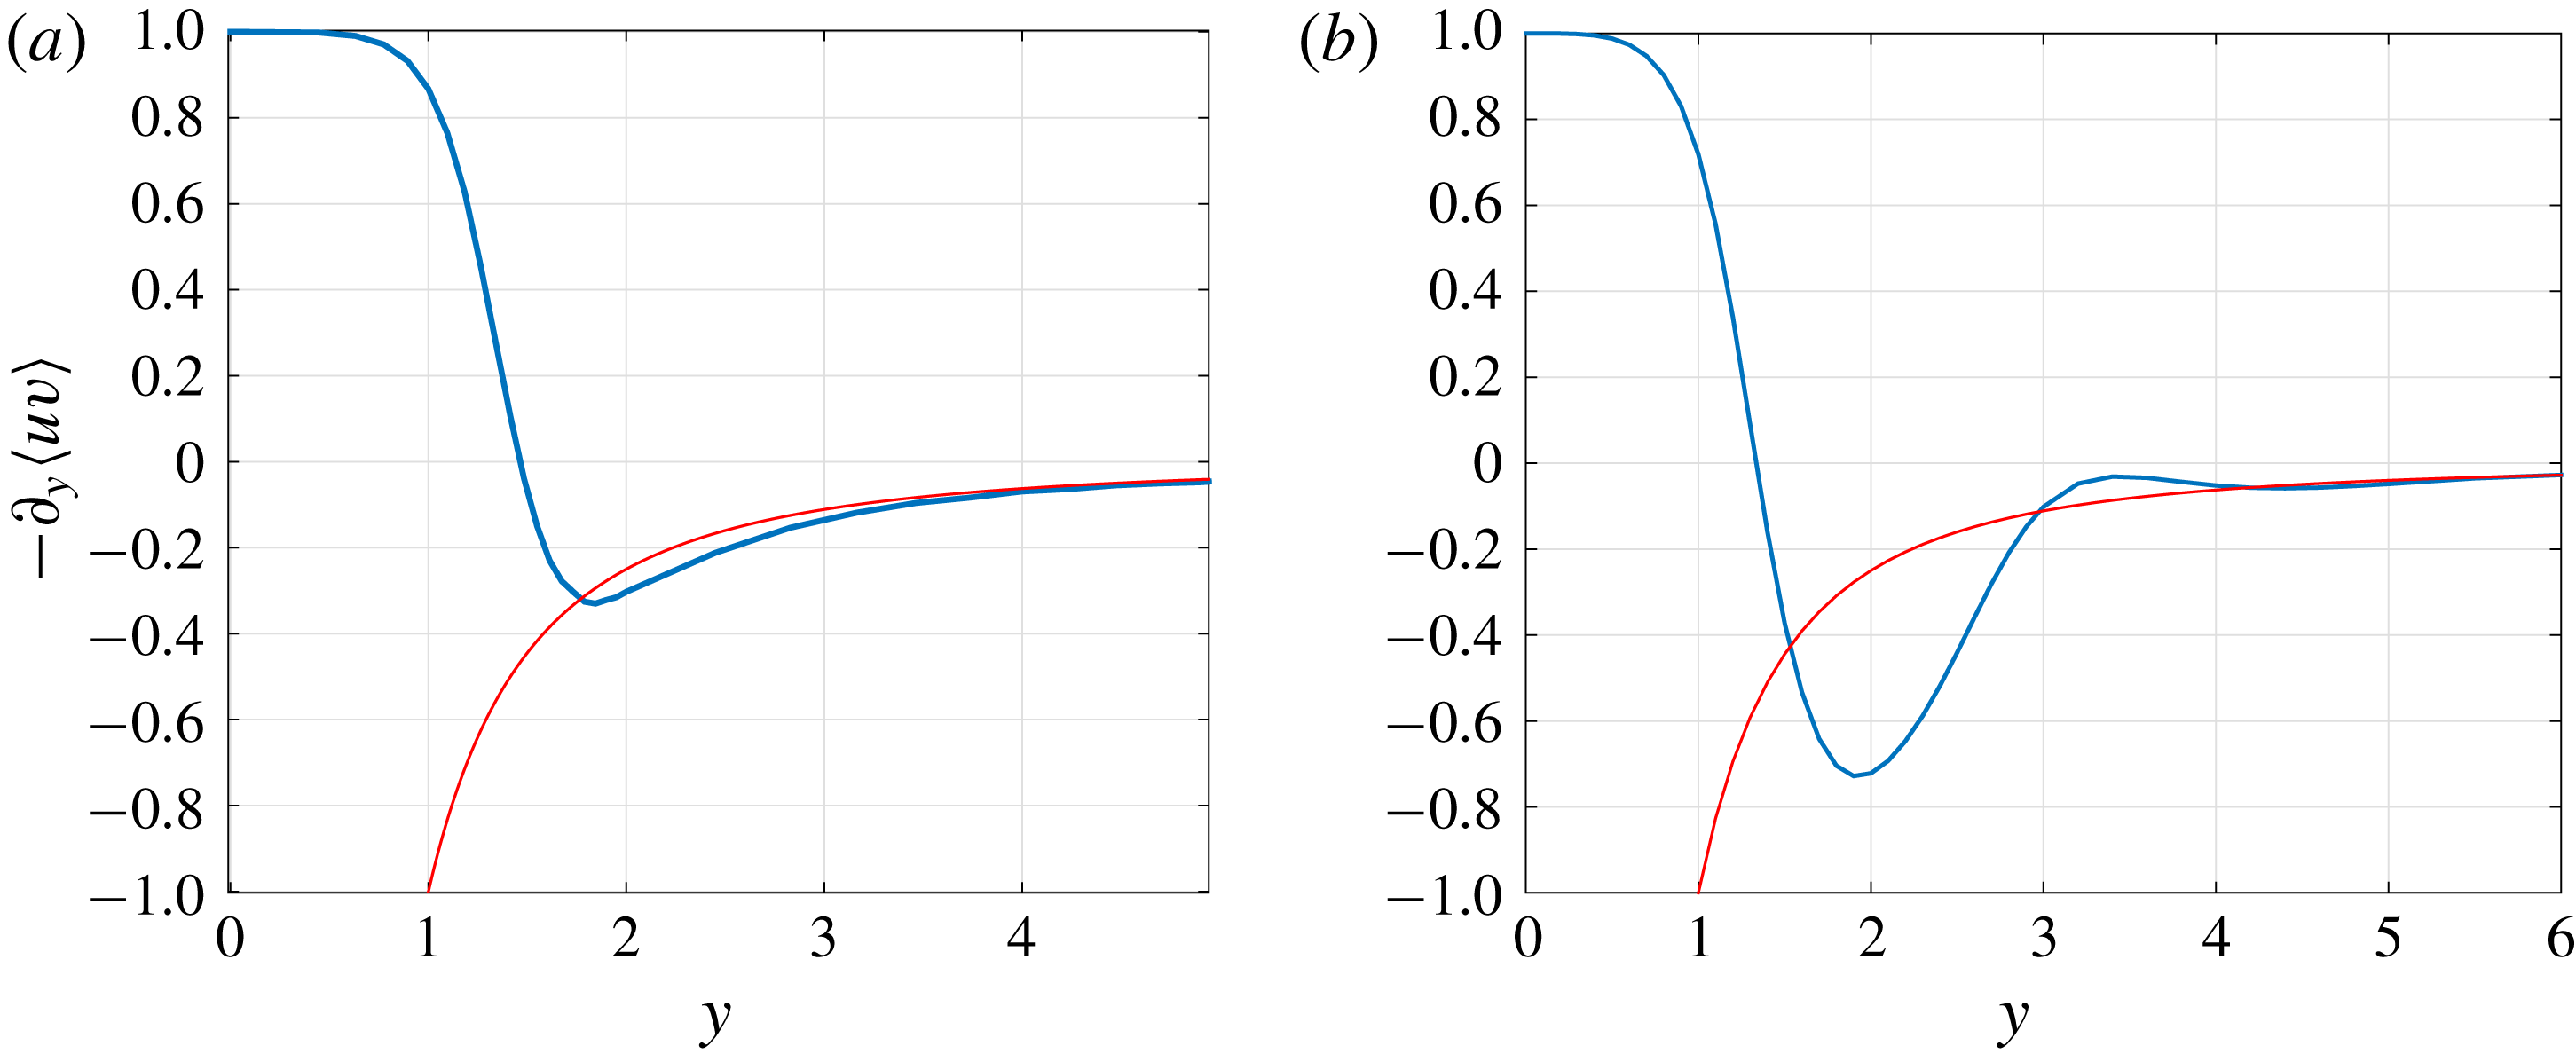
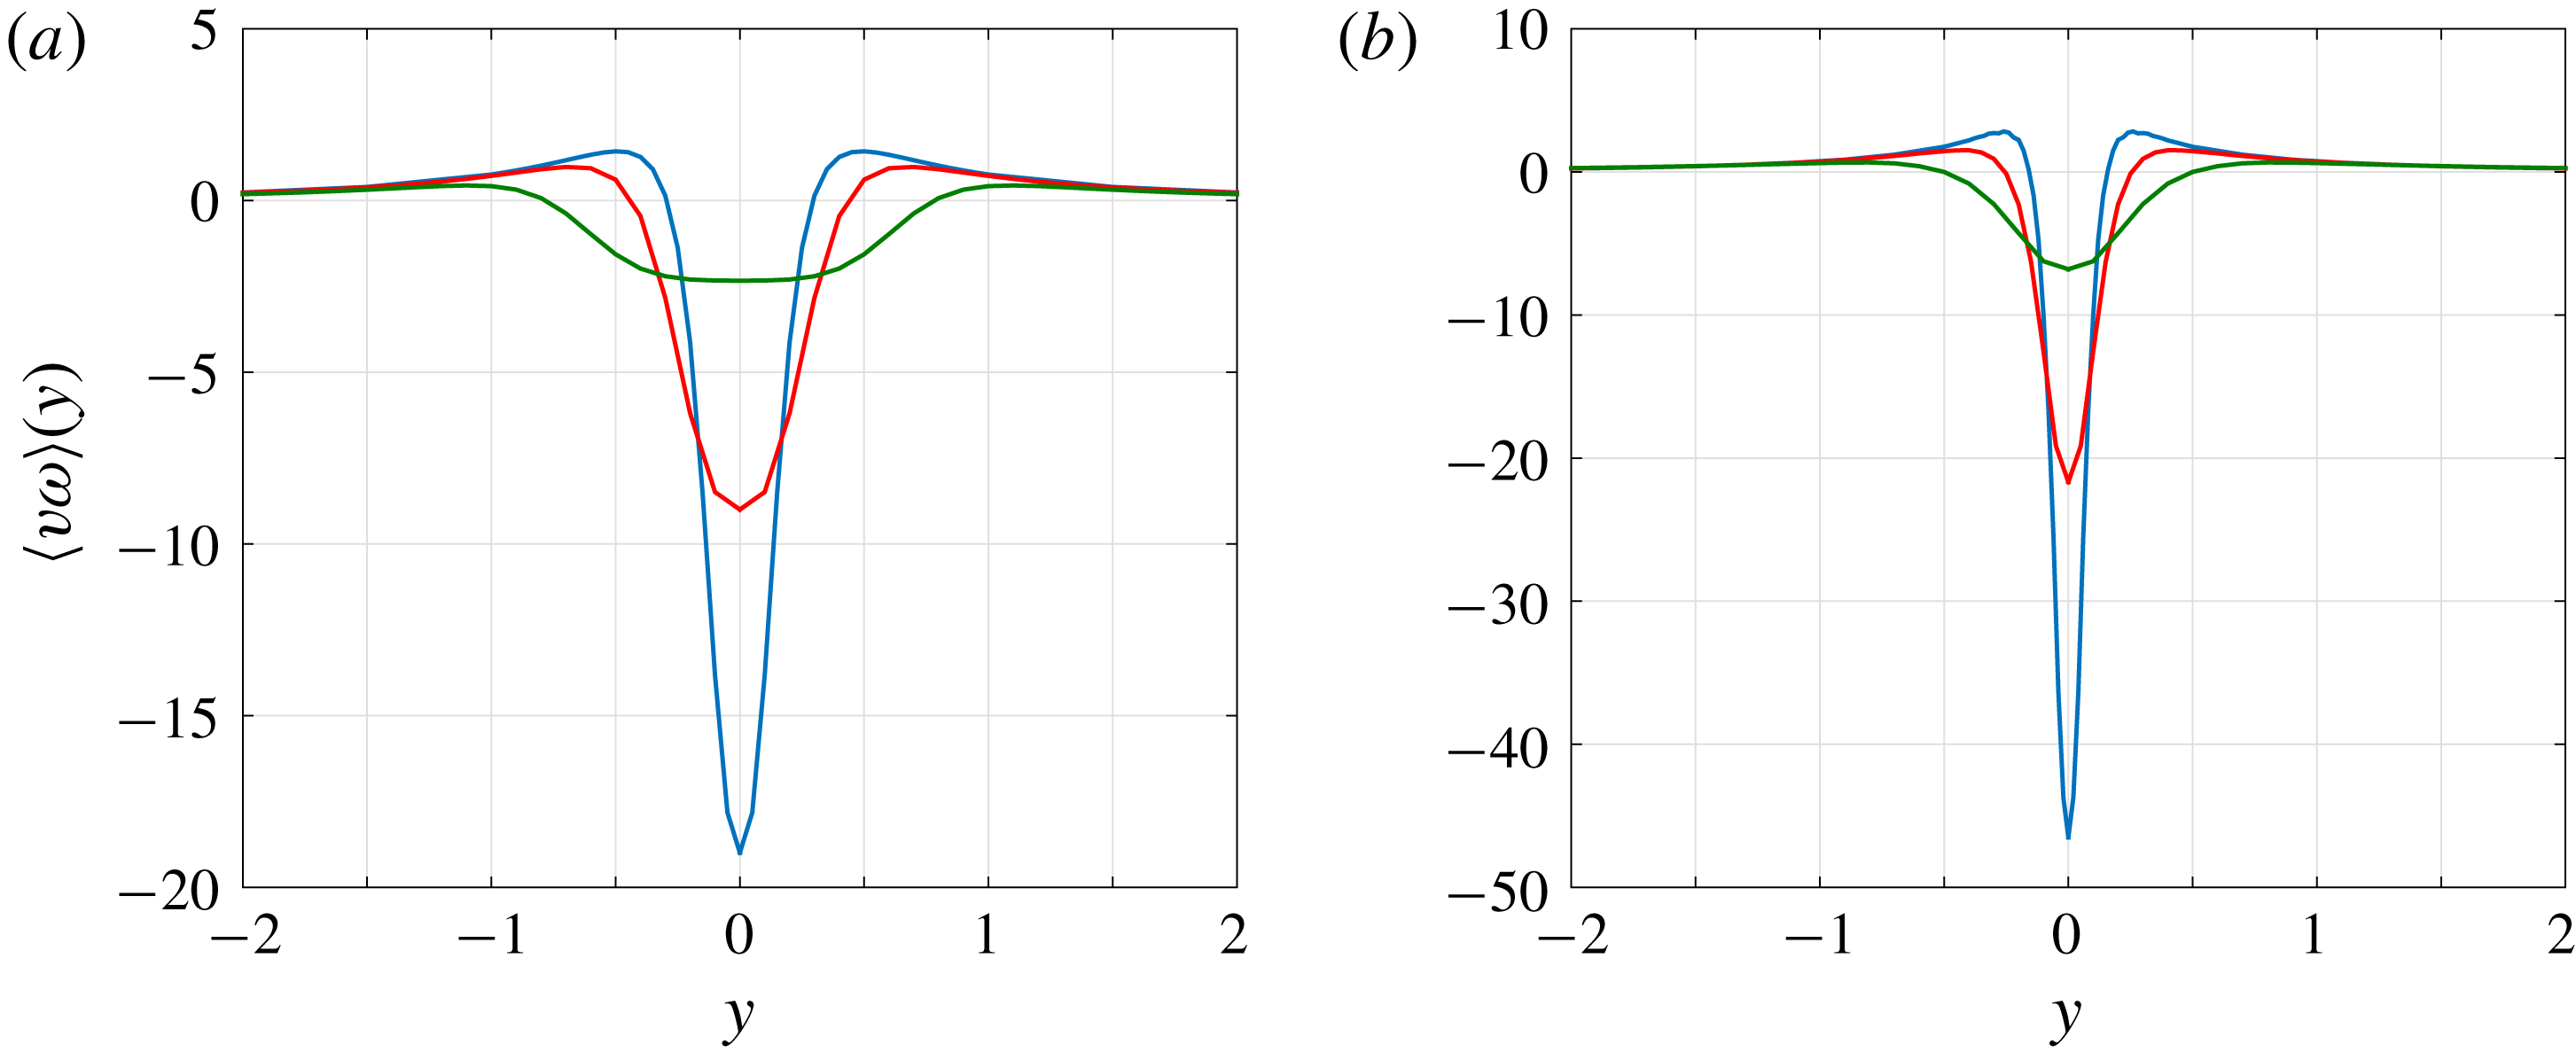
Reynolds stresses close to an eastward jet. (a) The Reynolds stress divergence
 $-\unicode[STIX]{x2202}_{y}\langle uv\rangle$
from (4.4) for a parabolic profile
 $\tilde{U} (y)=-y^{2}/2$
and
 $\unicode[STIX]{x1D703}=\unicode[STIX]{x03C0}/8$
(thick blue curve). The thin red curve depicts the theoretical asymptote
 $\tilde{U} ^{\prime \prime }/\tilde{U} ^{\prime 2}$
. As one can notice,
 $-\unicode[STIX]{x2202}_{y}\langle uv\rangle (0)=-1/\tilde{U} ^{\prime \prime }=1$
in agreement with the theoretical result (4.5). (b) The total Reynolds stress divergence resulting from the sum over
 $\unicode[STIX]{x1D703}\in [-\unicode[STIX]{x03C0}/3;\unicode[STIX]{x03C0}/3]$
. The Reynolds stress divergence has no universal expression in the intermediate region between the cusp (at
 $y=0$
) and the asymptotic region
 $y\gg 1$
. The cusp velocity profile has thus to be computed numerically using the particular shape of the force Fourier spectrum.

Let us illustrate those results by a numerical computation of the non-dimensional equations (4.4). The numerical computation goes the following way. We solve the first equation of (4.4), for given values of the Laplace transform parameter
 $\unicode[STIX]{x1D716}$
and the phase velocity
 $c$
, and given boundary conditions. We impose vanishing boundary conditions at infinity for
 $\unicode[STIX]{x1D719}_{\unicode[STIX]{x1D716}}$
. The value of
 $\unicode[STIX]{x1D716}$
has to be small because we want to compute the solution
 $\unicode[STIX]{x1D719}_{+}$
when
 $\unicode[STIX]{x1D716}$
goes to zero. Figure 4(a) has been obtained with
 $\unicode[STIX]{x1D716}=10^{-5}$
. Because the solution
 $\unicode[STIX]{x1D719}_{+}$
has a singularity at
 $U(y_{c})=c$
, an extreme precision is required to obtain convergence of the numerical calculations. To obtain the value of
 $\langle v\unicode[STIX]{x1D714}\rangle _{\unicode[STIX]{x1D703}}(y)$
, we have to compute the solution
 $\unicode[STIX]{x1D719}_{+}$
for
 $c=y^{2}/2$
, and this has to be done for each value of
 $y$
. On figure 4(a), approximately 20 values of
 $y$
were used to plot the thick blue curve.
The plot of the Reynolds stress divergence in figure 4 clearly displays two regions with a sharp transition (located around
 $y=2$
in the figure). In the first region, the mean velocity profile forms a cusp, which joins continuously the second region of large
 $y$
values. The second region corresponds to the domain where the expression
 $\langle v\unicode[STIX]{x1D714}\rangle =-U^{\prime \prime }/U^{\prime 2}$
is valid. The velocity profile joining the cusp to the asymptotic profile of figure 2 is non-universal with respect to the forcing spectrum. In figure 4(b), we plot
 $-\unicode[STIX]{x2202}_{y}\langle uv\rangle$
for a uniform forcing spectrum in the range
 $\unicode[STIX]{x1D703}\in [-\unicode[STIX]{x03C0}/3;\unicode[STIX]{x03C0}/3]$
.
With the system of equations (4.4), we have been able to show that a cusp of typical size
 $1/K$
forms at the eastward extremum of the jet. This cusp regularizes the velocity profile at its maximum and stops the divergence observed in figure 2. The relation between the curvature of the jet at the extremum and its maximal velocity (4.8) is universal as it does not involve the explicit expression of the spectrum of the stochastic force. However, the exact velocity profile joining the cusp to the asymptotic profile of figure 2 is rather complicated and is not at all universal.
5 Computation of Reynolds stress divergence for westward jets
As explained in § 4, the parameter
 $\unicode[STIX]{x1D6FD}$
disappears from the equations when we try to compute the equilibrium profile in the small-scale forcing limit
 $K\rightarrow \infty$
, because the
 $\unicode[STIX]{x1D6FD}$
-effect becomes irrelevant at the scale
 $1/K$
. Using this approach, we could expect the jet to be symmetric with respect to the transformation
 $U\rightarrow -U$
. At a formal level, nothing in (3.12) nor (4.4) seems to make any difference between the eastward and the westward parts of a jet. However, a look at the jets observed on Jupiter shows a clear asymmetry between eastward and westward jets, especially at high latitudes. One key point is that, as clearly stated, the previous sections assume that the linearized equations close to the jet are stable, and do not sustain neutral modes.
On Jupiter’s jets, cusps only exist on the eastward part, whereas the westward part looks like a parabolic profile with curvature between
 $2\unicode[STIX]{x1D6FD}$
and
 $3\unicode[STIX]{x1D6FD}$
(see figure 5 and Ingersoll et al. (Reference Ingersoll, Beebe, Mitchell, Garneau, Yagi and Müller1981) for a discussion on the value of the curvature). Numerical simulations of the barotropic model also show this asymmetry. In Constantinou (Reference Constantinou2015), for example, the curvature at the eastward jet is almost exactly
 $\unicode[STIX]{x1D6FD}$
and seems to be trapped at this value however large the coefficients
 $K$
and
 $1/\unicode[STIX]{x1D6FC}$
are. The value of
 $\unicode[STIX]{x1D6FD}-U^{\prime \prime }$
is always positive, and the Rayleigh–Kuo criterion for jet stability is satisfied. The aim of this section is to understand the behaviour of a parabolic jet with
 $U^{\prime \prime }$
close to
 $\unicode[STIX]{x1D6FD}$
and to see if the profile
 $\unicode[STIX]{x1D6FD}(y^{2}/2)$
can or cannot be a stationary solution of the barotropic model (2.2).
(a) Zonal jets on Jupiter. Data collected by Galileo and Cassini (from Porco et al.
Reference Porco, West, McEwen, Del Genio, Ingersoll, Thomas, Squyres, Dones, Murray and Johnson2003). (b,c) A numerical simulation of the quasi-linear barotropic equations (S3T system) performed in Constantinou (Reference Constantinou2015). Panel (b) displays the mean velocity profile
 $U$
and panel (c) displays
 $\unicode[STIX]{x1D6FD}-U^{\prime \prime }$
. The cusp is obvious on both panels; the peak on (c) corresponds to the eastward extremum of the jet. The value of
 $\unicode[STIX]{x1D6FD}-U^{\prime \prime }$
is always positive, thus satisfying the Rayleigh–Kuo criterion, except possibly at the westward extremum.

5.1 Modified Rossby waves
We consider in (3.1) a parabolic profile
 $U(y)=\unicode[STIX]{x1D6FE}(y^{2}/2)$
, and we want to study the behaviour of the Reynolds stress divergence when
 $\unicode[STIX]{x1D6FE}$
is close to
 $\unicode[STIX]{x1D6FD}$
. For
 $\unicode[STIX]{x1D6FE}=\unicode[STIX]{x1D6FD}$
, any perturbation is carried freely by the mean flow, and (2.16) reduces to
 $$\begin{eqnarray}\unicode[STIX]{x2202}_{t}\unicode[STIX]{x1D714}+\text{i}kU\unicode[STIX]{x1D714}=0,\end{eqnarray}$$
which is easily solved by
 $\unicode[STIX]{x1D714}(y,t)=\unicode[STIX]{x1D714}(y,0)\text{e}^{-\text{i}kUt}$
. Expression (2.17) is then singular, because
 $U^{\prime \prime }-\unicode[STIX]{x1D6FD}$
vanishes in the denominator, and
 $|\unicode[STIX]{x1D714}^{\infty }|^{2}-1=|\unicode[STIX]{x1D714}(y,0)|^{2}-1=0$
. If we try to compute directly the Reynolds stress divergence
 $\langle v\unicode[STIX]{x1D714}\rangle$
, we will find a singularity at
 $y=0$
. Therefore, the aim is to compute
 $\langle v\unicode[STIX]{x1D714}\rangle$
for
 $\unicode[STIX]{x1D6FE}$
smaller and larger than
 $\unicode[STIX]{x1D6FD}$
and let then
 $\unicode[STIX]{x1D6FE}\rightarrow \unicode[STIX]{x1D6FD}$
.
It was proved long ago that for
 $0<\unicode[STIX]{x1D6FE}<\unicode[STIX]{x1D6FD}$
we have modified Rossby waves in the flow (Drazin et al.
Reference Drazin, Beaumont and Coaker1982), with at least one Rossby wave as soon as
 $\unicode[STIX]{x1D6FE}<\unicode[STIX]{x1D6FD}$
. In Brunet (Reference Brunet1990), the case of a parabolic profile was thoroughly studied and a method was found to compute the Rossby waves and their velocity. Basically, it consists in doing a Fourier transform in
 $y$
and transforming the Rayleigh equation into a one-dimensional Schrödinger equation. The one-dimensional Schrödinger equation describes a particle in a potential vanishing at infinity. Possible bound states of the Schrödinger equation correspond to modified Rossby waves.
For
 $\unicode[STIX]{x1D6FE}>\unicode[STIX]{x1D6FD}$
, the Schrödinger equation potential is positive, and classical results prove that there is no bound state, and thus there are no Rossby waves. In that case, expression (2.17) will be valid to compute the Reynolds stress divergence. By contrast, for
 $0<\unicode[STIX]{x1D6FE}<\unicode[STIX]{x1D6FD}$
, the Schrödinger equation potential is negative (the position zero is attractive). Classical results (Reed & Simon Reference Reed and Simon1978) show that there exists at least one bound state. There is thus at least one modified Rossby wave. Moreover, as the potential deepens for decreasing
 $\unicode[STIX]{x1D6FE}/\unicode[STIX]{x1D6FD}$
, the number of bound states and thus the number of modified Rossby waves increases when
 $\unicode[STIX]{x1D6FE}/\unicode[STIX]{x1D6FD}$
decreases. When
 $0<\unicode[STIX]{x1D6FE}<\unicode[STIX]{x1D6FD},$
because of the presence of waves, we have to use expression (2.18) to compute the Reynolds stress divergence.
We discuss more precisely the existence of Rossby waves and their computation for a parabolic profile in appendix C.
5.2 Singularity of the Reynolds stress for a jet curvature close to
$\unicode[STIX]{x1D6FD}$

We now compute the Reynolds stress divergence
 $\langle v\unicode[STIX]{x1D714}\rangle$
using the same method as for the cusp case discussed in § 4, but without taking the limit
 $K\rightarrow \infty$
. It happens that the parabolic profile has an additional symmetry: it is invariant under the transformation
 $y\leftarrow Ky$
. For a parabolic profile, equation (3.1) depends only on the parameter
 $\tan \unicode[STIX]{x1D703}:=l/k$
and
 $\unicode[STIX]{x1D707}:=1-\unicode[STIX]{x1D6FD}/\unicode[STIX]{x1D6FE}$
. As discussed previously, Rossby waves appear when
 $\unicode[STIX]{x1D707}<0$
(equivalently for
 $0<\unicode[STIX]{x1D6FE}<\unicode[STIX]{x1D6FD}$
).
Using (3.1), (3.2) and (2.18), the self-consistent equations for the jet can be written as
 $$\begin{eqnarray}\left.\begin{array}{@{}c@{}}\left({\displaystyle \frac{\text{d}^{2}}{\text{d}y^{2}}}-\tan ^{2}\unicode[STIX]{x1D703}\right)\unicode[STIX]{x1D711}_{\unicode[STIX]{x1D716}}(y,c)-{\displaystyle \frac{\unicode[STIX]{x1D707}}{{\displaystyle \frac{y^{2}}{2}}-c-\text{i}\unicode[STIX]{x1D716}}}\unicode[STIX]{x1D711}_{\unicode[STIX]{x1D716}}(y,c)={\displaystyle \frac{{\mathcal{P}}\text{e}^{\text{i}\sin \unicode[STIX]{x1D703}\,y}}{{\displaystyle \frac{y^{2}}{2}}-c-\text{i}\unicode[STIX]{x1D716}}},\\ {\mathcal{P}}\text{e}^{\text{i}\sin \unicode[STIX]{x1D703}\,y}+\unicode[STIX]{x1D707}\unicode[STIX]{x1D711}_{+}\left(y,{\displaystyle \frac{y^{2}}{2}}\right)=w_{\unicode[STIX]{x1D703}}(y),\\ {\displaystyle \frac{1}{\unicode[STIX]{x1D707}}}[|(1-{\mathcal{P}})\text{e}^{\text{i}\sin \unicode[STIX]{x1D703}\,y}|^{2}+|w_{\unicode[STIX]{x1D703}}(y)|^{2}-1]={\displaystyle \frac{1}{\unicode[STIX]{x1D6FE}}}\langle v\unicode[STIX]{x1D714}\rangle _{\unicode[STIX]{x1D703}}[\tilde{U} ].\end{array}\right\}\end{eqnarray}$$
We have denoted by
 ${\mathcal{P}}$
the projector on the space orthogonal to the neutral modes.
Reynolds stresses close to a westward jet. (a) Minus the Reynolds stress divergence
 $\langle v\unicode[STIX]{x1D714}\rangle$
obtained for
 $\unicode[STIX]{x1D707}=0.3$
(green),
 $\unicode[STIX]{x1D707}=0.1$
(red) and
 $\unicode[STIX]{x1D707}=0.05$
(blue). When the parameter
 $\unicode[STIX]{x1D707}$
comes closer to zero, the divergence at
 $y=0$
becomes more and more pronounced. (b) Minus the Reynolds stress divergence for
 $\unicode[STIX]{x1D707}=-0.3$
(green),
 $\unicode[STIX]{x1D707}=-0.1$
(red) and
 $\unicode[STIX]{x1D707}=-0.05$
(blue). Other parameters are
 $\unicode[STIX]{x1D703}=\unicode[STIX]{x03C0}/8$
and
 $\unicode[STIX]{x1D6FD}=1$
.

The result of the numerical integration of (5.2) is shown in figure 6. The main result is that the stress
 $\langle v\unicode[STIX]{x1D714}\rangle$
has the same qualitative behaviour both for
 $\unicode[STIX]{x1D6FE}<\unicode[STIX]{x1D6FD}$
and for
 $\unicode[STIX]{x1D6FE}>\unicode[STIX]{x1D6FD}$
. For
 $\unicode[STIX]{x1D6FE}>\unicode[STIX]{x1D6FD}$
, i.e.
 $\unicode[STIX]{x1D707}>0$
, we still have the result that
 $w_{\unicode[STIX]{x1D703}}(0)=0$
, which implies that the stress
 $\langle v\unicode[STIX]{x1D714}\rangle$
is diverging as
 $-1/\unicode[STIX]{x1D707}$
when
 $\unicode[STIX]{x1D707}\rightarrow 0^{+}$
. For
 $0<\unicode[STIX]{x1D6FE}<\unicode[STIX]{x1D6FD}$
, i.e.
 $\unicode[STIX]{x1D707}<0$
, the stress is diverging as
 $[|\unicode[STIX]{x1D714}_{\unicode[STIX]{x1D703}}^{1}(0)|^{2}-1]/\unicode[STIX]{x1D707}$
when
 $\unicode[STIX]{x1D707}\rightarrow 0^{-}$
. Here
 $\unicode[STIX]{x1D714}_{\unicode[STIX]{x1D703}}^{1}$
is the projection of
 $\text{e}^{\text{i}\sin y}$
on the first neutral mode. It happens that
 $|\unicode[STIX]{x1D714}_{\unicode[STIX]{x1D703}}^{1}(0)|^{2}-1$
is always positive. Hence,
 $[|\unicode[STIX]{x1D714}_{\unicode[STIX]{x1D703}}^{1}(0)|^{2}-1]/\unicode[STIX]{x1D707}$
is negative. We conclude that, whatever the sign of
 $\unicode[STIX]{x1D707}$
, the stress
 $\langle v\unicode[STIX]{x1D714}\rangle$
has a negative divergence at the minimum of the jet that makes the jet grow.
If the curvature
 $\unicode[STIX]{x1D6FE}$
is smaller than
 $\unicode[STIX]{x1D6FD}$
, the effect of the Reynolds stress divergence is to narrow the jet and increase the curvature. When
 $\unicode[STIX]{x1D6FE}$
becomes larger than
 $\unicode[STIX]{x1D6FD}$
, the quasi-linear theory predicts that the jet should continue its growth, and form a cusp in exactly the same way as for the eastward jet. No mechanism in the quasi-linear dynamics can stop the growth of the westward jet. To explain the numerical simulations, we thus have to consider a hypothesis other than those considered so far. Among those, we have assumed that there is no hydrodynamic instability in the set of equations (5.2), i.e. a mode with non-zero imaginary part of the velocity. With
 $\unicode[STIX]{x1D6FE}>\unicode[STIX]{x1D6FD}$
the Rayleigh–Kuo criterion is violated, and the stability of a jet is no longer guaranteed. In the last section of this paper, we will study qualitatively the effect of an instability to see whether it can really stop the growth of the westward jet.
5.3 Hydrodynamic instability in the westward jet
An unstable mode is a solution of the homogeneous Rayleigh equation
 $$\begin{eqnarray}\left(\frac{\unicode[STIX]{x2202}^{2}}{\unicode[STIX]{x2202}y^{2}}-k^{2}\right)\unicode[STIX]{x1D713}+\frac{\unicode[STIX]{x1D6FD}-U^{\prime \prime }}{U-c}\unicode[STIX]{x1D713}=0,\end{eqnarray}$$
with complex phase speed
 $c$
. In particular, for unstable modes, the imaginary part satisfies
 $kc_{i}>0$
and the consequence is the exponential growth of a disturbance
 $|\unicode[STIX]{x1D713}(y,t)|\propto \text{e}^{kc_{i}t}$
. An unstable mode has a contribution to the Reynolds stress divergence. In the stationary state, the flow can only sustain unstable modes satisfying
 $kc_{i}<\unicode[STIX]{x1D6FC}$
, otherwise the exponential growth of the unstable mode would create a divergence in the Reynolds stress. If the flow sustains unstable modes, we have to modify expression (2.18) to take into account the presence of unstable modes. We do not report the computation; it is similar to the one developed in appendix A for neutral modes. Please note that, by contrast to neutral modes, the real part
 $c_{r}$
of the (complex) speed
 $c$
lies within the range of
 $U$
(Drazin et al.
Reference Drazin, Beaumont and Coaker1982; Drazin & Reid Reference Drazin and Reid2004). The contribution of an instability in the Reynolds stress has already been computed in the deterministic case (Pedlosky Reference Pedlosky1982, p. 576), and here we modify the classical result to adapt it to the stochastic case.
Let
 $\unicode[STIX]{x1D714}^{c}(y)$
be the projection of the initial condition
 $\text{e}^{\text{i}ly}$
on the unstable mode, and let
 $\unicode[STIX]{x1D713}^{c}$
be the associated streamfunction defined by
 $[(\unicode[STIX]{x2202}^{2}/\unicode[STIX]{x2202}y^{2})-k^{2}]\unicode[STIX]{x1D713}^{c}=\unicode[STIX]{x1D714}^{c}$
. The projection refers to the scalar product induced by the pseudo-momentum conservation law (see appendix A for the discussion). Then the dominant contribution of the unstable mode in the computation of
 $2\unicode[STIX]{x1D6FC}\langle |\unicode[STIX]{x1D714}|^{2}\rangle$
can be written as
 $$\begin{eqnarray}\displaystyle 2\unicode[STIX]{x1D6FC}\langle |\unicode[STIX]{x1D714}|^{2}\rangle & = & \displaystyle 2\unicode[STIX]{x1D6FC}\int _{-\infty }^{0}\text{d}t\,\text{e}^{2\unicode[STIX]{x1D6FC}t}|\unicode[STIX]{x1D714}^{c}(y)\text{e}^{\text{i}kct}|^{2}\end{eqnarray}$$
 $$\begin{eqnarray}\displaystyle & = & \displaystyle |\unicode[STIX]{x1D714}^{c}(y)|^{2}\frac{2\unicode[STIX]{x1D6FC}}{2\unicode[STIX]{x1D6FC}-2kc_{i}}.\end{eqnarray}$$
Equation (5.3) shows that
 $$\begin{eqnarray}\unicode[STIX]{x1D714}^{c}=-\frac{\unicode[STIX]{x1D6FD}-U^{\prime \prime }}{U-c}\unicode[STIX]{x1D713}^{c}.\end{eqnarray}$$
Equations (5.5) and (5.6) give the main contribution of a hydrodynamic instability to the Reynolds stress divergence,
 $$\begin{eqnarray}\frac{2\unicode[STIX]{x1D6FC}\langle |\unicode[STIX]{x1D714}|^{2}\rangle }{U^{\prime \prime }-\unicode[STIX]{x1D6FD}}=-\frac{2\unicode[STIX]{x1D6FC}}{2\unicode[STIX]{x1D6FC}-2kc_{i}}\frac{|\unicode[STIX]{x1D713}^{c}|^{2}}{|U-c|^{2}}(\unicode[STIX]{x1D6FD}-U^{\prime \prime }).\end{eqnarray}$$
Let us emphasize once more that this term is a contribution to the Reynolds stress adding to the other terms coming from the effect of neutral modes and from
 $\unicode[STIX]{x1D714}^{\infty }$
. The important point in (5.7) is that the coefficient
 $[2\unicode[STIX]{x1D6FC}/(2\unicode[STIX]{x1D6FC}-2kc_{i})]|\unicode[STIX]{x1D713}^{c}|^{2}/|U-c|^{2}$
is strictly positive, which means that the term coming from the unstable mode opposes a change of sign of
 $\unicode[STIX]{x1D6FD}-U^{\prime \prime }$
. In order to equilibrate, the jet needs to make a continuous barotropic adjustment of the mean flow curvature at the westward edge.
In order to illustrate this assertion, we consider a configuration where the instability develops. We perform a direct numerical integration of the equation
 $$\begin{eqnarray}\unicode[STIX]{x2202}_{t}\unicode[STIX]{x1D714}+\text{i}kU\unicode[STIX]{x1D714}+\text{i}k(\unicode[STIX]{x1D6FD}-U^{\prime \prime })\unicode[STIX]{x1D713}=0,\end{eqnarray}$$
using periodic boundary conditions in
 $y$
and the initial condition
 $\unicode[STIX]{x1D714}(y,0)=\text{e}^{\text{i}ly}$
. We use a Runge–Kutta algorithm of order four. The profile
 $U$
is parabolic with
 $0<\unicode[STIX]{x1D6FE}<\unicode[STIX]{x1D6FD}$
but we add a small disturbance at the extremum in 0 of the form of a Gaussian,
 $-\unicode[STIX]{x1D702}\text{e}^{-y^{2}/\unicode[STIX]{x1D70E}^{2}}$
. The disturbance mimics qualitatively the effect of the forcing described in figure 6; it models the fact that the mean velocity profile has a narrow curvature at its extremum,
 $$\begin{eqnarray}U(y)=\unicode[STIX]{x1D6FE}\frac{y^{2}}{2}-\unicode[STIX]{x1D702}\text{e}^{-y^{2}/\unicode[STIX]{x1D70E}^{2}}.\end{eqnarray}$$
The values of the chosen parameters are
 $\unicode[STIX]{x1D6FD}=1$
,
 $\unicode[STIX]{x1D707}=1-\unicode[STIX]{x1D6FD}/\unicode[STIX]{x1D6FE}=-0.3$
and
 $k=l=10$
. Here
 $\unicode[STIX]{x1D70E}$
quantifies the width of the disturbance (we choose
 $\unicode[STIX]{x1D70E}=0.1$
); and
 $\unicode[STIX]{x1D702}$
describes the magnitude of the disturbance, and is the control parameter of the simulation. The results are displayed in figure 7. The red curve is the graph of
 $\unicode[STIX]{x1D6FD}-U^{\prime \prime }(y)$
. When this quantity is strictly positive everywhere in the flow, the Rayleigh–Kuo criterion is satisfied and the flow is stable. With the velocity profile chosen in (5.9), the Rayleigh–Kuo criterion is violated around
 $y=0$
as displayed by the red curve in figure 7. The blue curve displays the quantity
 $|\unicode[STIX]{x1D714}(y,t)|^{2}-1$
at
 $T=30$
. In our simulations, we clearly see the three peaks of the blue curve growing exponentially with time, which indicates the existence of a hydrodynamic instability. From left to right, we have increased the value of the parameter
 $\unicode[STIX]{x1D702}$
. The larger
 $\unicode[STIX]{x1D702}$
, the more the Rayleigh–Kuo criterion is violated, and the faster the instability grows. It has already been emphasized that
 $|\unicode[STIX]{x1D714}|^{2}-1$
has to vanish at the same time where
 $\unicode[STIX]{x1D6FD}-U^{\prime \prime }=0$
in the flow, and this is confirmed by our simulation and displayed in figure 7. The largest peak of the blue curve corresponds exactly to the region in the flow where
 $\unicode[STIX]{x1D6FD}-U^{\prime \prime }$
is negative.
Instability growth for a perturbation of an unstable westward jet. We show here the tensor
 $|\unicode[STIX]{x1D714}|^{2}-1$
at
 $T=30$
for different values of
 $\unicode[STIX]{x1D702}$
, and we compute the value of
 $c$
whenever possible. The thin red curve shows
 $\unicode[STIX]{x1D6FD}-U^{\prime \prime }$
. Close to the instability threshold, it is no longer possible to determine the value of
 $c$
because the instability growth rate is too slow.

Unstable mode at the westward jet edge. (a) Real part (blue curve) and imaginary part (red curve) of the unstable mode
 $\unicode[STIX]{x1D714}^{c}$
. The value of
 $\unicode[STIX]{x1D702}$
is 0.05. The thin green curve displays
 $\unicode[STIX]{x1D6FD}-U^{\prime \prime }(y)$
; the Rayleigh–Kuo criterion is violated in the vicinity of zero. (b) The tensor
 $(|\unicode[STIX]{x1D714}|^{2}-1)/(U^{\prime \prime }-\unicode[STIX]{x1D6FD})$
that contributes to the Reynolds stress divergence obtained for
 $T=30$
. The artefact comes from the fact that
 $U^{\prime \prime }-\unicode[STIX]{x1D6FD}$
vanishes and that we use a finite discretization in
 $y$
. The effect of this tensor is to re-equilibrate the velocity
 $U$
to satisfy
 $\unicode[STIX]{x1D6FD}-U^{\prime \prime }>0$
. The value of
 $c$
is
 $c=(-2.02+1.04\text{i})\times 10^{-2}$
.

To obtain the mode
 $\unicode[STIX]{x1D714}^{c}(y)$
, we simply look at the convergence of
 $\unicode[STIX]{x1D714}(y,t)\text{e}^{\text{i}kct}$
. The real and imaginary parts of the unstable mode
 $\unicode[STIX]{x1D714}^{c}(y)$
are displayed in figure 8(a) in, respectively, blue and red. The curve
 $\unicode[STIX]{x1D6FD}-U^{\prime \prime }$
has been superimposed in green. We see again that the unstable mode is vanishing at points where
 $\unicode[STIX]{x1D6FD}-U^{\prime \prime }=0$
and that the mode is larger in the region where
 $\unicode[STIX]{x1D6FD}-U^{\prime \prime }<0$
. In figure 8(b) we display the Reynolds stress divergence
 $\langle v\unicode[STIX]{x1D714}\rangle =|\unicode[STIX]{x1D714}|^{2}-1/U^{\prime \prime }-\unicode[STIX]{x1D6FD}$
obtained from (2.17) with one single Fourier component. As can be checked directly in figure 8(b), the effect of the instability is exactly the opposite to that in figure 6. The Reynolds stress divergence is positive in the region where the Rayleigh–Kuo criterion is violated, and thus the tensor in figure 8 re-equilibrates the profile
 $U$
and damps the perturbation
 $-\unicode[STIX]{x1D702}e^{-y^{2}/\unicode[STIX]{x1D70E}^{2}}$
.
Let us summarize the results of the present section. We have first investigated the behaviour of the Reynolds stress divergence for a parabolic profile, because numerical simulations show that the mean velocity profile is almost parabolic for westward jets. The Reynolds stress divergence is the tensor that forces the mean flow according to (2.5). Even if we cannot always compute this tensor exactly, we can study its sign and its qualitative properties to see whether it damps the flow or not. We first made the assumption that there is no hydrodynamic instability in the flow. This assumption leads to a contradiction for the parabolic profile because the Reynolds stress divergence distorts the parabolic profile at
 $y=0$
as shown in figure 6. Thus, we conclude that another mechanism takes place to equilibrate the parabolic profile. When we consider a small violation of the Rayleigh–Kuo criterion near
 $y=0$
, we see numerically the growth of an instability that opposes exactly the distortion of the parabolic profile where the Rayleigh–Kuo criterion is violated. Those results are qualitative; we did not compute the equilibrium velocity profile. But it is consistent to assume that the equilibration mechanism is a kind of barotropic adjustment of the mean flow: an instability develops as soon as
 $\unicode[STIX]{x1D6FD}-U^{\prime \prime }$
changes sign. The flow has to adjust itself such that the instability is not too large, i.e. close to a parabolic profile with
 $U^{\prime \prime }\sim \unicode[STIX]{x1D6FD}$
, and such that the instability can be damped by linear friction.
6 Conclusion and perspectives
The stochastic barotropic
 $\unicode[STIX]{x1D6FD}$
-plane model is the simplest model in the hierarchy of models aiming at understanding jet formation in atmosphere dynamics. The precise structure of jets in this simple and fundamental model is still not really understood beyond a qualitative description and order-of-magnitude estimates, although thousands of papers have been written on the subject. In this paper we have proposed three main contributions to the theoretical understanding of these zonal jets to make progress in this direction. Our analytical results are valid when assuming both the inertial and the small-scale forcing limits. The inertial limit is valid when the time scales related to the inviscid dynamics (perfect transport, shearing and mixing, Rossby waves, and so on) are much smaller than the time scale for spin-up and spin-down (related to forcing and dissipation). In the stochastic barotropic model, this is quantified by a small value of the non-dimensional parameter
 $\unicode[STIX]{x1D6FC}=L\sqrt{r^{3}/\unicode[STIX]{x1D716}}$
. The limit of small-scale forces is relevant when the typical scale for the forcing,
 $1/K$
, is much smaller than the typical jet width, of the order of the Rhines scale. Those two limits are relevant, for instance, for the largest zonal jets of Jupiter.
With these two limits, the interaction between the large-scale zonal jets and the small-scale turbulence becomes local in physical space. The energy is transferred directly from its injection scale to the zonal jet through the direct interaction between the jet and turbulence. Our first contribution has been to justify the local formula
 $\langle uv\rangle =\unicode[STIX]{x1D716}/U^{\prime }$
. This formula could have been obtained directly taking the limit of small friction in the formula of Srinivasan & Young (Reference Srinivasan and Young2014), or by neglecting the nonlinear and pressure terms in the energy balance as done by Laurie et al. (Reference Laurie, Boffetta, Falkovich, Kolokolov and Lebedev2014) for the case of two-dimensional turbulence. Our justification is based on the double limit discussed in the previous paragraph. The mathematical difficulty resides in considering the inertial limit before the limit of small-scale forces. This order of the limits is necessary if one wants to deal with situations for which the dissipation mechanism is much smaller than the inertial one at the forcing scale, which is the case for most geophysical turbulent flows.
Because jets have non-monotonic velocity profiles, the asymptotic expansion and the formula
 $\langle uv\rangle =\unicode[STIX]{x1D716}/U^{\prime }$
break down at the jet edges where
 $U^{\prime }=0$
. The first naive computation of the velocity profile in the limit
 $K\rightarrow \infty$
leads to a divergence of the velocity at the extremum, and confirms that the dynamics may lead to several velocity sign reversals. For the asymptotic expansion to be valid, the parameter
 $KU^{\prime }/U^{\prime \prime }$
has to be large. At the eastward jet edges, we have established that the velocity profile is regularized by a cusp at a typical scale of
 $1/K$
. In the inertial limit
 $\unicode[STIX]{x1D6FC}\rightarrow 0$
, we have derived a system of equations that describes the cusp velocity profile. The resulting shape depends on the forcing spectrum. Nevertheless, the mechanism of depletion of vorticity at the stationary streamlines leads to an interesting relation between the curvature of the cusp and the maximal velocity (4.8), i.e.
 $U(y_{cr})U^{\prime \prime }(y_{cr})=-\unicode[STIX]{x1D716}K^{2}/r$
, which does not depend on the force spectrum but just on the energy injection rate
 $\unicode[STIX]{x1D716}$
.
As observed in previous numerical studies of the barotropic model, the westward jet edges have a curvature
 $U^{\prime \prime }$
of the order of
 $\unicode[STIX]{x1D6FD}$
in the inertial limit. Based on observations in numerical studies, the mechanism of barotropic adjustment has been discussed for this selection of the jet curvature (see e.g. Constantinou et al.
Reference Constantinou, Farrell and Ioannou2014). In the present work we have for the first time derived and analysed the equations that describe the westward jet edges in the inertial limit. This theoretical analysis confirms the mechanism of barotropic adjustment. Below the stability threshold, the Reynolds stress divergence forces the mean flow to grow. But as soon as the mean flow has a curvature
 $U^{\prime \prime }>\unicode[STIX]{x1D6FD}$
, a hydrodynamic instability opposes the growth of the velocity profile. Therefore, the parabolic profile is stabilized with a curvature fluctuating close to
 $\unicode[STIX]{x1D6FD}$
. The flow remains close to marginal stability.
Our work gives an overall picture of the equilibration mechanism and the stationary velocity profile of barotropic zonal jets. Our work can be considered as a theoretical derivation that the jet velocity profile is close to the ‘PV staircase’ in the inertial and small-scale forcing limit. The ‘PV staircase’ idea is closely related to the qualitative ideas of homogenization of PV first proposed by Rhines and Young, and can be justified qualitatively by equilibrium statistical mechanics. However, those qualitative ideas do not allow for clear predictions. In the context of barotropic jets and Jupiter jets, the ‘PV staircase’ empirical evidence or the ‘PV staircase’ assumption were discussed thoroughly by Dritschel & McIntyre (Reference Dritschel and McIntyre2008). For instance, Dritschel & McIntyre (Reference Dritschel and McIntyre2008) showed that the ‘PV staircase’ assumption allows one to derive straightforwardly the number and the size of jets in a flow configuration. One should bear in mind that the ‘stairs’ are an idealization of the real profile: the discontinuity in the staircase profile corresponds to the cusp at the eastward extremum. It has thus a finite width typically given by
 $1/K$
, where
 $K$
is the typical wavevector of small-scale energy injection. Besides, the ‘stairs’ are not perfectly flat, because the curvature of the jet is close to
 $\unicode[STIX]{x1D6FD}$
at the westward extremum, but not between the extrema. In the monotonic region between the extrema, the mean velocity profile is described by (3.14). The ‘PV staircase’ profile can thus be seen as a very good approximation; our theoretical approach gives a more precise mathematical description of the actual profile, which is valid within the asymptotic regime of inertial and small-scale forcing limit. Moreover, a given flow can sustain different numbers of jets (Constantinou et al.
Reference Constantinou, Farrell and Ioannou2014; Bakas & Ioannou Reference Bakas and Ioannou2014) for the same value of the parameter. This observation cannot be predicted either from the ‘PV staircase’ approximation or from the results we present in this work. Complementing this work, results in order to determine the correct number of and spacing between those jets is a challenging problem that might be addressed in the future.
Westward jets on Jupiter display a parabolic profile, but with a curvature
 $U^{\prime \prime }$
clearly larger than
 $\unicode[STIX]{x1D6FD}$
. This is one reason why the barotropic model is not sufficient to describe Jupiter’s atmosphere. We believe our analysis could be extended to more refined models, for example a two-layer model. The generalization of our analytical results for a two-layer quasi-geostrophic model would be a very interesting extension of this work. Another natural extension would be the study of rare transitions between states with a different number of jets, within the theoretical framework discussed in this paper.
Acknowledgements
We thank P. Ioannou for interesting discussion during the preliminary stage of this work. The research leading to these results has received funding from the European Research Council under the European Union’s Seventh Framework Programme (FP7/2007-2013 grant agreement no. 616811).
Appendix A. The Reynolds stress divergence in the inertial limit
The aim of this section is to give the proof of formulae (2.17) and (2.18). We have to compute
 $$\begin{eqnarray}2\unicode[STIX]{x1D6FC}\langle |\unicode[STIX]{x1D714}|^{2}\rangle =2\unicode[STIX]{x1D6FC}\int _{-\infty }^{0}\text{d}t\,\text{e}^{2\unicode[STIX]{x1D6FC}t}|\text{e}^{tL_{k}}[c_{l}]|^{2},\end{eqnarray}$$
where
 $\text{e}^{tL_{k}}[c_{l}]:=\unicode[STIX]{x1D714}_{d}$
is the solution to the deterministic equation
 $$\begin{eqnarray}\displaystyle \left.\begin{array}{@{}c@{}}\unicode[STIX]{x2202}_{t}\unicode[STIX]{x1D714}_{d}+\text{i}kU\unicode[STIX]{x1D714}_{d}+\text{i}k(\unicode[STIX]{x1D6FD}-U^{\prime \prime })\unicode[STIX]{x1D713}_{d}=0,\\ (\unicode[STIX]{x2202}_{y}^{2}-k^{2})\unicode[STIX]{x1D713}_{d}=\unicode[STIX]{x1D714}_{d},\end{array}\right\} & & \displaystyle\end{eqnarray}$$
with initial condition
 $c_{l}(y)=\text{e}^{\text{i}ly}$
. We will first assume there are no neutral mode solutions of (A 2). First, we make the change of time scale
 $2\unicode[STIX]{x1D6FC}t\rightarrow t$
in the integral of (A 1). This gives us
 $$\begin{eqnarray}2\unicode[STIX]{x1D6FC}\langle |\unicode[STIX]{x1D714}|^{2}\rangle =\int _{-\infty }^{0}\text{d}t\,\text{e}^{t}|\text{e}^{(t/2\unicode[STIX]{x1D6FC})L_{k}}[c_{l}]|^{2}.\end{eqnarray}$$
When
 $\unicode[STIX]{x1D6FC}$
goes to zero, the term
 $\text{e}^{(t/2\unicode[STIX]{x1D6FC})L_{k}}[c_{l}]$
is the long-time limit of the solution of (A 2). We use the non-trivial result for the case of non-monotonic flows of Bouchet & Morita (Reference Bouchet and Morita2010) already mentioned, namely that there exists a function
 $\unicode[STIX]{x1D714}_{d}^{\infty }(y)$
such that
 $\unicode[STIX]{x1D714}_{d}(y,t){\sim}_{t\rightarrow \infty }\unicode[STIX]{x1D714}_{d}^{\infty }(y)\text{e}^{-\text{i}kUt}$
when there are no neutral modes. Hence
 $|\text{e}^{(t/2\unicode[STIX]{x1D6FC})L_{k}}[c_{l}]|\rightarrow |\unicode[STIX]{x1D714}_{d}^{\infty }(y)|$
, and the presence of the exponential in the integral ensures the convergence of the whole. This proves that, without neutral modes,
 $$\begin{eqnarray}2\unicode[STIX]{x1D6FC}\langle |\unicode[STIX]{x1D714}|^{2}\rangle \underset{\unicode[STIX]{x1D6FC}\rightarrow 0}{\longrightarrow }|\unicode[STIX]{x1D714}_{d}^{\infty }|^{2}.\end{eqnarray}$$
The second case, with neutral modes, is a bit more subtle. The result of Bouchet & Morita (Reference Bouchet and Morita2010) relies on a Laplace transform of
 $\unicode[STIX]{x1D714}_{d}$
denoted
 $\hat{\unicode[STIX]{x1D714}}_{d}$
. To perform the inverse Laplace transform, one has to know where the singularities of
 $\hat{\unicode[STIX]{x1D714}_{d}}$
are. The presence of modes in the equation is exactly equivalent to the presence of poles of order 1 in the complex plane for
 $\hat{\unicode[STIX]{x1D714}}_{d}$
. For unstable modes, these poles have an imaginary part, whereas for neutral modes, they are located on the real axis. We also assume in our calculation that there are no instabilities, which means that all singularities of
 $\hat{\unicode[STIX]{x1D714}}_{d}$
are on the real axis. Some of these singularities are outside the range of
 $U$
(outside of [
 $U_{min},U_{max}$
]) and are isolated; they correspond to neutral modes or ‘modified Rossby waves’. But there is also a continuum of singularities all along the range of
 $U$
. The integration around the isolated singularities will give the contribution of neutral modes, and it is of the form
 $\sum _{a}\unicode[STIX]{x1D714}^{a}(y)\text{e}^{\text{i}kc_{a}t}$
, where
 $a$
is the mode index,
 $c_{a}$
is the mode frequency and the
 $\unicode[STIX]{x1D714}^{a}(y)$
are the projections of the initial condition
 $c_{l}$
on the modes
 $\unicode[STIX]{x1D701}^{a}(y)$
. The projections are defined with the natural scalar product induced by the pseudo-momentum conservation law, that is
 $\langle \langle \unicode[STIX]{x1D714}_{1}^{\ast }\unicode[STIX]{x1D714}_{2}\rangle \rangle =\int [\unicode[STIX]{x1D714}_{1}^{\ast }\unicode[STIX]{x1D714}_{2}/(U^{\prime \prime }-\unicode[STIX]{x1D6FD})]\,\text{d}y$
. For this particular scalar product, the operator
 $\unicode[STIX]{x1D714}\rightarrow U\unicode[STIX]{x1D714}+(\unicode[STIX]{x1D6FD}-U^{\prime \prime })\unicode[STIX]{x1D713}$
is self-adjoint, and this implies that its eigenvectors are orthogonal with respect to this scalar product. We subtract the contribution of the modes
 $\unicode[STIX]{x1D701}^{a}(y)$
from the initial condition
 $c_{l}$
, that is, we use
 $c_{l}-\sum _{a}\unicode[STIX]{x1D714}^{a}$
as initial condition in (A 2). We are left with the continuum part of the singularities and the result of Bouchet & Morita (Reference Bouchet and Morita2010) holds. As a consequence, there exists a function
 $\tilde{\unicode[STIX]{x1D714}}_{d}^{\infty }(y)$
such that the remaining part of the solution behaves at infinity like
 $\tilde{\unicode[STIX]{x1D714}}_{d}^{\infty }(y)\text{e}^{-\text{i}kU(y)t}$
. We eventually find that, for long time, the solution of the deterministic equation behaves like
 $$\begin{eqnarray}\unicode[STIX]{x1D714}_{d}(y,t)\underset{t\rightarrow \infty }{{\sim}}\mathop{\sum }_{a}\unicode[STIX]{x1D714}^{a}(y)\text{e}^{-\text{i}kc_{a}t}+\tilde{\unicode[STIX]{x1D714}}_{d}^{\infty }(y)\text{e}^{-\text{i}kU(y)t}.\end{eqnarray}$$
When we inject this result into the expression for
 $|\text{e}^{(t/\unicode[STIX]{x1D6FC})L_{k}}[e_{l}]|^{2}$
, we get three different terms.
(i) Terms coming from the mode–mode contribution of the form
$\sum _{a}|\unicode[STIX]{x1D714}^{a}(y)|^{2}$
. The time integration is then trivial.(ii) The term coming from the continuum gives us immediately the contribution
$|\tilde{\unicode[STIX]{x1D714}}_{d}^{\infty }(y)|^{2}$
.(iii) What happens for terms of the form
$\unicode[STIX]{x1D714}^{a\ast }\tilde{\unicode[STIX]{x1D714}}^{\infty }\text{e}^{-\text{i}k(U-c_{a})t/\unicode[STIX]{x1D6FC}}$
and
$\unicode[STIX]{x1D714}^{a\ast }\unicode[STIX]{x1D714}^{b}\text{e}^{-\text{i}k(c_{b}-c_{a})t/\unicode[STIX]{x1D6FC}}$
? The frequencies
$(1/\unicode[STIX]{x1D6FC})k(U-c_{a})$
and
$(1/\unicode[STIX]{x1D6FC})k(c_{a}-c_{b})$
grow to infinity as
$\unicode[STIX]{x1D6FC}$
vanishes. We have an oscillating integral with frequency growing to infinity. It is a well-known result that such an integral decays asymptotically. The cross-terms give no contributions.


We have then proved the desired result that
 $$\begin{eqnarray}2\unicode[STIX]{x1D6FC}\langle |\unicode[STIX]{x1D714}|^{2}\rangle \underset{\unicode[STIX]{x1D6FC}\rightarrow 0}{\longrightarrow }\mathop{\sum }_{a}|\unicode[STIX]{x1D714}^{a}|^{2}+|\tilde{\unicode[STIX]{x1D714}}_{d}^{\infty }|^{2}.\end{eqnarray}$$
Appendix B. Computation of the Reynolds stress in the inertial and small-scale forcing regime
In this appendix we prove that
 $$\begin{eqnarray}\text{Re}\langle v_{\unicode[STIX]{x1D703}}^{\ast }\unicode[STIX]{x1D714}_{\unicode[STIX]{x1D703}}\rangle \underset{\substack{ K\rightarrow \infty , \\ \unicode[STIX]{x1D6FC}\rightarrow 0}}{\rightarrow }\frac{U^{\prime \prime }}{U^{\prime 2}}.\end{eqnarray}$$
In § 3, we found the expression
 $$\begin{eqnarray}\text{Re}\langle v_{\unicode[STIX]{x1D703}}^{\ast }\unicode[STIX]{x1D714}_{\unicode[STIX]{x1D703}}\rangle \underset{K\rightarrow \infty }{{\sim}}-\frac{{\hat{C}}_{k,l}}{2k^{2}}{\mathcal{P}}\left\{\int \text{d}Y\,\text{e}^{-|Y|}\frac{\cos (Y\tan \unicode[STIX]{x1D703})}{U\left(y-{\displaystyle \frac{Y}{k}}\right)-U(y)}\right\}.\end{eqnarray}$$
This expression has no meaning for
 $y_{c}$
such that
 $U^{\prime }(y_{c})=0$
because we have a quadratic singularity in the integral. We therefore assume that
 $U^{\prime }(y)$
does not vanish. With this assumption we get
 $$\begin{eqnarray}\displaystyle & & \displaystyle {\mathcal{P}}\left\{\int \text{d}Y\,\text{e}^{-|Y|}\frac{\cos (Y\tan \unicode[STIX]{x1D703})}{U\left(y-{\displaystyle \frac{Y}{k}}\right)-U(y)}\right\}\nonumber\\ \displaystyle & & \displaystyle \quad =\lim _{\unicode[STIX]{x1D702}\rightarrow 0}\int _{-\infty }^{-\unicode[STIX]{x1D702}}\text{d}Y\,\text{e}^{-|Y|}\frac{\cos (Y\tan \unicode[STIX]{x1D703})}{U\left(y-{\displaystyle \frac{Y}{k}}\right)-U(y)}+\int _{\unicode[STIX]{x1D702}}^{+\infty }\text{d}Y\,\text{e}^{-|Y|}\frac{\cos (Y\tan \unicode[STIX]{x1D703})}{U\left(y-{\displaystyle \frac{Y}{k}}\right)-U(y)}\nonumber\\ \displaystyle & & \displaystyle \quad =\int _{0}^{+\infty }\text{d}Y\,\text{e}^{-|Y|}\cos (Y\tan \unicode[STIX]{x1D703})\left\{\frac{1}{U\left(y-{\displaystyle \frac{Y}{k}}\right)-U(y)}+\frac{1}{U\left(y+{\displaystyle \frac{Y}{k}}\right)-U(y)}\right\}\nonumber\\ \displaystyle & & \displaystyle \quad =\int _{0}^{+\infty }\text{d}Y\,\text{e}^{-|Y|}\cos (Y\tan \unicode[STIX]{x1D703})\left\{\frac{U\left(y-{\displaystyle \frac{Y}{k}}\right)+U\left(y+{\displaystyle \frac{Y}{k}}\right)-2U(y)}{\left(U\left(y-{\displaystyle \frac{Y}{k}}\right)-U(y)\right)\left(U\left(y+{\displaystyle \frac{Y}{k}}\right)-U(y)\right)}\right\}\nonumber\\ \displaystyle & & \displaystyle \quad \underset{k\rightarrow \infty }{\rightarrow }\frac{U^{\prime \prime }}{U^{\prime 2}}\int _{0}^{+\infty }\text{d}Y\,\text{e}^{-|Y|}\cos (Y\tan \unicode[STIX]{x1D703})=\frac{U^{\prime \prime }}{U^{\prime 2}}\frac{1}{1+\tan ^{2}\unicode[STIX]{x1D703}}.\end{eqnarray}$$
We have used the relations
 $$\begin{eqnarray}U\left(y-\frac{Y}{k}\right)+U\left(y+\frac{Y}{k}\right)-2U(y)\sim U^{\prime \prime }\frac{Y^{2}}{k^{2}}\end{eqnarray}$$
and
 $$\begin{eqnarray}\left(U\left(y-\frac{Y}{k}\right)-U(y)\right)\left(U\left(y+\frac{Y}{k}\right)-U(y)\right)\sim U^{\prime 2}\frac{Y^{2}}{k^{2}}.\end{eqnarray}$$
We thus have
 $$\begin{eqnarray}\text{Re}\langle v_{\unicode[STIX]{x1D703}}^{\ast }\unicode[STIX]{x1D714}_{\unicode[STIX]{x1D703}}\rangle \underset{K\rightarrow \infty }{{\sim}}-\frac{{\hat{C}}_{k,l}}{2k^{2}}\frac{U^{\prime \prime }}{U^{\prime 2}}\frac{1}{1+\tan ^{2}\unicode[STIX]{x1D703}}=-\frac{{\hat{C}}_{k,l}}{2K^{2}}\frac{U^{\prime \prime }}{U^{\prime 2}}.\end{eqnarray}$$
Finally, we use the power input relation
 ${\textstyle \frac{1}{2}}\!\iint \text{d}k^{\prime }\,\text{d}l^{\prime }\,({\hat{C}}_{k^{\prime },l^{\prime }}/K^{\prime 2})=1$
. When we integrate relation (B 6) over the whole spectrum, we get the desired result (B 1).
Appendix C. Modified Rossby waves
In this appendix, we discuss the neutral modes of parabolic jets
 $U(y)=\unicode[STIX]{x1D6FE}(y^{2}/2)$
. We first note that, for any parabolic jet,
 $U^{\prime \prime }-\unicode[STIX]{x1D6FD}$
does not change sign. Hence the Rayleigh–Kuo criteria is satisfied and the jet has no unstable modes.
For a mean velocity
 $U(y)=\unicode[STIX]{x1D6FE}(y^{2}/2)$
, we are looking for solutions of (2.16) of the form
 $\unicode[STIX]{x1D714}_{k}(y)\text{e}^{-\text{i}kct}$
. The equation can be written as
 $$\begin{eqnarray}-\text{i}kc\unicode[STIX]{x1D714}_{k}+\text{i}k\unicode[STIX]{x1D6FE}\frac{y^{2}}{2}\unicode[STIX]{x1D714}_{k}+\text{i}k(\unicode[STIX]{x1D6FD}-\unicode[STIX]{x1D6FE})H_{k}\ast \unicode[STIX]{x1D714}_{k}=0.\end{eqnarray}$$
We perform the Fourier transform
 $\hat{\unicode[STIX]{x1D714}}_{k}(l):=\int \text{d}y\,\unicode[STIX]{x1D714}_{k}(y)\text{e}^{-\text{i}ly}$
to obtain
 $$\begin{eqnarray}-\!\frac{1}{2}\frac{\text{d}^{2}}{\text{d}l^{2}}\hat{\unicode[STIX]{x1D714}}_{k}+\frac{\unicode[STIX]{x1D707}}{k^{2}+l^{2}}\hat{\unicode[STIX]{x1D714}}_{k}=\frac{c}{\unicode[STIX]{x1D6FE}}\hat{\unicode[STIX]{x1D714}}_{k},\end{eqnarray}$$
where
 $\unicode[STIX]{x1D707}:=1-\unicode[STIX]{x1D6FD}/\unicode[STIX]{x1D6FE}$
. We recognize the eigenvalue problem for a Schrödinger operator for a particle with potential
 $\unicode[STIX]{x1D707}/(k^{2}+l^{2})$
, a result already obtained by Brunet (Reference Brunet1990). Using classical results for this type of one-dimensional Schrödinger equation, we can immediately reach the following conclusions.
The first three neutral modes (modified Rossby waves) obtained for
 $\unicode[STIX]{x1D707}=-1$
. Even modes and odd modes alternate. The first mode vanishes only at infinity, and each new mode has an additional zero.

(i) There exists a solution
$\hat{\unicode[STIX]{x1D714}}_{k}$
in
$L_{2}$
if and only if
$\unicode[STIX]{x1D707}<0$
(attractive potential). In that case, the corresponding eigenvalue is negative, which implies that
$c/\unicode[STIX]{x1D6FE}<0$
. The condition
$\unicode[STIX]{x1D707}<0$
imposes already
$\unicode[STIX]{x1D6FE}>0$
, so the phase velocity of a Rossby wave is
$c<0$
and the wave is outside of the continuous spectrum. We find for this particular configuration the classical result that Rossby waves propagate with
$c<U_{min}$
.(ii) The number of modes
$n(|\unicode[STIX]{x1D707}|)$
increases with
$|\unicode[STIX]{x1D707}|$
, the depth of the potential well. Modes organize into continuous families
$\{\unicode[STIX]{x1D6FA}_{i}(|\unicode[STIX]{x1D707}|)\}_{1\leqslant i\leqslant n(|\unicode[STIX]{x1D707}|)}$
, with energies
$E_{i}(|\unicode[STIX]{x1D707}|)=c/\unicode[STIX]{x1D6FE}$
, when
$|\unicode[STIX]{x1D707}|$
is changed. Here
$E_{i}(|\unicode[STIX]{x1D707}|)$
are decreasing functions of
$|\unicode[STIX]{x1D707}|$
. The families
$\unicode[STIX]{x1D6FA}_{i}$
are alternately even and odd functions with a number of nodes that increases with
$i$
. A new set of modes appears for critical values
$\unicode[STIX]{x1D707}_{i}$
. For
$\unicode[STIX]{x1D707}=\unicode[STIX]{x1D707}_{i}$
, the mode of the new family has zero energy,
$E_{i}(|\unicode[STIX]{x1D707}_{i}|)=0$
.


To compute the eigenfunction of (C 2), for a given
 $\unicode[STIX]{x1D707}$
we use a bisection algorithm. We divide the interval
 $[\unicode[STIX]{x1D707},0]$
into sufficiently small intervals
 $[\unicode[STIX]{x1D70F}_{i},\unicode[STIX]{x1D70F}_{i+1}]$
and compute the solution of (C 2) with
 $c/\unicode[STIX]{x1D6FE}=\unicode[STIX]{x1D70F}_{i}$
. The solution diverges like an exponential at infinity, and when this divergence changes sign between
 $\unicode[STIX]{x1D70F}_{i}$
and
 $\unicode[STIX]{x1D70F}_{i+1}$
, it means that we have an eigenfunction in the interval, and we iterate the algorithm until
 $\unicode[STIX]{x1D70F}_{i+1}-\unicode[STIX]{x1D70F}_{i}$
is small enough. This way, we obtain the Fourier transform of a mode; we just have to invert the Fourier transform to get the mode in real space. Then we project
 $\text{e}^{\text{i}ly}$
on these modes with the standard scalar product on
 $L_{2}$
. Figure 9 displays the first three eigenfunctions obtained with
 $\unicode[STIX]{x1D707}=-1$
.