Background
Tracking and reporting antibiotic use are fundamental to antibiotic stewardship programs.1 Measuring antibiotic use aligns with core elements developed by the Centers for Disease Control and Prevention (CDC) to support antibiotic stewardship across all health care settings, including nursing homes.2 In 2016, the Centers for Medicare and Medicaid Services (CMS) introduced requirements for post-acute and long-term care (PALTC) settings to implement antibiotic stewardship programs, specifically calling for antibiotic protocols and a system to monitor antibiotic use.3 While the accompanying guidelines document suggested using either antibiotic days of therapy (DOT) or antibiotic starts per 1000 days of care (DOC) to summarize and monitor antibiotic use,4 the feasibility and suitability of these metrics to support antibiotic stewardship in PALTC settings is not clear.Reference Davidson and Jump5
The most common antibiotic use metric, DOT/1000 DOC, is well-suited for hospitals which employ pharmacists, data analysts, and sometimes infectious disease experts and typically have robust informatics systems and an onsite dispensing pharmacy. Few PALTC settings have these resources. Those with electronic health records may be able to generate monthly reports describing antibiotic DOT. Alternatively, they may be able to work dispensing pharmacies to obtain antibiotic DOT and/or starts. These data may require subsequent cleaning and analysis; personnel with these expertise are not readily available in most PALTC settings. Unless collected as part of routine infection surveillance activities,6 antibiotic starts must be carefully tabulated to avoid overestimating rates for agents that require multiple orders (ie, doses dispensed from a local emergency supply box or intravenous agents with a short shelf life).
While PALTC settings routinely determine their resident DOC, using this data as denominator to normalize antibiotic use rates may not sufficiently account for the operating characteristics of PALTC settings. The number of beds in most long-term care settings (mean of 106) is on par with that of small community hospitals and yields a small denominator (1000 DOC) compared to those for large hospitals.Reference Harris-Kojetin, Lendon, Rome, Valverde and Caffrey7,Reference Stenehjem, Hersh and Sheng8 As a result, modest changes in the numerator (DOT), such as might occur with a resident admitted to complete a long course of antibiotics for osteomyelitis, can lead to proportionally greater changes in the calculated rate of antibiotic use (DOT/1000 DOC) over time. These types of fluctuations can hinder data interpretation and make subsequent action challenging. Furthermore, DOC does not account for the increased rates of resident turnover at buildings with a higher proportion of short-stay beds. This is notable given that rates of antibiotic DOT/1000 DOC are about 10-fold higher for residents in short-stay compared to long-stay beds.Reference Kabbani, Wang and Ditz9 An additional concern with DOC is that while tracking census data for a unit or building is part of normal operations, DOC cannot be as easily be attributed or linked to an individual practitioner. This means that using DOT/1000 DOC to accurately compare antibiotic use among practitioners is not easily achieved. Given that differences in individual practice patterns, rather than residents’ clinical conditions, drive antibiotic use in PALTC settings,Reference Phillips, Adepoju and Stone10,Reference Daneman, Gruneir and Bronskill11 an antibiotic use metric that has the potential to offer practitioner-level feedback would align with the goal of tracking antibiotic use and using that data to support meaningful stewardship activities.
Our objective was to develop an antibiotic use metric specific to PALTC settings that would permit comparison among facilities as well as among practitioners practicing in the same facility. Here, we present two novel and feasible antibiotic use metrics, DOT/unique residents and antibiotic starts/unique residents, both of which are suitable to describe antibiotic use at facilities and among individual prescribers in PALTC settings. Pharmacy data from two distinct PALTC systems were used to ensure that both novel metrics capture both facility-level variability and system-wide trends over time in the same manner as DOT/1000 DOC.
Methods
Study design, settings, and data sources
We conducted a retrospective cohort study in two different PALTC networks to evaluate the two novel antibiotic use metrics (DOT/unique residents and antibiotic starts/unique residents). The first network, in which we derived the use metrics, compared them to the standard metric, and extended them to individual practitioners, included 13 facilities within a single community network with a shared pharmacy provider. All of the facilities offered both skilled nursing and long-term care services with prescribers that included physicians and nurse practitioners. The second network in which we validated the relationship between novel metrics and the standard metric, included 135 PALTC facilities, termed Community Living Centers (CLCs), within the Veterans Affairs health care system. CLCs share a common electronic health record with data, including those detailing medication administration and inpatient census data, exported into an enterprise-wide Corporate Data Warehouse (CDW). The Institutional Review Boards at the University of Pittsburgh and the VA Northeast Ohio Healthcare System approved the study protocol.
For the community PALTC network, we obtained census data and pharmacy dispensing data for January 1st 2020 – December 31st 2023. Monthly census data was available for 12 facilities throughout the entire four-year period, while data for one facility was available from October 2021 to December 2023. For VA CLCs, census and medication administration data were obtained from the CDW through the VA Informatics and Computing Infrastructure (VINCI). Obtained for validation purposes, we limited this data set to 2022. The community network pharmacy data set and CLC data set included the following elements: patient medical record number, medication, prescription number, dispensed or administered date, PALTC name, prescribing or ordering clinician, quantity dispensed, and days supply or days administered. We cleaned the data as previously described to include only systemic medications and identify antibiotic prescriptions.Reference Song, Wilson, Marek and Jump12,Reference Bej, Wilson, El Chakhtoura, Perez and Jump13 To include only prescribers who were active participants in resident care and prescribing that occurred within the PALTC (as opposed to acute care prior to PALTC admission), we limited both data sets to individuals who prescribed 1% or more of systemic medications at an individual facility. Monthly census data was linked by date and facility to the pharmacy data. For VA CLCs, where medications initiated in acute care are often cancelled and reordered by CLC practitioners upon CLC admission, we excluded prescriptions within the first 3 days of CLC admission as they were likely to have been initiated by non-CLC practitioners during the antecedent hospital stay.
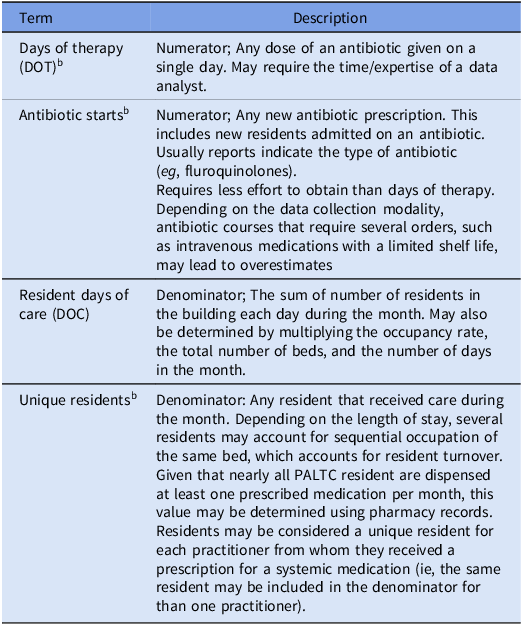
With these data, we derived new metrics at monthly intervals among all facilities in the network of community PALTCs: DOT per unique residents and antibiotic starts per unique residents (Table 1). The denominator, unique residents, includes the total number of individuals present at any time during the course of a month. We compared these to the standard DOT/1000 DOC metric across four years of data from the community PALTC network. Furthermore, to assess if the observed association was robust to a change in PALTC network that included differences in data sources, staffing models, and patient populations, we also calculated the novel metrics among the VA CLCs and compared them to the standard DOT/1000 DOC.
Description of components used to calculate antibiotic use metricsa

a Assessed at monthly intervals.
b Data may be extracted from the electronic health record. If this is not feasible, data may be obtained from the records or invoices of dispensing pharmacies.
Data analysis and statistical methods
Using dispensing pharmacy or inpatient drug administration data, we summarized the following parameters: number of medications prescribed, number of antibiotic courses prescribed (antibiotic starts), days of antibiotic therapy (DOT), and the number of individual residents issued a prescription for any medication (unique residents). Using this medication data alone, we calculated the two novel metrics at monthly intervals for each of the community PALTC buildings and VA CLCs.
Incorporating census data, we also calculated the standard antibiotic use metric, DOT/1000 DOC. We used Spearman’s rho to assess the correlation between the standard antibiotic use metric and two novel metrics, measuring the extent to which the standard and novel metrics agreed when ranking use values across months and facilities from lowest to highest. Additionally, we graphed all monthly use metrics by time for both community and VA PALTC networks and examined network-wide smoothed conditional means over time to visually compare time trends by use metric.
For the community PALTC facilities where pharmacy dispensing data included ordering prescriber, we also determined the DOT and antibiotics starts per unique residents cared for by individual prescribers. Residents were considered as a unique resident for each practitioner from whom they received a prescription for a systemic medication. Use metrics over time for practitioners within a facility were summarized with visualizations. All statistical analyses were performed using R (version 4.4; Vienna, Austria).
Results
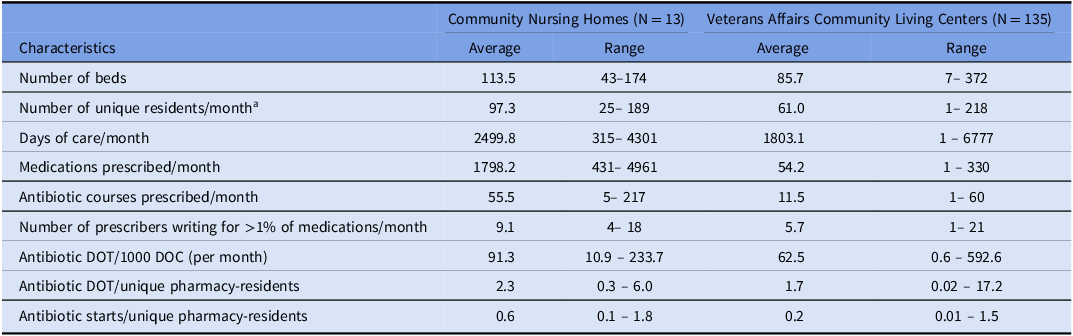
Among monthly intervals analyzed across 13 community PALTC settings between 2020 and 2023, an average of 9 (range 4–18) practitioners prescribed 1798 (431–4961) systemic medications to 97 (25–189) unique residents per facility-month (Table 2). Of those prescriptions, an average of 55 (5 – 217) were for antibiotics. The average facility antibiotic DOT/1000 DOC per month was 91 (11 – 234). Over the same period, the facility averages for antibiotic DOT/unique residents and antibiotic starts/unique residents were 2.28 (0.30 – 5.96) and 0.57 (0.12 – 1.83), respectively. The network-wide time trends observed in DOT/1000 DOC were also present in the novel metrics (Figure 1). When the monthly antibiotic DOT/1000 DOC, the standard metric, was compared to antibiotic DOT/unique residents from the 13 community PALTC (N = 603 facility-month data points) the Spearman correlation was 0.97 (P < 0.0001). The correlation between the standard metric and antibiotic courses/unique residents was 0.84 (P < 0.0001). To validate these findings we conducted a similar analysis among 135 VA CLCs using data from 2022 during which time the average number of unique residents/month based on pharmacy records was 61.0 (range 1–218). The monthly antibiotic DOT/1000 DOC had a Spearman’s rho of 0.96 (P < 0.0001) with monthly antibiotic DOT/unique residents and 0.85 (P < 0.0001) with antibiotic courses/unique residents (Figure S1).
Characteristics of post-acute and long-term care facilities

a Based on pharmacy records indicating medications dispensed to residents.
Comparison of three antibiotic use metrics among community PALTC buildings in the same network. Each dot represents one facility (n = 13) with each column representing 1 month. The line displays the smoothed conditional mean with the grey area showing 95% confidence interval. A. Days of Therapy (DOT)/1000 Days of Care (DOC). B. DOT/unique-residents. C. Antibiotic starts/unique residents. D. Correlation between the standard metric, DOT/1000 DOC and the novel metric DOT/unique residents; Spearman’s rho 0.97 (P < 0.0001). E. Correlation between DOT/1000 DOC and the novel metric Antibiotic starts/unique residents; Spearman’s rho 0.84 (P < 0.0001).

We used the two novel metrics to summarize antibiotic prescription rates among prescribers within the same community PALTC setting. The data visualization revealed that some prescribers showed consistent prescribing patterns over time, such as typically being below the 25th percentile, while others showed greater month to month variation (Figures 2 and S2).
Comparison of the rate of antibiotics prescribed by individual practitioners. Each row indicates the antibiotic use at a community PALTC buildings during 2023, with Days of Therapy/ unique residents and Antibiotic Starts/ unique residents in the left and right columns, respectively. The thick black bar indicates the median, with the surrounding boxes showing the interquartile range. Each colored dot represents a single practitioner. At Building 1 (A), the number of individual practitioners present during any given month ranged from 4 to 7. At Building 2 (B), the number of practitioners fluctuated from 3 to 6. At Building 3 (C), the number of practitioners per month never exceeded 4.

Discussion
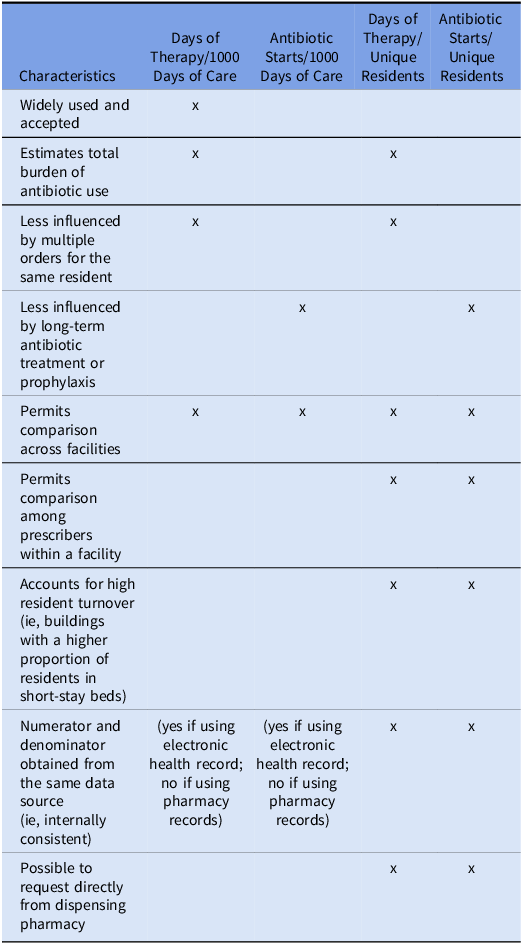
Our study found that two novel antibiotic use metrics, DOT/unique residents and antibiotic starts/unique residents, demonstrated strong correlation with the most widely accepted measurement, DOT/1000 DOC, when calculated at monthly intervals in a community PALTC network of 13 facilities (Table 3). Similar or higher correlations were observed in VA CLCs, a much larger PALTC network with different data structures, staffing models, and patient populations. This result suggests that the number of unique residents each month may be an appropriate normalizing factor for PALTC settings. As a denominator, the number of unique residents per month accounts for increased rates of resident turnover at buildings with a higher proportion of short-stay beds. An additional advantage to these novel metrics is that they may be used to compare antibiotic use among PALTC settings as well as among practitioners within a single building.
Comparison of antibiotic use metrics for post-acute and long-term care settingsa

a Measured at monthly intervals.
Per CMS requirements, antibiotic stewardship in PALTC settings is consigned to the infection prevention and control program, typically led by nurses with additional training in infection prevention.3 For an array of reasons, which can range from limited time to the overall institutional culture, even experienced infection preventionists may have limited success when addressing the antibiotic prescribing patterns of individual practitioners.Reference Carter, Montpetite and Jump14 Peer comparison proved an effective means to influence practitioners’ antibiotic-prescribing behavior in both PALTC and outpatient settings.Reference Meeker, Linder and Fox15,Reference Daneman, Lee and Bai16 Both of the novel antibiotic use metrics presented here can be used to provide feedback in the form of peer comparison in PALTC settings. Supplementary Appendix 1 provides examples of personalized feedback for practitioners who consistently prescribe antibiotics at rates higher and lower than their peers.
While census data provides accurate DOC for the building, attributing DOC to individual practitioners is more challenging. When prescriber-level census data was requested of the community PALTC network assessed here, only physicians had DOC attributed to them. Nurse practitioners accounted for zero DOC despite writing for 20% of total systemic prescriptions. Our analysis indicates that number of unique residents with any prescription from an individual practitioner in a given month offers a viable normalizing metric for measuring antibiotic use.
To determine the number of unique residents per month, PALTC settings may be able to extract the number of individual resident names or identifiers using information from their internal electronic health records. Alternatively, they may seek this from pharmacy records or invoices. Given that virtually all PALTC residents are dispensed at least one medication each month,Reference Jones, Dwyer, Bercovitz and Strahan17 pharmacy data may detail the DOT, antibiotic starts, and unique residents, meaning that nursing homes may be able to request both metrics from an internally consistent data source. Ideally, these data would be provided as regular reports and not pose an additional analytic burden.
Our study has limitations. First, for PALTC buildings with more than one pharmacy supplier, the analysis of aggregate pharmacy dispensing data can be challenging. Simplification of the data to the essential elements (medication name, DOT, resident name, practitioner name, date of prescription) may support merging data from more than one dispensing pharmacy. Second, feedback given to individuals working at PALTC sites with a limited number of practitioner (2-3 individuals) may be less successful. Circumstances may be such that individuals can make reasonable suppositions about their colleagues, which may lead unintended interprofessional consequences. Third, individual feedback at PALTC settings at which one practitioner is responsible for the majority of prescriptions may not engender practice change, as one person’s actions will align with the median. In these circumstances, facility-level comparisons are likely better suited to yield actionable feedback. Finally, our study does not account for prescriptions that might be mis-attributed. In many PALTCs, if a medication comes from the on-site emergency supply or if the practitioner is providing night or weekend coverage, antibiotic prescriptions may be attributed to the “House Doctor” or the medical director. Examination as to when these medications were prescribed, such as weekends or when the medical director is otherwise off duty, may yield additional insights into potential targets for antibiotic stewardship activities.
The novel antibiotic use metrics presented here have important implications for antibiotic stewardship in nursing homes, especially in relation to the CDC’s core elements of tracking and reporting antibiotic use.1 Assessment of antibiotic rates based on the number of unique residents for per month can offer valuable insight into antibiotic use in nursing homes (Antibiotic Use Metrics Calculator in Supplementary Material). Finally, visualization of individual practitioners’ antibiotic prescribing rates, as well as peer comparison, can lead to actionable feedback that helps improve antibiotic use in PALTC settings.
Supplementary material
The supplementary material for this article can be found at https://doi.org/10.1017/ice.2025.42
Acknowledgements
This work was supported by the Merck Investigator Studies Program (MISP 59266 to RJ and FP). This work was also supported in part by funds and facilities provided by the Geriatric Research Education and Clinical Center (GRECCs) at the VA Northeast Ohio Healthcare System in Cleveland, Ohio and the VA Pittsburgh Healthcare System in Pittsburgh, Pennsylvania. The findings and conclusions in this document are those of the authors, who are responsible for its content, and do not necessarily represent the views of the Department of Veterans Affairs or the U.S. Government.
Competing interests
None of the authors have relevant conflicts of interest to disclose. RJ and FP have research funding from Pizer, Merck, and Abacus. RJ has participated in advisory boards for Pfizer and Merck.