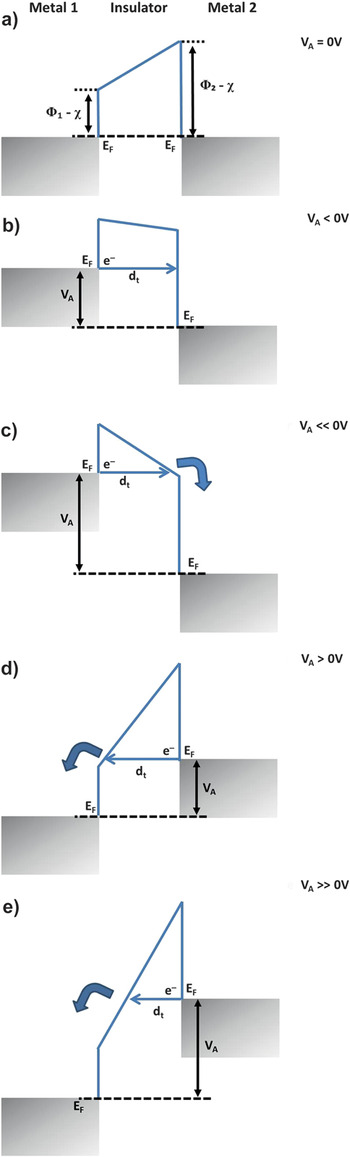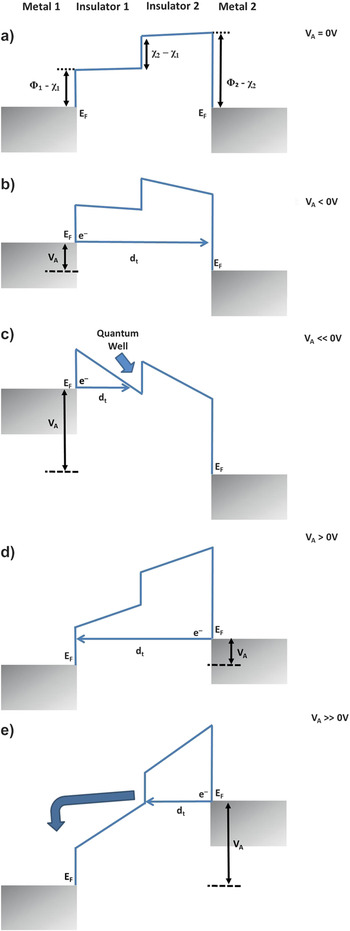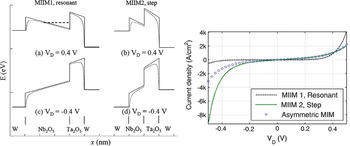


DISCUSSION POINTS
• Efficiency models for solar rectennas are controversial, predicting two extremes of efficiency values for this device. What should future work concentrate on?
• What is the optimal design for a successful rectenna device?
• What are the implications of successful rectenna implementation?
Introduction
The ever increasing global demand for clean renewable energy is a crucial topic that has major economic and societal impact for our future on this planet. The sun is a constant source of energy, thus better harvesting its radiation would solve the energy challenge and help protect the environment. Conventional solar harvesting is via the increasingly popular photovoltaic (PV) p–n junction solar cells. Although this field has seen great improvement over the last few decades since the first silicon solar cell was developed in 1941 at Bell Laboratories, its fundamental limitations discussed by Shockley and QueisserReference Shockley and Quiesser1 in 1961 put an upper boundary on the efficiency at around 30% for single-junction solar cellsReference Shockley and Quiesser1 and 55% for multi-junction solar cells.Reference Henry2 Due to the efficiency limits of solar cells, other solar-energy converting technologies are becoming increasingly attractive. An alternative solar energy converter concept is the rectenna (RECTifying antENNA) device, which has achieved very high efficiencies at microwave frequencies, while at terahertz frequencies, it has been speculated that efficiencies exceeding the Shockley–Queisser limit are achievable.
Fundamentally, the rectenna and the solar cell are similar as there is absorption of photons to generate a direct current (DC). However, there is a substantial difference in their principles of operation. Solar cells are quantum devices, except for their anti-reflection coatings, and are only able to be understood and designed by the application of quantum physics,Reference Corkish, Greem and Puzzer3 where light is perceived in its particle form, as photons. Hence, the efficiency is limited by the band gap energy of the active layers, where energy is lost due to low-energy photons passing right through the material, and through heat loss from the high-frequency photons. The rectenna device concept is different as it is based upon the wave nature of light, which is regarded as a propagating, oscillating electric and magnetic field.Reference Goswami, Vijayaraghavan, Lu and Tamm4 Similar to a low-pass filter in electronics, the efficient absorption of solar radiation is limited by the cut-off frequency of the device, i.e., any wavelength below this frequency can be harvested.
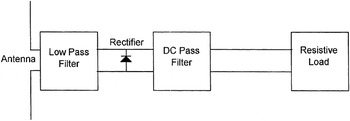
The components of the rectenna device are shown in Fig. 1. These components are commonly associated with a rectenna operating at microwave frequencies. The antenna is used to capture and convert the energy from an incoming microwave beam (or solar radiation in the case of solar rectenna) as it is an efficient transducer between free space and guided waves.Reference Berland5 The electric field (E) from an incident electromagnetic (EM) wave induces an alternating current (AC) in the conducting antenna. A low-pass filter is used to form an impedance match between the antenna and the rectifier, and passes the signal at the tuned operating frequency whilst blocking re-radiation of higher order harmonic energy produced by the rectifier.Reference Corkish, Greem and Puzzer3,Reference McSpadden, Fan and Chang6–Reference Razban, Bouthinon and Coumes8 The rectifier (a diode) converts the input AC signal to a usable DC which is transferred to the load. Most rectennas in the literature follow the Brown’s design of a single diode clamping circuit that ensures the voltage at the output terminal never goes negative. Following the clamping circuit is a DC-pass filter, used to smooth the rectified signal to DC whilst providing efficient transfer to the load. At very high frequencies a series inductor, rather than a circuit consisting of a shunt capacitor would be preferred as the DC filter element to prevent a short circuit and the associated reduction in efficiency.
Block diagram of microwave rectenna and load. (Reprinted from Ref. Reference Corkish, Greem and Puzzer3, ©2002 with permission from Elsevier).

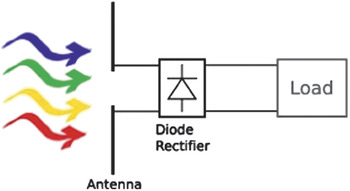
The antenna dimensions are of the same length scale as the targeted frequency.Reference Berland5 Therefore, for microwave frequencies, the antenna is relatively large (cm to mm scale) compared with that required for infrared (IR, μm scale) and optical frequencies (nm scale). Due to its smaller size, it will be difficult to incorporate the aforementioned filters into the design of a rectenna for solar energy collection. Therefore, the components of the solar rectenna are reduced to just the antenna and rectifier (Fig. 2).Reference Mlinar9 The removal of the low-pass filter from this design enables the broadband frequency harvesting up to the cut-off frequency of the device, although it introduces the difficulty of impedance matching the antenna and rectifier, resulting in a potential drop in efficiency. Losses in transferring the rectified DC signal to the load are dependent on the diode behavior. However, appropriate design of a DC-pass filter would make its use possible in this configuration.Reference Moddel and Grover10,Reference Zhu, Joshi, Pelz and Moddel11
Block diagram of solar rectenna and load. (Reprinted from Ref. Reference Mlinar9, ©IOP Publishing. Reproduced by permission of IOP Publishing. All rights reserved.)

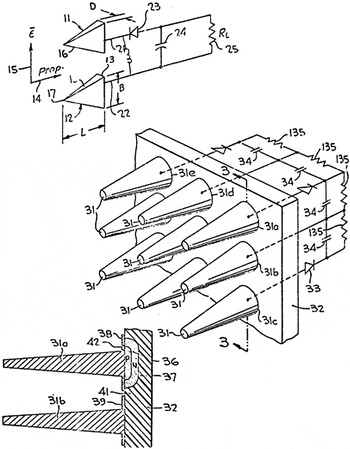
There are two families of designs for rectenna solar energy collectors. BaileyReference Bailey12 proposed that each antenna element is attached to its individual rectifier and the DC outputs are combined (see Fig. 3). The immediate concern here is that the small voltage predicted from the antenna elements may be insufficient for rectification to occur in the attached diode element.Reference Corkish, Greem and Puzzer3 The only way to overcome this is to design a diode which turns on at a voltage as low as that arising from the single antenna element. The other design is by Kraus,Reference Kraus16 who suggested that the electrical oscillations from many antenna elements be combined in a particular phase relationship, then delivered together to the rectifier. Limitations in this design arise from the need for spatial coherence across all the antenna elements feeding the signal to the diode.Reference Corkish, Greem and Puzzer3 This can be minimized by appropriate design and high quality fabrication of the antenna elements.
The EWEC concept by Fletcher and Bailey. Each broadband conical antenna is connected to a rectifying diode, filters, and load. (Reprinted from Ref. Reference Fletcher and Bailey13.)

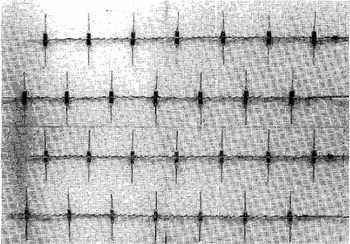
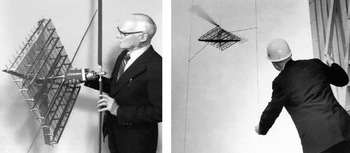
The first rectenna. Conceived at Raytheon Company in 1963, built and tested by R.H. George at Purdue University. It was composed of 28 half-wave dipoles, each terminated in a bridge rectifier made from four 1N82G point-contact, semiconductor diodes for operation at 2.45 GHz. A power output of 7 W was produced at 40% efficiency. (Reprinted from Ref. Reference Brown14, ©1984 IEEE. Reprinted, with permission, from IEEE.)

Left: W.C. Brown holding the rectenna helicopter platform. Right: In flight demonstration of the rectenna helicopter on October 1964. (Reprinted from Ref. Reference Brown15.)

The aim of this article is to review key research in the development of the rectenna device as an alternative or in addition to conventional solar cell technology. We aim to expand upon a few short reviews,Reference Corkish, Greem and Puzzer3–Reference Berland5,Reference Mlinar9,Reference Zhu, Joshi, Pelz and Moddel11,Reference Miskovsky, Cutler, Mayer, Weiss, Willis, Sullivan and Lerner17 that have been published, bringing the reader up to date with a more detailed overview of the device. This article will be the first to bring together all relevant research not only on the rectenna as a whole device, but also the research on its two main components – the antenna and the rectifier. The next section will briefly describe the history of the device and how the initial application of microwave power transmission (MPT) was later modified to a solar energy harvesting alternative. Section “Efficiency limits” will analyze and discuss the many publications on experimentally and theoretically derived device efficiencies. Breakthroughs in modeling and fabricating the antenna and rectifier will be reviewed in sections “Antenna” and “Rectifier”, respectively. Section “Rectenna design” will bring together all components and look at different rectenna architectures, which show potential for efficient operation at solar frequencies. We will discuss the socioeconomic impact of the research in this field and proposed future work in section “Socioeconomic impact and future work” before completing the article with a short summary in section “Summary”.
History of the rectenna device
The rectenna concept was initially proposed for wireless power transmission by William C. Brown of the Raytheon Company in the 1960s. At the time, Brown, a pioneer of MPT, was faced with a challenge of how to efficiently receive and convert to DC power an incoming microwave beam. Wireless power transmission was not a new concept as it had begun with the ideas and demonstrations by Tesla in 1899 using radio waves.Reference Hertz18 Tesla managed to demonstrate this concept although never found an applicable route into its commercialization.
In 1959, the Raytheon Company proposed the Raytheon Airborne Microwave Platform concept to the US Department of Defence as a solution to communications and surveillance problems.Reference Brown14 This proposed platform was to be flown at high altitude (50,000 ft) in the form of a helicopter, powered by microwave transmission. The US Department of Defence did not fund the project however the Raytheon Company pursued their interest by researching the required technological developments for its realization. One missing technology was a suitable microwave rectifier,Reference Okress19 capable of converting the microwave signal directly into the DC necessary to power the platform's motors and stay airborne. Their initial design used a horn-illuminated ellipsoidal reflector that focused the microwave beam into a trapezoidal horn at a 20 ft distance where the microwaves were converted to DC power by the rectifier.Reference Brown14 Using this first design, Brown constructed and flew 30 ft above his lawn a small tethered helicopter that he had built with his son in his own workshop.Reference Brown14 Although this concept worked, Brown was aware of the flaws in his system and continued to work on other possibilities.
In 1963, Brown met with his colleague and friend Roscoe George, a professor at Purdue University who had been working on a microwave point-contact semiconductor diode.Reference George and Okress20 Following discussions regarding his challenge, a device which is now known as “rectenna” was conceived. The proposed solution was patented in 1969 and consisted of taking individual full-wave rectifiers out of the waveguide, attaching them to half-wave dipoles, and placing a reflecting plate behind the structure.Reference Brown, George, Heenan and Wonson21 The first microwave rectenna was built by R.H. George at Purdue University but conceived at Raytheon Company in 1963, shown in Fig. 4. Later in 1964, Brown built a helicopter which had an array of 28 such rectennas. The helicopter was demonstrated in flight 60 ft above a transmitting microwave beam on the CBS Walter Cronkite News in October 1964. Figure 5 shows some impressive images of this historic event. The interested reader is referred to Brown's recollection on “The History of Power Transmission by Radio Waves” in Ref. Reference Brown14, where all the interesting details and facts about the invention of this device can be found.
Following this invention, MPT became very popular and many potential applications were researched. An interesting one is the solar power satellite (SPS), proposed by P.E. GlaserReference Glaser22 in 1968. The concept of the SPS represents a 5 GW power station on the geostationary orbit, which collects electrical power by means of solar cells and transmits microwaves of the 2.45 GHz band to a rectenna array site on the ground. The SPS project was researched by Brown and GlaserReference Brown23–Reference Glaser, Maynard, Macfcovciak and Ralph26 which earned Glaser a patent in 1973Reference Glaser27 and a collaborative three year project together with Brown in 1977 called the “DOE/NASA Satellite Power System Concept Development and Evaluation Program”. The work ended in 1980 with much success in developing new ideas in the design of transmission technology and rectenna arrays however did not attract further funding. Although this was the end of the SPS initiative in the US, some experimental studies of the concept were seen in the 1990s in Yamasaki, Japan.Reference Shimokura, Kaya, Shinohara and Matsumoto28,Reference Shinohara and Matsumoto29 The interested reader is referred to Glaser's overview of SPS progress in Ref. Reference Glaser30.
The developments from the SPS project yielded other applications involving microwave transmission and rectenna, such as intersatellite power transmission,Reference McSpadden, Little, Duke and Ignatiev31 including utility power satellites,Reference Yoo and Chang32 mechanical actuators for space-based telescopes,Reference Epp, Khan, Smith and Smith33 small dc motor driving,Reference Fujino, Ito, Fujita, Kaya, Matsumoto, Kawabata, Sawada and Onodera34 short-range power transfer as for example between two parts of a satellite, radio frequency identification tags (RFID), and biomedical implants.Reference Hagerty, Helmbrecht, McCalpin, Zane and Popović35 These applications all include single band rectenna operation. Hagerty et al.Reference Hagerty, Helmbrecht, McCalpin, Zane and Popović35 have shown a broadband rectenna array for microwave operation to be used in low-power indoor sensor networks and RF energy recycling. Recent publications have shown a compact printed rectenna that can be used to supply DC power to electrical devices supporting data communication systems.Reference Yang, Jiang, Elsherbeni, Yang and Wang36
The idea of exploiting the wave nature of light, or solar radiation, and converting its energy into usable DC by the use of antennas, originated as part of a NASA summer project in the late 1960s undertaken by J.C. Fletcher of NASA and R.L. Bailey of the University of Florida.Reference Goswami, Vijayaraghavan, Lu and Tamm4 The first official report of this concept was published by Bailey in 1972.Reference Bailey12 In this paper, he named his device the “electromagnetic wave energy converter (EWEC)” and suggested an artificial pyramid or cone structure as antennas, analogous to those found in nature and similar to dielectric rod antennas. The paper described pairs of pyramids as modified dipole antennas, each pair electrically connected to a half-wave rectifying diode, filter, and load. This invention is fundamentally very similar to the initial microwave rectenna proposed by Brown, but it is modified so that the antenna and rectifier operate at much high frequencies to harvest solar energy. The device called by Bailey EWEC is now referred to as a solar rectenna.
Bailey's first publication on the subject in 1972 served as a proof of concept as he showed the broadband characteristics of his pyramidal antennas by tests at 100–1000 MHz. Following this, in 1973, Fletcher and Bailey published a patentReference Brown15 on the EWEC concept. Later in 1975, in their final report, Bailey et al.Reference Bailey, Callahan and Zahn37 presented their theoretical work highlighting the importance of future research into optimized antenna design and fabrication, while not forgetting that rectification of the signal was an equally critical issue and a significant challenge.Reference Goswami, Vijayaraghavan, Lu and Tamm4 These two components of the rectenna solar energy harvester are now of equal research interest (see sections “Antenna” and “Rectifier”).
Later, alternative rectenna structures were proposed and patented by Marks,Reference Marks38–Reference Marks41 who was inspired by the earlier half-wave rectifier EWEC concept. His first patent in 1984 was a device with arrays of submicron crossed dipoles on an insulating sheet with fast full-wave rectifiers.Reference Marks38 Later in 1988, Marks was first to patent antenna-like cylinders attached to asymmetrical metal–insulator–metal (MIM) diodes for rectification.Reference Marks40 MIM diodes are one of the most promising rectifiers for use in IR and optical rectennas and will be later discussed (section “Rectifier: Metal–insulator–metal diodes”).
The first reported experimental evidence of a fabricated resonant nanostructure absorbing and rectifying at visible light frequency was published by Lin et al.Reference Lin, Abdu and Bockris42 in 1996. They recorded a short circuit current using a parallel dipole subnanostructures connected to a p–n junction for the rectification of the absorbed signal. Credit must be given also to Gustafson and BillmanReference Gustafson and Billman43 who first suggested harvesting visible radiation in 1974. Their work formed the basis of using optical diodes like the MIM diode.
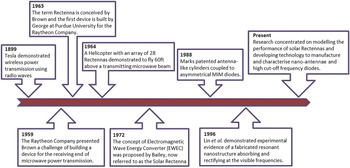
Figure 6 outlines a brief timeline of the key events that have lead to the current research activity in solar rectenna. Further reading is suggested in Refs. Reference Corkish, Greem and Puzzer3 and Reference Goswami, Vijayaraghavan, Lu and Tamm4 for a more detailed reference and explanation of the major historic breakthroughs in the field of solar harvesting by rectenna. In the following sections, we mainly focus on the key research in harvesting optical and IR frequencies using the rectenna concept.
Brief timeline of the rectenna device – from concept for microwave power transmission to research focused on solar harvesting.

Efficiency limits
The first rectenna device (Fig. 4), which was built in 1963, provided a 7 W power output with 40% efficiencyReference Brown14 designed to work at 2.45 GHz. This was the most commonly targeted transmitting frequency for MPT because of its low attenuation through the atmosphere even in severe weather and being at the center of the industrial, scientific, and medical (ISM) band meant that it was the most advanced and efficient transmitting technology.
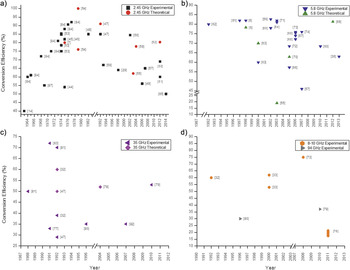
This rectenna used half-wave dipole antennas to receive the signal and point-contact semiconductor diodes for rectification. In later device attempts, the half-wave dipole antenna remained the preferred technology, but an increase in efficiency was mainly achieved by improving the rectifier performance, incorporating Schottky barrier diodes (SBDs). From the early 1960s until the early 1980s, there has been a steady increase in the experimentally demonstrated efficiency of the rectenna at 2.45 GHz [Fig. 7(a)]. Although NahasReference Nahas7 first developed a model (using a distributed transmission-line technique including skin-effect losses) to simulate the top performance of a rectenna utilizing a dipole antenna and a conventional SBD, his prediction of an 80% upper boundary (most of the losses came from the diode rectifier) was later improved when BrownReference Brown84 experimentally demonstrated what is to date, the highest ever recorded efficiency at the 2.45 GHz band of 92%. This was made possible by using the then well established Pt/GaAs Schottky diode and supported Brown's predictions that 100% efficiency is possible for this device.Reference McSpadden, Yoo and Chang47,Reference Brown84
Reported conversion efficiency (as defined by their authors) evolution over the years of a rectenna device for microwave power transmission. Data points are split into experimental and theoretically derived values of efficiency. (a) 2.45 GHz, (b) 5.8 GHz, (c) 35 GHz, and (d) 8–10 GHz and 94 GHz. [**] indicates the reference corresponding to the data point. Data collected from Refs. Reference Corkish, Greem and Puzzer3,Reference Berland5–Reference Nahas7,Reference Bailey12,Reference Brown14,Reference Kraus16,Reference Shinohara and Matsumoto29,Reference Yoo and Chang32,Reference Epp, Khan, Smith and Smith33,Reference Yang, Jiang, Elsherbeni, Yang and Wang36,Reference Strassner and Chang44–Reference Gutmann and Borrego54,Reference Heikkinen and Kivikoski55–Reference Strassner and Chang65,Reference Ali, Yang and Dougal66–Reference Yoo and Chang77,Reference Hong-Lei and Li78–Reference Brown84,Reference Brinster, Lohn and Linden85,Reference Brown87.

In another attempt to model the efficiency, Gutman and BorregoReference Gutmann and Borrego54 predicted an upper boundary of 85% incorporating numerous rectifier outputs interconnected to a common DC load. They used a closed-form analytical circuit model and a computer-simulation model in an attempt to show that a higher output power can be achieved having an array of these components as opposed to a single rectenna element.
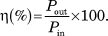
It is important to state that the conversion efficiencies (η) considered here are simply defined as the ratio of the output power (P out) over the power incident on the antenna (P in),
 $$\eta \left( \% \right) = {{P_{{\rm{out}}} } \over {P_{{\rm{in}}} }} \times 100.$$
One of the most successful demonstrations of MPT was in 1975 by Dickinson and BrownReference Dickinson and Brown45 who used an array of 5000 rectennas to receive a transmitted signal over a distance of one mile with 82% efficiency at 2.388 GHz.Reference Dickinson and Brown45,Reference Konovaltsev, Luchaninov, Omarov and Shokalo46 The rectenna architecture again contained half-wave dipole antennas. In the last two decades, many other antenna architectures have been proposed in search of enhanced performance and economical alternative. These include the microstrip patch,Reference McSpadden, Yoo and Chang47,Reference Zbitou, Latrach and Toutain49 circular polarized,Reference Heikkinen and Kivikoski55,Reference Ito, Fujino and Fujita58–Reference Gao, Yang, Jiang and Zhou60 compact slot ring,Reference Ren, Farooqui and Chang57 and shorted annular ring-slotReference Takhedmit, Cirio, Bellal, Delcroix and Picon50,Reference Heikkinen and Kivikoski55 antennas with all attempts returning efficiencies between 55 and 85% [see Fig. 7(a)]. The higher efficiencies reported all used GaAs Schottky diodes as opposed to conventional Si Schottky diodes, showing the importance of diode behavior on device performance.
In the 1990s, a renewed interest in the SPS conceptReference Glaser22–Reference Glaser30 started a new focus of research into high efficiency rectennas and rectenna arrays operating at higher frequency than the mid-ISM band (2.45 GHz).Reference Strassner and Chang44 With higher operating frequency, the device dimensions can be reduced conveniently from the point of SPS construction feasibility.Reference Strassner and Chang44 Also small size design can be appropriately implemented in a range of other applications such as a supply source in RFID,Reference Hagerty, Helmbrecht, McCalpin, Zane and Popović35,Reference Ren, Farooqui and Chang57,Reference Gao, Yang, Jiang and Zhou60,Reference Ali, Yang and Dougal66,Reference Fujimori, Tada, Ueda, Sanagi and Nogi70,Reference Chiou and Chen79 wireless sensors,Reference Hagerty, Helmbrecht, McCalpin, Zane and Popović35,Reference Takhedmit, Cirio, Bellal, Delcroix and Picon50,Reference Gao, Yang, Jiang and Zhou60,Reference Chiou and Chen79 and data communication systems.Reference Yang, Jiang, Elsherbeni, Yang and Wang36,Reference Suh, Wang and Chang63,Reference Ali, Yang and Dougal66,Reference Ali, Yang and Dougal67,Reference Yang, Jiang, Elsherbeni, Yang and Wang69,Reference Chiou and Chen79 Rectennas operating in the C-band [≈5.8 GHz, Fig. 7(b)], X-band [8–10 GHz, Fig. 7(d)], Kα-band [35 GHz, Fig. 7(c)], and W-band [94 GHz, Fig. 7(d)] have appeared after the 1990s, some even operating in two bands (2.45 and 5.8 GHzReference Heikkinen and Kivikoski55–Reference Ren, Farooqui and Chang57 and 35 and 94 GHzReference Chiou and Chen79). However, the efficiency is different in the two frequency bands with the higher frequency operation yielding lower efficiency due to losses in transferring the AC signal generated from the antenna to the rectifier circuit. The only dual frequency rectenna with high efficiency in both bands is reported by Suh and ChangReference Suh and Chang56 with an excess of 82% efficiency at both 2.45 and 5.8 GHz using a CPS dipole antenna and GaAs SBD.
At 5.8 GHz, efficiency values in the range of 60–85% have been both predictedReference McSpadden, Fan and Chang6,Reference Suh, Wang and Chang63,Reference Yang, Jiang, Elsherbeni, Yang and Wang69,Reference Fujimori, Tada, Ueda, Sanagi and Nogi70 and demonstratedReference McSpadden, Fan and Chang6,Reference Yang, Jiang, Elsherbeni, Yang and Wang36,Reference Suh and Chang56,Reference McSpadden, Fan and Chang61–Reference Strassner and Chang65,Reference Ali, Yang and Dougal67,Reference Ren and Chang68,Reference Strassner and Chang71–Reference Tu, Hsu and Chang74 with different approaches returning equally successful devices through the years [Fig. 7(b)]. The few experimentally reported rectennas at 8–10 GHz have seen slight improvement in efficiency when a circular or dual polarized printed patch antenna has been coupled to the GaAsReference Yoo and Chang32,Reference Epp, Khan, Smith and Smith33 or SiReference Xuexia, Junshu, Deming and Changlong75 Schottky diode, however with a planar slot antennaReference Monti, Tarricone and Spartano76 the efficiency is only 21.2% [Fig. 7(d)]. At 35 GHz [see Fig. 7(c)], theoretical predictions are higher than their corresponding experimental results,Reference Yoo and Chang32,Reference McSpadden, Yoo and Chang47 although with a similar antenna and diode design, high experimental efficiency of 70% has been reported elsewhere.Reference Koert and Cha81,Reference Koert, Cha and Macina83 Analysis of the different efficiencies achieved with similar rectenna technologies highlights the importance in the circuit and device design for rectennas used in MPT. Furthermore, load impedance and the power of the incoming beam also affect the overall efficiency of the device.
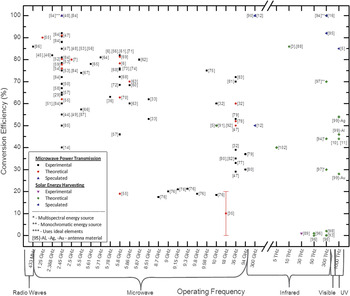
It can be noticed from Fig. 7 that for a given frequency some models predict a lower efficiency than that which had already been experimentally achieved. The reason is that over the years, new antenna and rectifier technologies, and alternative, more compact circuit designs were emerging, which could not improve or even match the record efficiency achieved with the half-wave dipole antenna and Pt/GaAs SBD. Furthermore, scaling down the components and aiming toward higher frequency operation at lower cost, introduced difficulties for appropriate circuit design and the efficiency suffered a continuous drop. Overall, considering the evolution of reported efficiencies over the years (Fig. 7) for MPT rectennas, it can be concluded that with appropriate antenna design, good matching to a suitable well-functioning diode rectifier connected to a DC load, experimental evidence of efficiencies over the 70% mark can be obtained for frequencies up to 35 GHz (see also Fig. 8).
Reported conversion efficiencies (as defined by their authors) at their maximum operating frequency of a rectenna device. Data points are grouped by the two applications of the rectenna – either microwave power transmission or solar energy harvesting, each displaying experimental, theoretical, or speculated efficiency values. [**] indicates the reference corresponding to the data point. Data collected from Refs. Reference Corkish, Greem and Puzzer3,Reference Berland5–Reference Razban, Bouthinon and Coumes8,Reference Moddel and Grover10–Reference Bailey12,Reference Brown14,Reference Kraus16,Reference Shinohara and Matsumoto29,Reference Yoo and Chang32,Reference Epp, Khan, Smith and Smith33,Reference Hagerty, Helmbrecht, McCalpin, Zane and Popović35,Reference Yang, Jiang, Elsherbeni, Yang and Wang36,Reference Strassner and Chang44–Reference Chiou and Chen79,Reference Pinhasi, Yakover, Eichenbaum and Gover80–Reference Stefanakos, Goswami and Bhansali102.

The high efficiencies achieved at the low gigahertz frequencies are due to the ease of fabricating the devices and designing appropriate filters (low pass and DC pass – see Fig. 1). To be able to receive a signal, the antenna has to be of the same length scale as the wavelength of the incoming wave, which at the low gigahertz frequencies ranges from a few millimeter to tens of centimeter. At IR and optical frequencies, wavelengths are from micrometer to nanometer, which subsequently indicate the necessity of building the antenna and rectifier in this length scale range. At this scale, a direct impedance match of the antenna to rectifier has to be achieved (Fig. 2) instead of using a low-pass filter, which cannot be designed at such small dimensions. This is what Bailey's proposed electromagnetic wave energy converterReference Bailey12 implies – a scaled down version of Brown's rectenna consisting of a micrometer length antenna connected directly to the diode rectifier transferring the output to the load through a DC-pass filter of some sort. Bailey predicted an efficiency in excess of 50% for his EWEC device at microwave frequencies, although not backed by any modeling or experimental evidence of a whole device. The only evidence he gives is the ability of an EWEC prototype to absorb electromagnetic plane polarized waves at 475 MHz. His vision was to study the concept at microwaves and later scaling it to light frequencies where he speculates potential for unity efficiency. A MPT rectenna device without a low-pass filter is possible and was demonstrated in 2012 at 2.45 GHz.Reference Takhedmit, Cirio, Bellal, Delcroix and Picon50 The proposed printed shorted annular ring-slot rectenna is designed to match the impedance of the SBD rectifier at 2.45 GHz. The diode however will produce the second and the third order harmonics which will re-radiate at 4.9 and 7.35 GHz but these will be blocked because the antenna is designed to mismatch its impedance at the higher order harmonics thus preventing re-radiation.Reference Takhedmit, Cirio, Bellal, Delcroix and Picon50 This device architecture removes the need for a low-pass filter design and achieves 69% efficiency.
Apart from BrownReference Brown and Triner48,Reference Brown84 (for microwave) and BaileyReference Bailey12 (for solar), several other authors (Kraus,Reference Kraus16 Balanis,Reference Balanis90 and Andersen and FrandsenReference Andersen and Frandsen103) have speculated about the possibility of 100% conversion efficiency coming from highly absorptive no-loss antennas and ideal matching, transferring, and rectification of the absorbed input signal to the load. This antenna efficiency is assuming uniform distribution of energy across the antenna, a single frequency and a coherent source. The high efficiency values for MPT are achieved not only with appropriate antenna design, matching circuit, and rectifier performance, but also with efficient delivery of a good signal, because the artificially created microwave signal is single band, polarized, and coherent. This makes the antenna engineering easier. Simply reducing the size of the components to operate at solar frequencies does not necessary mean that the efficiency will remain as high as that observed for MPT rectennas. Unlike monochromatic microwave radiation, sunlight is unpolarized, incoherent, and distributed over a wide band of wavelengths.Reference Sarehraz, Buckle, Weller, Stefanakos, Bhansali, Goswami and Krishnan100 This creates further challenges in antenna engineering and lead to disputes on how to model the device performance. Furthermore, the diode has to be optimized to rectify the signal at the higher frequencies and both antenna and diode have to be well matched to maximize power transfer.
Provisional tests at 10 GHz with a dipole antenna and a Schottky diode were demonstrated by ITN Energy SystemsReference Berland5 estimating efficiencies of over 50% however this frequency is too low for solar energy harvesting. ITN states that the lower frequency rectenna is scalable to the higher terahertz frequencies required for solar harvesting with their models predicting up to 85%Reference Berland5 efficiency. According to microwave antenna theory, the antenna length scales linearly with the incident frequency which means that in theory the antenna can be scaled to resonate at IR and optical frequencies.Reference Berland5 This is not entirely the case because at IR and optical frequencies the conduction is not ohmic and the scaling laws are rather an estimation than an accurate representation of the real-life situation as the majority of the energy in the surface modes is carried in the dielectric above the antenna. This symbolizes the importance of impedance losses. The antenna has to be designed to resonate against a complex waveform and absorb broadband solar radiation which ranges from about 150 to 1000 THz, 85% of which corresponds to a wavelength of between 0.4 and 1.6 μm.Reference Berland5 To reach the targeted frequencies in the high terahertz region, SBD rectifiers would not meet the criteria as the best cut-off frequencies are only up to a few terahertz.Reference Giovine, Casini, Dominijanni, Notargiacomo, Ortolani and Foglietti104 MIM diodes are used for their potential to work in the higher terahertz region. The first practical demonstration was done by NIST89 who used atomic layer deposition (ALD) grown Cr/CrOx /Au diodes coupled to a dipole antenna and measured its efficiency at 30 THz (achieved using a CO2 laser) to be below 1%. This attempt was carried out on an unoptimized antenna structure with a poor MIM diode. Following this, numerous theoretical models have been proposed, predicting the overall conversion efficiency of the solar rectenna (see Fig. 8). For MPT rectennas, most theoretical and experimental efficiency results tend to be of the same order, whereas it can be seen that for solar rectennas different attempts on modeling the performance predict a spread of efficiencies. Some approaches are close to the Landsberg limit of 93.3%Reference Landsberg and Tonge105 whilst others predict discouraging figures below 1% (Fig. 8).
Conversion efficiencies from 0.001% to 2% have been theoretically derivedReference Mashaal and Gordon93,Reference Briones, Alda and Gonzlez96,Reference Knight, Sobhani, Nordlander and Halas98 using various assumptions and a variation of modeling approaches (Fig. 8). Mashaal and GordonReference Mashaal and Gordon93 analyzed the efficiency in terms of losses by the state-of-art rectenna designs which adopt single polarization antennas able to convert only half of the random-polarization input power from solar radiation and a half-wave rectifier blocking the negative voltages of the input signal. Their assumptions were based on ideal matching between antenna and rectifier, zero turn-on voltage, limitless switching speeds, and nonfiltered signal output from the antenna prior to entering the rectifier which yielded an overall conversion efficiency of 0.0795% and four times as high if a full-wave rectifier is used. The usual configuration for rectennas is with a parallel diode. This configuration forms a clamp circuit, which is capable of rectifying the full wave when used with a low-pass filter.Reference Moddel and Grover10,Reference Zhu, Joshi, Pelz and Moddel11 Therefore, estimating optical rectenna conversion efficiency should not be discouraged by assuming a half-wave rectification mechanism. Instead, efforts should be concentrated in understanding the effect of impedance mismatch. Briones et al.Reference Briones, Alda and Gonzlez96 based their model on the assumption that the collection of EM radiation by the antenna is done efficiently, which resulted in 0.001% efficiency of the system due to impedance mismatch losses between antenna and rectifier and inefficient rectification of the signal. By assuming efficient rectifier performance, the potential efficiency rises to approximately 1%.
An equally important criterion for efficient device operation is antenna material selection. Vandenbosch and Ma divided the analysis on the efficiency of nanorectennas into two parts – (1) the efficiency by which the light is captured by the antenna and brought to its terminalsReference Vandenbosch and Ma101 and (2) the efficiency by which the captured light is transformed to low-frequency power by the diode.Reference Ma and Vandenbosch99,Reference Sarehraz, Buckle, Weller, Stefanakos, Bhansali, Goswami and Krishnan100 Considering first the antenna efficiency, they studied various antenna materials in the form of 250 nm dipoles placed on a substrate.Reference Vandenbosch and Ma101 Their calculations predicted antenna efficiency of 61.6% for Ag, 50.3% for Al, 34.3% for Au, 29.5% for Cu, and 9.4% for Cr. In a later paper,Reference Ma and Vandenbosch99 they looked at the diode efficiency and more specifically, investigated the power loss due to impedance matching whilst assuming efficient signal rectification. This analysis was only done on the highest performing materials – Ag, Al, and Au. Their work was a continuation of a previous work by Sarehraz et al.,Reference Sarehraz, Buckle, Weller, Stefanakos, Bhansali, Goswami and Krishnan100 however their analysis covered 75% of the power radiated by the sun (up to 1000 THz) whereas Sarehraz et al. only based their analysis on 15% of the spectrum. Although Al gave the best matching efficiency of 97%, the best overall conversion efficiency of the rectenna considering both constituent parts is with Ag which gives 54% whereas Al would have 46% and Au just 28%Reference Ma and Vandenbosch99 (Fig. 8). So far, the analyzed publications all share a united opinion that a suitable rectifier is needed for the above-mentioned efficiency estimates to be achieved or improved. For impedence matching, Ma and VandenboschReference Ma and Vandenbosch99 suggest that the impedance of the rectifier must be of the order of 100 Ω both for the real and imaginary part and favor aluminum as being a suitable material for this application.
A governing factor in rectifier performance is its RC time constant which defines the cut-off frequency, f c. This is the upper limit at which the rectification process is efficient. Above the cut-off frequency, rectification is still possible however the strength of the rectified signal at the output of the MIM will drop by a factor of approximately (f c)2, thus the higher the frequency above f c the lower the rectification efficiency.Reference Sarehraz, Buckle, Weller, Stefanakos, Bhansali, Goswami and Krishnan100 The cut-off frequency is estimated by the following expression proposed by Sanchez et al.,Reference Sanchez, Davis, Liu and Javan106
 $$f_c = {1 \over {2\pi RC}},$$
where R is the series resistance and C is the capacitance. The cut-off frequency of the whole rectenna device can be evaluated by the following relation, which considers the antenna impedance (R A) and diode resistance (R D),Reference Briones, Alda and Gonzlez96
 $$f_c = {{R_{\rm{A}} + \,R_{\rm{D}} } \over {2\pi R_{\rm{A}} R_{\rm{D}} C_{\rm{D}} }}.$$
To achieve a high cut-off frequency, the RC constant must be small, which can be obtained with a small junction area,Reference Sanchez, Davis, Liu and Javan106 and appropriate material selection and fabrication. MIM rectifiers, although the most promising rectifier technology, have not been demonstrated at high terahertz frequencies with the best MIM diodes operating only up to 150 THz (λ = 2 µm)Reference Berland5 (more detail in section “Rectifier”). Improving MIM fabrication technology and material system design would potentially yield the solution to the rectenna efficiency.
So far, the reviewed efficiencies were all based on classical approaches, not concerning thermodynamic limits to solar energy conversion. In terms of equilibrium, an antenna receiving power from any source and transferring it to the load must transmit the same amount of power back to the source.Reference Corkish, Greem and Puzzer3 If the power is extracted from the load, the reduction in its temperature will introduce a different approach to analyzing the energy balance between the incoming, extracted, and re-radiated powers. In this case, Corkish et al.Reference Corkish, Greem and Puzzer3 state that the system would have the same conversion efficiency limit as the one expected for a solar thermal collector. Assuming the Sun to be a 6000 K black body and the surroundings to be at 300 K, this limit is 85.4% for monospectral energy conversion and 86.8% for multispectral. Further analysis suggests that the LandsbergReference Landsberg and Tonge105 limit of 93.3% can be reached due to certain benefits that the rectifying diodes have in rectennas (see Ref. Reference Corkish, Greem and Puzzer3 for more details), however this is hard to justify due to the generation of thermal noise by the rectifiers. Diodes cannot rectify their own thermal noise as it violates the second law of thermodynamics (known as Brillouin's paradoxReference Brillouin107).
Lerner et al.Reference Lerner, Miskovsky, Cutler, Mayer and Chung97 developed a thermodynamic expression for the open circuit voltage and conversion efficiency of a rectenna with the rectification process based on the geometric property of the antenna tip which provides a connection to the circuit and creates a tunnel junction. They envisioned the possibility of using advanced nanofabrication techniques and a selective ALD process to manufacture nanometer junctions which would potentially allow for rectification of blue light frequencies.Reference Lerner, Miskovsky, Cutler, Mayer and Chung97 In modeling the circuit of the rectenna, it can either be considered as a constant voltage source with an emf independent of the load resistance or as a constant current source whose emf depends on the load resistance. As suggested by Lerner et al.,Reference Lerner, Miskovsky, Cutler, Mayer and Chung97 the rectenna device is more appropriately modeled as a constant current source in which case efficiencies are predicted in excess of 70% for a monochromatic light source and an optimized device. Should the device be tuned for multiphoton absorption, the efficiencies are expected to be further enhanced.Reference Lerner, Miskovsky, Cutler, Mayer and Chung97 The question remains as to whether a suitable technology is yet available to make such structures.
Another analysis on the broadband blackbody radiation response of optical rectennas was done by Joshi and ModdelReference Joshi and Moddel94 by using the theory of photon-assisted tunneling. By assuming negligible reverse current of the diode, zero dark current turn-on voltage and perfect matching to the antenna, the device power conversion efficiency at monochromatic light can approach 100%, whereas for multispectral light the value is approaching a maximum at 44% at an operating voltage of 1.1 V. It should be noted that these authors also suggest that spectral splitting is likely to improve the efficiency. This can be achieved by setting the operating voltage for each rectenna to rectify the desired spectral range, thus implying that the operating voltage for the diodes in rectennas has a similar role to the band gap as a limiting factor in PV devices.Reference Joshi and Moddel94
With its proven success to receive and rectify monochromatic microwave beams with high efficiency, there is a growing interest in establishing the true potential of the rectennas' ability to convert solar radiation. As seen in Fig. 8, there are many theoretical approaches predicting this, however there is no one universal theory that clearly states whether the solar rectenna can compete with, let alone surpass common PV cells. There is however, the common opinion between scientists worldwide that the technology is not mature enough to fabricate a device of comparable efficiency. Advances in antenna engineering suggest that it is now possible to manufacture nanosized antennas which can absorb solar radiation from the IR to the visible frequencies (section “Antenna”). Work on the rectifier component has seen great progress over the years with many attempts showing great potential for use in rectenna devices (section “Rectifier”).
Antenna
Antennas are used either as transmitters, to create EM waves that have a well-defined radiation pattern, or as receivers of EM waves from a remote source.Reference Balanis90 The purpose is usually to send or extract information that is encoded into the EM wave. Antennas are now essential in many aspects of modern day living, the mobile phone being the most common example. They normally operate at a resonance. Typically, this is a half wavelength dipole antenna. The resonant wavelength of the antenna will be at the wavelength of the incoming propagating signal and energy is then transferred between them. For this reason, the antennas are usually fabricated in the dimensions of the wavelength of the incident wave. A higher frequency thus requires a smaller antenna. However, an antenna designed to be resonant at a very specific frequency by only considering a linear dimension does not guarantee efficient energy absorption. Other factors such as impedance mismatch in the circuits, bandwidth, direction, and polarization of incidence radiation need to be considered. The aim of this section is to introduce some different designs of antennas for microwave and optical frequencies.
Most antennas at microwave frequencies are designed to work within a specific frequency band reserved for ISM frequency use. For example, one of the most popular frequency bands is 2.4–2.5 GHz, is used by devices such as wireless networks, near-field communications, and Bluetooth. Therefore, these antennas only require millimeter dimension. A dipole antenna is one of the simplest designs. It consists of two identical metal elements in mirror symmetry. The most common form is two metal rods aligned on the same axis. The length of the metal rods is half the size of the resonance wavelength. Higher-order resonance modes also occur in the same antenna but at reduced efficiency due to attenuation of the induced current in the antenna. Nevertheless, the accepted frequency bandwidth is very narrow. A slight variation of the incoming frequency gives rise to parasitic capacitance and inductance resulting in inefficient energy absorption. Therefore, a precise fabrication of the antenna is necessary. This increases the difficulty in manufacturing good devices, especially when the frequency of interest is higher.
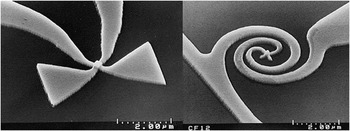
One method to circumvent the narrowband absorption problem, which dipole antennas encounter is to extend the arms width above the standard limit (i.e., 5% longer than the wavelength),Reference Fumeaux, Herrmann, Kneubühl and Rothuizen108 allowing a bigger window of frequency acceptance. This type of antenna is referred to as the bow-tie antenna (Fig. 9). The length of each arm is half the size of the radiation of interest. However, the correct length of the antenna alone does not guarantee high efficiency absorption since the incoming wave has various angles of incidence and polarization.Reference Fumeaux, Alda and Boreman109 To overcome this problem, a variety of designs have been investigated, such as spiralReference Fumeaux, Herrmann, Kneubühl and Rothuizen108,Reference González and Boreman110 (Fig. 9), log-periodic,Reference Fumeaux, Herrmann, Kneubühl and Rothuizen108,Reference González and Boreman110 microstrip slot,Reference Krishnan, La Rosa, Stefanakos, Bhansali and Buckle111 and retrodirective rectenna array.Reference Ren and Chang112
SEM images of (left) bow-tie antenna with integrated Ni–NiO–Ni diode and (right) spiral antenna. (Reprinted from Ref. Reference Fumeaux, Herrmann, Kneubühl and Rothuizen108, ©1998 with permission from Elsevier.)

As previously discussed in section “Efficiency limits”, at microwave frequencies, antennas can be designed to be very efficient. Achieving such high efficiencies at the higher frequencies is more challenging with scaling down antennas. The solar spectrum emits energy across a broadband, which implies that the antenna must absorb a large bandwidth of solar frequency, otherwise most energy will be lost. For an antenna to operate efficiently at optical frequencies, it is necessary to adjust both the inductance (L) and capacitance (C) to bring the device resonance to the required short wavelength. This would require both L and C to be very small.Reference Feynman113 To achieve this, the dimensions of the antenna must be reduced to the scale of the optical wavelength, i.e., nanometer. Scaling down the conventional antenna design to nanometer is of interest, as it can be determined whether classical antenna theory remains valid. For example, electron beam lithography has been used to fabricate a dipole antenna with a 3.5 nm NiO layer, sputtered between the two Ni antenna arms.Reference Fumeaux, Alda and Boreman109 The dipole antenna had a total length of 6.7 µm and was designed for 10 µm wavelength (30 THz). Another example is of a gold dipole antenna fabricated by using focus ion beam milling.Reference Muhlschlegel114
These attempts have proven it impossible to scale classical antenna designs to the optical frequency regime. At RF, the metals used for the construction of antennas can be considered almost lossless. This allows a large variation of RF antennas to be designed by considering the metal to be a perfect conductor. However, the losses become increasingly significant as the frequency rises. This is due to the finite effective mass of electrons causing the electrons to react with increasing phase lag to an oscillating EM field.Reference Hecht, Muhlschlegel, Farahani, Eisler and Pohl115 As soon as the phase lag approaches 90°, the amplitude of the charge oscillation goes through a maximum and is only limited by the ohmic and radiation damping of the system.Reference Biagioni, Huang and Hecht116 In metallic nanoparticles, this resonance corresponds to the localized surface plasmon resonance (LSPR). For gold, silver, aluminum, and copper, the LSPR is in, or very close to the visible light part of the spectrum. The LSPR can be exploited to overcome some of the drawbacks of antennas at optical frequency, in particular the high ohmic losses compared to microwave frequencies.
Properties of metals at optical frequencies
The optical response of metals can be described by a complex frequency-dependent dielectric function,
 $$\left( \omega \right) = _1 \left( \omega \right) + i_2 \left( \omega \right).$$
The electric field is related to the induced polarization density asReference Jackson117
 $$P\left( \omega \right) = _0 [\left( \omega \right) - 1]E\left( \omega \right).$$
For optical antennas, ohmic losses in the metal should be minimized. The ohmic absorption is proportional to the conductivity of the material, σ(ω), which is related to the dielectric function by
 $$_2 = {{\sigma \left( \omega \right)} \mathord{\left/ {\vphantom {{\sigma \left( \omega \right)} {_0 \omega }}} \right. \kern-\nulldelimiterspace} {_0 \omega }}.$$
Ohmic losses take place in close proximity to the surface of the metal, within the so-called penetration depth,Reference Maier118 which for metals at visible wavelengths are of the order of several nanometers (approximately 13 nm and 31 nm for aluminum and gold at 620 nm wavelength, respectively).Reference Kreibig and Vollmer119 The dielectric properties of a metal can cause a LSPR in the visible spectrum, which is connected to large local fields, and enhanced scattering and absorption.
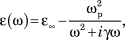
At optical frequencies, the metal conduction electrons may be treated as an ideal electron gas. The collective behavior of this free electron gas can be expressed using the Drude–Sommerfield model,Reference Maier118
 $$\left( \omega \right) = _\infty - {{\omega _{\rm{p}}^2 } \over {\omega ^2 + i\gamma \omega }},$$
where ωp is the volume plasma frequency and γ is a damping constant.Reference Maier118 (For Au at optical frequencies, ωp = 13.8 × 10¹⁵ s−1 and γ = 1.07 × 10¹⁴ s−1.Reference Biagioni, Huang and Hecht116)
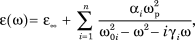
The Drude–Sommerfield model does not account for interband transitions due to photons with high-enough energy promoting electrons from lower lying valence bands to higher energy conduction bands.Reference Rakic, Djurišic, Elazar and Majewski120 This can be described using a Lorentz model of the dielectric function, which is described by a collection of damped harmonic oscillators with well-defined resonance frequencies, ω0,
 $$\left( \omega \right) = _\infty + \mathop \sum \limits_{i = 1}^n {{\alpha _i \omega _{\rm{p}}^2 } \over {\omega _{0i}^2 - \omega ^2 - i\gamma _i \omega }},$$
where ωp depends on the density of bound electrons involved in the absorption process and γ is a damping constant for the bound electrons. This Lorentz model shows strong deviation from the free electron gas model near ω0, leading to a maximum in the imaginary part of є(ω) and strongly increased damping.
Au, Ag, Al, and Cu are used as materials for metallic optical antennas. The dielectric constants of Au and Cu are very similar, with a Drude-like response for wavelength above 600 nm and an onset of interband transitions occurring around 530–550 nm, making them excellent for antennas in the red and near-IR spectral region. For Ag, the first interband transition is for a short wavelength, less than 400 nm, making it superior to Au for wavelengths around 500 nm. Al has a larger negative real part of dielectric function, and so among the four metals is the one that best approximates an ideal metal, especially in the 400–600 nm spectral region.Reference Biagioni, Huang and Hecht116 Unfortunately, there is an interband absorption peak located at 800 nm wavelength, making Al unsuitable for use in the near-IR region, although, as previously discussed, it makes a good candidate for solar rectenna due to its high predicted matching efficiency.Reference Ma and Vandenbosch99 As well as the spectral properties of the metals, the chemical stability also needs to be carefully considered. Ag and Cu are known to rapidly oxidize under ambient conditions and Al forms thin passivation layers of Al2O3. Due to its dielectric functions in the red and near-IR parts of the spectrum and its excellent chemical stability, Au is the material most often used as a nanoantenna.
Scattering and absorption properties of optical antennas
RF and microwave antennas will normally always be considered as circuit elements connected to a feeding circuit. At optical frequencies, the circuit element models are not valid and so optical antennas often appear as isolated or electromagnetically coupled structures, whose resonant properties have to be considered. Here, the LSPR of single and coupled metal nanoparticles, specifically the absorption and scattering properties, is considered. Consider a monochromatic plane wave of irradiance I i incident on a sphere of radius a. If the irradiance is multiplied by a cross-section, then the power absorbed or scattered by the particle can be calculated,
 $$P_{{\rm{abs}}} = I_{\rm{i}} C_{{\rm{abs}}} ,$$
 $$P_{{\rm{sca}}} = I_{\rm{i}} C_{{\rm{sca}}} ,$$
where C abs and C sca are the absorption and scattering cross-sections, respectively. The cross-sectional areas can be normalized to the cross-section of the sphere to give the scattering and absorption efficiencies:
 $$Q_{{\rm{abs}}} = {{C_{{\rm{abs}}} } \over {\pi a^2 }},$$
 $$Q_{{\rm{sca}}} = {{C_{{\rm{sca}}} } \over {\pi a^2 }},$$
where a is the radius of the sphere. Equations (11) and (12) define the two loss mechanisms, Q sca which is radiative and Q abs, which is nonradiative, the extinction efficiency being the sum of both these terms.
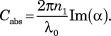
Smaller sized particles restrict electron motion and cause electrons to collide with the inner surface of the particle, resulting in loss of energy and increased absorption. Absorption is therefore the greater loss mechanism in smaller particles. The radiation damping rate is proportional to the number of electrons. This means that the larger the particle, the more significant this factor, and the broader the plasmon resonance becomes. A larger particle volume results in a decrease in the amount of incident radiation absorbed but an increase in the scattering. Scattering and absorption due to small spheres can be described using the well-known Mie theory,Reference Bohren and Huffman121 where
 $$C_{{\rm{abs}}} = {{2\pi n_1 } \over {\lambda _{\rm{0}} }}{\mathop{\rm Im}\nolimits} \left( \alpha \right).$$
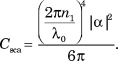 $$C_{{\rm{sca}}} = {{\left( {{{2\pi n_1 } \over {\lambda _{\rm{0}} }}} \right)^4 |\alpha |^2 } \over {6\pi }}.$$
The polarization, α, is given by
 $$\alpha = r^3 {{\left( {_2 - _1 } \right)} \over {\left( {_2 + 2_1 } \right)}},$$
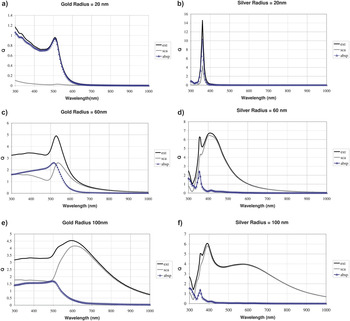
where r is the radius of the sphere, є2 the complex permittivity of the sphere, and є1 the complex permittivity of the surrounding medium. Examples of Mie theory calculations of extinction, scattering, and absorption for gold and silver spheres of various radii are shown in Fig. 10.
Mie calculations of extinction, scattering, and absorption efficiencies for silver and gold nanospheres: (a) Au sphere of 20 nm radius, (b) Ag sphere of 20 nm radius, (c) Au sphere of 60 nm radius, (d) Ag sphere of 60 nm radius, (e) Au sphere of 100 nm radius, (f) Ag sphere of 100 nm radius.

Interesting observations that arise from the Mie theory calculations are that a number of peaks can be observed for larger diameter spheres, the longest wavelength peak being a dipole mode. As expected, the LSPR broadens as the particle size increases but absorption and scattering maximums are not always at the same wavelength. The absorption and scattering properties can be tuned using different shaped particles. In this case, more complex calculation methods are required, for example, the discrete dipole approximation,Reference Draine and Flatau122 finite element method,Reference Khoury, Norton and Vo-Dinh123 or finite different time domain (FDTD).Reference Oskooi, Roundy, Ibanescu, Bermel, Joannopoulos and Johnson124 FDTD is a popular method since it is possible to consider the scattering and absorption from any shaped particle in any dielectric environment and since the calculation is in the time domain a single calculation will yield the spectral response over a wide bandwidth, using a Fourier Transform.Reference Centeno, Alford and Xie125
If a surface that fully encloses the scattering object is now defined, then by considering the total field flowing through it, one can calculate the normalized absorption cross-section Q abs from,Reference Centeno, Ahmed, Reehal and Xie126
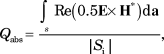 $$Q_{{\rm{abs}}} = {{\int\limits_s {{\mathop{\rm Re}\nolimits} \left( {0.5E \times H^* } \right)} {\mathop{\rm d}\nolimits} a} \over {|S_{\rm{i}} |}},$$
and by considering the scattered field the normalized scattering cross-section, Q sca, is found fromReference Centeno, Ahmed, Reehal and Xie126
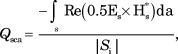 $$Q_{{\rm{sca}}} = {{ - \int\limits_s {{\rm{Re}}\left( {0.5{\bf{E}}_{\rm{s}} \times {\bf{H}}_{\rm{s}}^{\rm{*}} } \right)} {\mathop{\rm d}\nolimits} {\bf{a}}} \over {|S_{\rm{i}} |}},$$
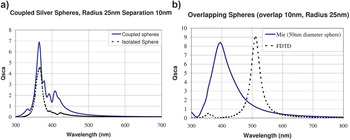
where  $|{S_{\rm{i}}}|$ is the power incident on the cross-sectional area of the nanoantenna. Using computational electromagnetics to calculate the electric (E) and magnetic (H) fields at the enclosing surface, Eqs. (16) and (17) can be solved. Figure 11 shows the Q sca calculated using FDTD for (a) two closely spaced and (b) two overlapping spheres, where the spheres are silver and of 50 nm diameter.Reference Centeno, Xie, Breeze and Alford127
FDTD calculations of Q sca for (a) two closely coupled Ag spheres and (b) two overlapping Ag spheres.

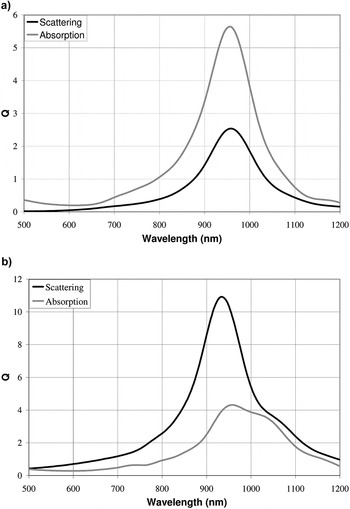
Furthermore, the surrounding dielectric environment and orientation of the nanoparticle can significantly modify the absorption and scattering properties.Reference Centeno, Ahmed, Reehal and Xie126 As an example, consider the two configurations of 30 nm radius hemispherical Au nanoparticles, depicted in Fig. 12. In both configurations, the metal nanoparticle is at the interface between the air and silicon on the lower surface of the semiconductor. In the first case, the nanoparticle extends into air, whilst for the second case it extends back into the silicon. In each case, the scattering properties of the metal nanoparticle are calculated when there is a normally incident field from within the silicon.Reference Centeno, Ahmed, Reehal and Xie126 The results are shown in Fig. 13. It can be seen that in case (b) the scattering efficiency is dominant, whereas in case (a) it is the absorption that is the largest extinction component.
Depiction of the two configurations considered: (a) nanoparticle extending into air and (b) nanoparticle extending into silicon. (Reprinted from Ref. Reference Centeno, Ahmed, Reehal and Xie126.)

Q sca and Q abs FDTD calculations for (a) nanoparticle extending into air and (b) nanoparticle extending into silicon. (Reprinted from Ref. Reference Centeno, Ahmed, Reehal and Xie126.)

We have discussed the LSPR of isolated and coupled nanoparticles in terms of their absorption and scattering efficiencies. The subsequent coupling between the nanoantenna and rectifying diode will need to be optimized. Absorption is caused by the generation and recombination of electron hole pairs (EHP). EHP formation occurs when the plasmon quantum excites an electron from the Fermi level to an occupied state below the vacuum level. It has been shown that the concentrated electric fields around a nanoantenna, due to the LSPR, can cause hot-electron carriers.Reference Fang, Liu, Wang, Ajayan, Nordlander and Halas128–Reference Mukherjee, Libisch, Large, Neumann, Brown, Cheng, Lassiter, Carter, Nordlander and Halas130 Because of their higher energy, hot electrons will extend further away from the nanoparticle than an equilibrium electron distribution, which is above the vacuum level. If a nearby electron acceptor is present, hot electrons can transfer into its electronic states. This hot-electron carrier generation and injection into an acceptor due to the high fields is a topic of much current research in PV devices,Reference Fang, Liu, Wang, Ajayan, Nordlander and Halas128–Reference Wang and Melosh131 in particular optimizing the efficiency of this process.
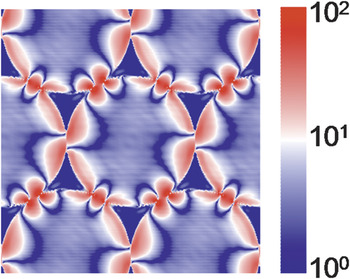
For an optical rectenna, it is desirable to enhance and localize (i.e., concentrate) the propagating fields to enable coupling into external circuit elements. The concentrated fields tend to be higher for particles with a higher scattering efficiency and between the small gaps of coupled nanoparticles. This is opposite to hot-electron devices which seek to maximize the absorption of photons in the nanoparticle. Figure 14 shows the values of electric field, normalized to the incident field, around Ag nanoparticles, formed by colloidal lithography using 500 nm polystyrene spheres as a template on a glass substrateReference Xie, Pang, Centeno, Ryan, Riley and Alford132 (this makes the triangular sides around 120 nm in this case). The scale is logarithmic and it can be seen that there are up to two orders of magnitude electric field enhancement in the gaps between the particles.
Concentrated electric field calculations around triangular like nanoparticles of height 100 nm formed by colloidal lithography with 500 nm polystyrene spheres. The excitation wavelength is 780 nm and calculations were carried out using FDTD. (Reprinted from Ref. Reference Xie, Pang, Centeno, Ryan, Riley and Alford132.)

Alternative structures
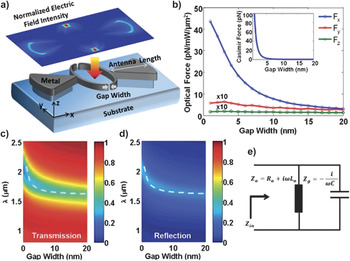
Progressing toward a more efficient energy harvesting technology, some creative and novel designs have been explored. Other than the hot electron-assisted mechanism, the idea of optomechanical nanoantenna has also been explored. In this design, the plasmonic bow-tie antenna when coupling with the incident radiation, generates a strong electric field in the gap regions of the antenna arms and bends the arms toward each otherReference Bonakdar, Kohoutek, Dey and Mohseni133 (Fig. 15). As the arm bends toward each other, a redshift in transmission and reflection power occurs, allowing the device to have a larger operation bandwidth. With the inclusion of surface plasmon polariton property, it is calculated that the antenna length can be greatly reduced while providing a mechanical bandwidth of 4.4 GHz.
(a) 3D schematic diagram of the optomechanical nanoantenna investigated. A near-field intensity map of the device is shown on the top. (b) Simulated optical force and Casimir force (inset) on the suspended beam as a function of gap width. Simulated (c) transmission and (d) reflection power spectrums versus gap width. (e) Nanocircuit lump elements model. (Reprinted from Ref. Reference Bonakdar, Kohoutek, Dey and Mohseni133, ©2012 with permission from Optical Society of America.)

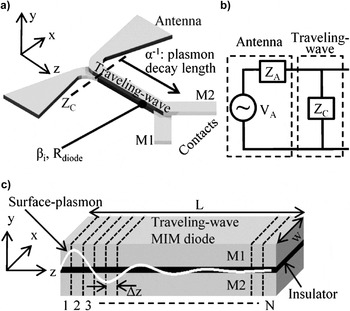
The propagation wavelength for the waveguide in the material is very small. This suggests that if the antenna is very close to the diode, it can reduce losses.Reference Biagioni, Huang and Hecht116 In traveling wave (TW) MIM rectenna design, a MIM junction is created between the top and bottom bow-tie antennaReference Grover, Dmitriyeva, Estes and Moddel134,Reference Hobbs, Laibowitz and Libsch135 [Fig. 16(a)]. This allows the diode to rectify the absorbed radiation at this MIM junction. This design is similar to a bow-tie antenna, except that the left bow and the right bow are separated by a very thin layer of insulator, forming an extended MIM tunneling diode. The absorbed radiation excites surface plasmon and propagates along this axis [Fig. 16(c)]. The current induced between the top metal and bottom metal causes tunneling of electrons to occur. A final rectified current is produced due to the asymmetry in the I–V characteristic at the bias point (further information in section “Rectifier”). One of the advantages in this design is that it is not limited by the RC bandwidth.
(a) Isometric view of the antenna-coupled TW device. Instead of crossing over as in a typical bow-tie antenna in Fig. 1, the antenna arms converge into a parallel-plate waveguide with a 2 nm thin insulator between the metal M1 and M2. (b) Circuit representing the TW MIM device. (c) 3D view of the TW MIM diode. (Reprinted from Ref. Reference Grover, Dmitriyeva, Estes and Moddel134, ©2010 IEEE. Reprinted, with permission, from IEEE.)

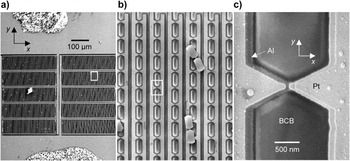
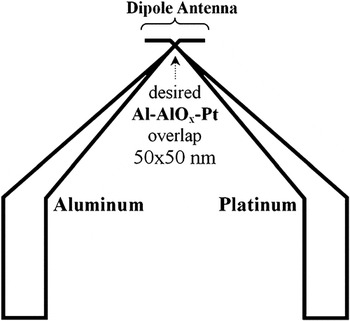
Another example of integrated rectenna design is the slot-antenna-based frequency selective surface with integrated metal–oxide–metal (MOM) diode.Reference Kinzel, Brown, Ginn, Lail, Slovick and Boreman136 The material consists of Al, Al2O3, and Pt on benzocyclobutene standoff, designed for absorbing radiation at 28.3 THz (10.6 m). Numerical simulations showed that when the incoming radiation is parallel to the diode junction, the electric field is concentrated 2000 times across the diode with a decrease of reflectance around the desired wavelength, which can be used as an indication of absorption. A working device was fabricated with e-beam lithography (Fig. 17) and similar optical response in reflectance was measured.
SEM images of fabricated MOM diode-coupled frequency selective surface device. (a) Image of entire array consisting of 16,800 diode-coupled elements is less than 0.325 mm2, (b) closer image of the array showing several pieces of metal coated photoresist that became attached to the sample after lift-off, and (c) diode of working device (Reprinted from Ref. Reference Kinzel, Brown, Ginn, Lail, Slovick and Boreman136, ©2012 with permission from John Wiley and Sons.)

The recent development of graphene technology also prompts the incorporation of graphene into nanoantenna design. Ag is known to suffer from sulfidation under ambient environment, resulting in degradation of the plasmonic property.Reference Reed, Zhu, Zhu, Li and Cubukcu137 Graphene was shown to be able to passivate the Ag and prevent sulfidation without affecting the plasmonic property of the Ag nanoantenna.Reference Reed, Zhu, Zhu, Li and Cubukcu137 Additionally, radical changes in the plasmon energy and strength were also observed by electrically doping patterned graphene arrays with a gate voltage.Reference Fang, Thongrattanasiri, Schlather, Liu, Ma, Wang, Ajayan, Nordlander, Halas and de Abajo138 The development of new materials such as graphene open up new possibility to design a better optical antenna.
Impedance matching
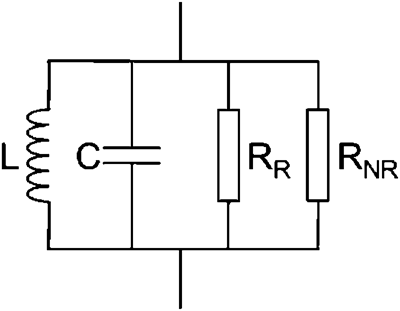
As previously introduced, the efficient energy transfer from antenna to diode requires an impedance match between both components. A theoretical analysis on an optical dipole nanoantenna showed that the nanoantenna appears to be an effective RLC parallel circuitReference Greffet, Laroche and Marquier139 (Fig. 18). The two parallel resistances are due to radiative decay and nonradiative decay rates. The electrical properties of a nanoantenna are intrinsically influenced by the material used, dimensions, and geometric shape.Reference Ma and Vandenbosch99 Dipole antennas of length between 100 and 350 nm for Ag, Al, and Au on glass have been studied through simulation,Reference Ma and Vandenbosch99 as previously introduced. At a single frequency and assuming no loss of power in impedance mismatch, a silver dipole shows the highest efficiency. However, the upper bound efficiency drops when the solar irradiance spectrum is taken into account. Further investigation by inclusion of losses due to impedance mismatching showed even further decrease in conversion efficiency (see section “Efficiency limits”).
Equivalent circuit of a metallic nanoantenna. (Reprinted (Fig. 1) with permission from Ref. Reference Greffet, Laroche and Marquier139, ©2010 by the American Physical Society.)
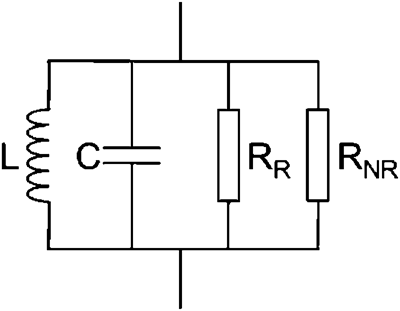
Liu et al.Reference Liu, Wen, Zhao, Wang, Nordlander, Halas and Alù140 considered the nanoantenna as lumped elements in three-dimensional nanocircuits and demonstrated that impedance of the antenna can be tuned by loading a dielectric or a metal in the gap between a dimer. A SiO2 load was used as the dielectric material. In the circuits, it represents an additional capacitor for the dimer system. When gold is loaded between the gold dimers, the nanocircuit becomes an LC circuit. The gold load acts as an optical frequency inductor and the two gaps between the gold load and gold antenna behave as two capacitors. To develop the idea further, a combined gold–SiO2 load was also fabricated. The circuit now corresponds to an LC parallel circuit in series. In all cases, the impedance was tunable by changing the dimensions and the materials of the load, with the gold–SiO2 showing the largest tunability.
Nanofabrication
For microwave energy extraction, device dimensions are in the micrometer range, achievable using well-established photolithography techniques. At IR and optical frequencies, nanometer dimensions are required. Unfortunately, the resolution of photolithography is limited by the diffraction wavelength of light and so different fabrication techniques are required. Fabrication techniques that have been demonstrated to be effective at obtaining nanometer resolution are electron beam lithography, nanoimprint lithography, and colloidal lithography.
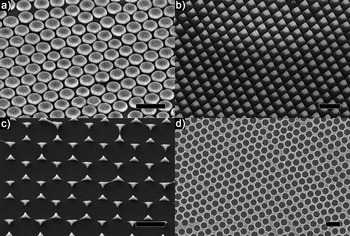
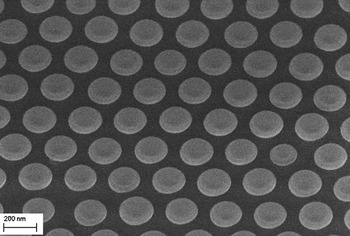
Electron beam lithography is similar to photolithography but uses an electron beam instead of light. The wavelength of the electron beam is much smaller than light, allowing sub-10 nm resolution in patterning and creation of well-defined structure such as the nanogap in antenna-coupled diode in Fig. 18. However, it is costly and cannot be effectively up scaled for a large area. Nanoimprint lithography uses a pre-made mask to create a pattern on a substrate.Reference Guo141 This mask can be used numerous times and allows large area fabrication. Compared with e-beam lithography, nanoimprint lithography enables large area patterning but each mask is specially designed for a specific nanostructure. Figure 19 illustrates an example of a large area of nanostructures fabricated using nanoimprint technology. A new mask will have to be made if the nanostructure required is different and the cost of the mask is high. Nanosphere lithography is a more versatile lithography technique, based on self-assembly of nanospheres. It allows fabrication of large area devices at relatively low cost. Although it does not allow huge degree of manipulation in the shape of nanostructure compared with e-beam lithography, a variety of shapes in large ordered array have been fabricated successfully (Fig. 20), such as nanotriangles,Reference Xie, Pang, Centeno, Ryan, Riley and Alford132,Reference Xie, Centeno, Ryan, Riley and Alford143,Reference Haynes and Duyne144 crescent moon,Reference Liu, Choi, Gozubenli and Jiang145 nanorings,Reference Liu, Choi, Gozubenli and Jiang145 nanocones,Reference Hsu, Connor, Tang and Cui146 and three-dimensional structures.Reference Zhang, Elek and Chang147
(a) Photograph of a single layer negative index material (NIM) sample and (b) transfer printed gold grating on a flexible foil. Top-view SEM images of (c) the single functional fishnet layer and (d) the Swiss-cross NIMs fabricated using nanoimprint technology. (Reprinted from Ref. Reference Bergmair, Dastmalchi, Bergmair, Saeed, Hilber, Hesser, Helgert, Pshenay-Severin, Pertsch, Kley, Hübner, Shen, Penciu, Kafesaki, Soukoulis, Hingerl, Muehlberger and Schoeftner142, ©IOP Publishing. Reproduced by permission of IOP Publishing. All rights reserved.)

SEM images of variety of gold nanostructures based on nanosphere lithography technique (a) nanodisc array, (b) slanted nanocones, (c) nanotriangles and (d) nanoholes. (Note: 500 nm scale bar in all images.)

Advances in nanofabrication techniques are crucial in developing a better nanoantenna. Further details on nanoantenna theory and application can be found in some recent reviews.Reference Biagioni, Huang and Hecht116,Reference Bharadwaj, Deutsch and Novotny148
Rectifier
A rectifier, a nonlinear device such as a diode, is an integral part of the rectenna device, used to convert an AC input voltage from the antenna into a usable DC voltage. As discussed in section “Efficiency limits”, the rectenna is fundamentally limited by the cut-off frequency (f c) of the diode, above which the rectification process will become increasingly inefficient. f c changes with the type of rectifier used due to the physical nature of the diode's operation dictated by its potential of achieving a low RC time constant. SBDs have been demonstrated and are theoretically limited to frequencies of a few terahertz, whereas MIM / metal–insulator–insulator–metal (MIIM) diodes are shown to be operational at 150 THzReference Berland5,Reference Jennings, Petersen and Evenson149 and are predicted to potentially exceed this and reach the visible regime. Three parameters have been defined,Reference Berland5,Reference Periasamy, Berry, Dameron, Bergeson, Ginley, O’Hayre and Parilla150–Reference Chin, Periasamy, O’Regan, Amani, Tan, O’Hayre, Berry, Osgood, Parilla, Ginley and Dubey152 which, if satisfied, result in characterizing a device as a diode rectifier:
 $$f_{{\rm{asym}}} ({\rm{V}}) = \left| {{{I_{\rm{F}} \left( {\rm{V}} \right)} \over {I_{\rm{R}} \left( {\rm{V}} \right)}}} \right|;\quad {\rm{Asymmetry}} > 1,$$
 $$f_{{\rm{NL}}} \left( {\rm{V}} \right) = {{{{{\rm{d}}I} \over {{\rm{dV}}}}\left( {\rm{V}} \right)} \mathord{\left/ {\vphantom {{{{{\rm{d}}I} \over {{\rm{dV}}}}\left( {\rm{V}} \right)} {{{I\left( {\rm{V}} \right)} \over {\rm{V}}}}}} \right. \kern-\nulldelimiterspace} {{{I\left( {\rm{V}} \right)} \over {\rm{V}}}}};\quad {\rm{Nonlinearity}} > 3,$$
 $$f_{{\rm{RES}}} \left( {\rm{V}} \right) = {{{{{\mathop{\rm d}\nolimits} ^2 I} \over {{\mathop{\rm d}\nolimits} ^2 {\rm{V}}}}\left( {\rm{V}} \right)} \mathord{\left/ {\vphantom {{{{{\mathop{\rm d}\nolimits} ^2 I} \over {{\mathop{\rm d}\nolimits} ^2 {\rm{V}}}}\left( {\rm{V}} \right)} {{{{\mathop{\rm d}\nolimits} I} \over {{\mathop{\rm d}\nolimits} {\rm{V}}}}\left( {\rm{V}} \right)}}} \right. \kern-\nulldelimiterspace} {{{{\mathop{\rm d}\nolimits} I} \over {{\mathop{\rm d}\nolimits} {\rm{V}}}}\left( {\rm{V}} \right)}};\quad {\rm{Responsivity}} > 7{\rm{V}}^{ - 1} .$$
These three Figure of Merits (FOMs) are commonly used to characterize the performance of MIM devices however can be equally applied to other diodes. The asymmetry FOM, defined in Eq. (18), is the absolute ratio of forward to reverse current at a bias, a value of 1 indicating full symmetry and hence no rectification. The nonlinearity FOM, as defined by Eq. (19), is the ratio of the differential conductance to the conductance and is a measure of the deviation from a linear resistor. Finally, the responsivity FOM defined in Eq. (20) is the ratio of the second derivative of the I–V curve and the differential conductance and is a measure of the rectified signal as a function of input power. It is essential that the diode in a rectenna exceeds all of these criteria as the higher the FOMs for the diode, the more efficient the rectification process.
Note: There was some disagreement argued by Tucker and Feldman Reference Tucker and Feldman153that responsivity should be described using second-difference equations and not derivatives to understand high frequency rectification. However, proving which is the correct approach is beyond the scope of this review as the authors aimed to only bring this theory to the attention of readers. The authors support the use of derivatives of the I–V curve in analysis of these FOMs.
The fundamental operational theory and recent experimental and theoretical developments of SBDs (used in the MPT rectenna), MIM and MIIM diodes (proposed for solar rectenna), and geometric diodes (proposed for solar rectenna) will be reviewed in this chapter.
Schottky barrier diodes
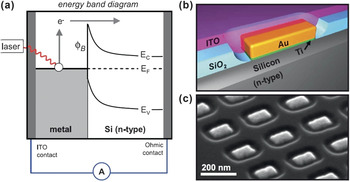
Schottky barriers have been used as rectifying devices since the first cat's whisker detectors in the first decade of the 20th century. The ‘barrier’ itself is formed within the semiconductor side of a MS interface, the result of its conduction and valence bands bending to align the Fermi levels of each material. Figure 21 shows an ideal MS interface with the Schottky barrier,  $\Phi _{{\rm{B}},n}^0$, marked.
Band diagram of an ideal Schottky Barrier,  $\Phi _{{\rm{B}},n}^0$, contact formed with n-type semiconductor with an applied bias, V a. (Reprinted from Ref. Reference Tung154, ©2001 with permission from Elsevier.)

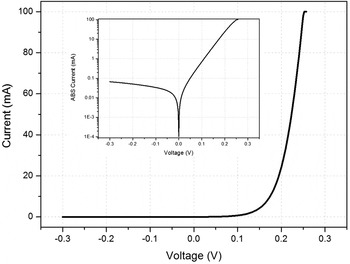
Room temperature current–voltage characteristics of a simple Cr/n-Si lateral type Schottky barrier diode of area 0.448 mm3. SBH calculated at 0.51 eV, ideality factor of 1.06, diode asymmetry at ± 0.25 V of 1669, nonlinearity estimated at 0.2, and responsivity above 10 V−1. The cut-off frequency has been estimated at 40 GHz.

In Fig. 21, note that within the semiconductor, a depletion region, or space charge region, forms. This is a region of the semiconductor that is devoid of mobile charge carriers when the device is unbiased, and as such it can be considered as the dielectric between two plates of a capacitor, so having a direct influence on the RC time constant. Minimizing the capacitance of a Schottky diode can be achieved through scaling (though this has the equal and opposite effect on the diode's resistance), or by increasing the depletion region width by using low semiconductor doping.
The full operation of a diode has been well studied and understood over the past century, and readers are referred to Refs. Reference Pierret155, Reference Sze156, for a basic understanding of Schottky diode formation, operation, and physics under different biasing conditions. Both the forward and reverse current–voltage (I–V) relationship is in most cases, where semiconductor doping is low enough, dictated by thermionic emission, rather than recombination or tunneling. The equation for thermionic emission, where the carrier in the semiconductor must pass up and over the potential barrier into the metal, is classically expressed asReference Pierret155–Reference Schroder157
 $$I = AA^* T^2 \exp \left( { - \beta \Phi _{{\rm{B}},n}^0 } \right)\left[ {\exp \left( {\beta V_{\rm{A}} /\eta } \right) - 1} \right],$$
where A represents the contact area, A* is the Richardson constant, T is the temperature, V A is the applied voltage, η the ideality factor, and β = q/k BT with q the electron charge and k B the Boltzmann constant. However, built into Eq. (21) is the presumption that a perfect, homogeneous interface exists, with just one uniform value of  $\Phi _{{\rm{B}},n}^0$. Instead, a more realistic scenario should be considered where multiple current paths exist flowing over barriers of different barrier height, so modifying this equation that has been the standard for a century or more. The papers by TungReference Tung154,Reference Tung158 and othersReference Gammon, Donchev, Pérez-Tomás, Shah, Pang, Petrov, Jennings, Fisher, Mawby, Leadley and Alford159–Reference Gammon, Pérez-Tomás, Shah, Vavasour, Donchev, Pang, Myronov, Fisher, Jennings, Leadley and Mawby163 provide a much more rigorous understanding of the Schottky diode and its operation under this inhomogeneous regime. Given the small potential size of a Schottky rectenna, the impact of such interface inhomogeneity will be the source of significant device–device variation, and an unpredictability of cut-off frequencies.
Typical Schottky diodes can have good diode characteristics in terms of the FOMs mentioned in Eqs. (18)–(20), as demonstrated by the simple example of a Cr/Si Schottky diode made in-house for Ref. Reference Gammon, Donchev, Pérez-Tomás, Shah, Pang, Petrov, Jennings, Fisher, Mawby, Leadley and Alford159 (Fig. 22). The characteristics of this diode are close to ideal (i.e., η < 1.1), and its FOM values are strong, with a diode asymmetry of 1669, nonlinearity of approximately 0.2, and responsivity above 10 V−1. However, high series resistance and depletion region capacitance result in a cut-off frequency of just 40 GHz. Therefore, this is a device which could be suitable in a MPT rectenna, but it would be entirely ineffectual at solar frequencies.
With appropriate device design in terms of size and interface homogeneity, parasitic capacitances and resistances, arising from skin effects and residual native oxide scales at the MS interface, can be minimized to have a significant effect on the RC time constant. In silicon, the cut-off frequency has been seen to reach 1 THz obtained by a layer of Ti–Pt–Au on a thin layer of n-Si,Reference Strohm, Buechler and Kasper164 whereas 400 GHz has been seen from a simple Ti/n-Si structure.Reference Sankaran and O165 On GaAs, frequencies of up to 5 THz have been achieved, as reviewed by Sizov and Rogalski.Reference Sizov and Rogalski166 This is obtained using highly doped GaAs substrate with an ohmic contact on the back side upon which a thin (0.3–1 µm) epitaxial GaAs layer is grown, with Pt forming the Schottky contact. A honeycomb diode chip design enables thousands of diodes (diameters of 0.25–1 µm) on a single chip whilst minimizing parasitic losses.
As rectifiers in the wireless power transmission rectenna application, SBDs are more than suitable candidates and as seen in section “Efficiency limits” can operate efficiently. With cut-off frequencies in the low terahertz, Schottky diodes may potentially find usage as IR rectennas although they will be limited to only function at a fraction of the far-IR range, where the incident solar radiation is only up to 0.3 W/m2/nm. The aim is to have solar rectennas operating at the high terahertz region where solar radiation is up to 1.7 W/m2/nm, however Schottky diodes will not be able to efficiently rectify such high signals. Therefore, other approaches such as the MIM/MIIM and geometric diodes are being considered for the solar rectenna.
An alternative approach, which was first proposed by Knight et al.,Reference Knight, Sobhani, Nordlander and Halas98 is to use the diode as the active component in a hot-electron device. In this case, the array of nanometer scale anodes double as the antennas, in which the incident light causes a LSPR. Plasmon decay produces EHP and as represented in Fig. 23(a), hot electrons are injected into the semiconductor after overcoming the Schottky barrier energy. The reportedReference Knight, Sobhani, Nordlander and Halas98 quantum efficiency of this structure is estimated at being just 0.01%, though improvements are suggested to reach efficiencies of 2%. Recent publication suggests 30% efficiency of converting “hot electrons” in the metal to electrons in the semiconductor,Reference Giugni, Torre, Toma, Francardi, Malerba, Alabastri, Proietti Zaccaria, Stockman and Di Fabrizio167 though full conversion efficiency has not been estimated. In this case, although the device is based on an antenna coupled to a rectifier (similar components to a rectenna), the device is not proposed for light harvesting purposes due to its low efficiency and is instead demonstrated as a photodetector. Development of this concept into an energy harvesting application would require the conversion efficiency to be increased, though with the current state-of-art, this seems improbable.
Schottky diode as the active component for the solar rectenna device – concept inspired by Knight et al. Images (a) showing a band diagram of the proposed photocurrent mechanism, (b) showing the device layout and structure, and (c) showing an SEM image of the array of devices. (Reprinted from Ref. Reference Knight, Sobhani, Nordlander and Halas98, ©2011 with permission from The American Association for the Advancement of Science.)

Metal–insulator–metal diodes
Current transport in MIM diodes is due to quantum electron tunneling through an ultra-thin insulator layer (typically <10 nmReference Eliasson168). Rectification in these devices is due to variation in tunneling rates caused by barrier asymmetry due to material selection, device geometry, thermal asymmetry, and photon-induced deviation in electron flux distribution across occupied and unoccupied states,Reference Miskovsky, Cutler, Mayer, Weiss, Willis, Sullivan and Lerner17 all contributing toward a nonlinear asymmetric I–V response. In the current review, we will qualitatively explain the nature of the I–V asymmetry taking into account the material selection for planar MIM devices under no illumination and thermal equilibrium. Under illumination, electron tunneling is stimulated by different processes depending whether an antenna is or is not coupled to the diode. Further reading is suggested in Refs. Reference Miskovsky, Cutler, Mayer, Weiss, Willis, Sullivan and Lerner17, Reference Eliasson168, Reference Sullivan, Kuk and Cutler169, Reference Grover, Joshi and Moddel170. Thermionic emission also contributes to tunnel diodes' I–V curves,Reference Chin, Periasamy, O’Regan, Amani, Tan, O’Hayre, Berry, Osgood, Parilla, Ginley and Dubey152,Reference Eliasson168,Reference Alimardani, McGlone, Wager and Conley171 especially to devices with thick insulating layers.Reference Chin, Periasamy, O’Regan, Amani, Tan, O’Hayre, Berry, Osgood, Parilla, Ginley and Dubey152
Theory of operation
Consider a MIM junction as shown in Fig. 24(a). Metal 1 has a workfunction, Φ1, lower than that of Metal 2, Φ2, and χ is the electron affinity of the insulator. The barrier height at the metal–insulator interface is determined from the difference between the workfunction and electron affinity respectively. At zero bias, the band structure is shown in Fig. 24(a). By applying a negative bias to Metal 1 w.r.t. Metal 2 (we term this reverse bias), the band diagram shifts as in Fig. 24(b). In this case, direct tunneling is observed as a result of the effective tunneling distance, d t, being the same length as the insulator thickness. Further increasing the applied voltage, V A, decreases the effective d t, and it becomes shorter than the length of the insulator [as seen in Fig. 24(c)], thus Fowler–Nordheim tunnelingReference Fowler and Nordheim172 starts to occur. When a positive bias of the same magnitude is applied to Metal 1 w.r.t. Metal 2 (forward bias), the bands shift as in Fig. 24(d). Fowler–Nordheim tunneling is observed in this case and occurs at a lower voltage, the higher the barrier asymmetry at both metal–insulator interfaces (arising from the difference in metal workfunctions). Further increasing the positive bias [as in Fig. 24(e)] will further decrease the effective tunneling distance, d t, which further increases the tunneling probability in forward bias. Therefore, rectification occurs because for the same voltage magnitude in forward bias, d t will be shorter and more current will be flowing than in the equivalent case in reverse bias. By changing the applied voltage, the tunnel distance changes linearly and the tunnel current is exponentially dependent on this distance.Reference Grover and Moddel173 This leads to an asymmetric, nonlinear I–V response and is the origin of the rectification mechanism in MIM diodes.
Ideal band diagram for a MIM diode with dissimilar workfunctions for Metal 1, Ф1, and Metal 2, Ф2, χ the insulator's electron affinity, E F the Fermi level, d t the tunnel distance, and V A the applied voltage. (a) No bias situation (V A = 0 V); (b, c) negative bias at Metal 1 (reverse bias); (d, e) positive bias at Metal 1 (forward bias).

Experimental devices
Various metal–insulator systems have been used to investigate the rectification behavior of MIM diodes. Research attempts are concentrated either toward modeling the behavior and rectification properties or improving the FOMs by optimizing the material selection and fabrication techniques of these structures. As theory suggests, using similar metals in the MIM configuration should yield symmetric I–V curves, however asymmetric I–V curves have been reported for Al/Al2O3/AlReference Kadlec and Gundlach174 with structures and experiments conducted by the authors on Ti/TiO2/Ti and Nb/Nb2O5/Nb devices having also displayed asymmetric I–V curves for these structures. The origin of this asymmetry is suspected to come from the formation of two different metal–insulator interfaces arising from dissimilar deposition processes, thus creating regions of enhanced leakage currents through the barrier. Other reported structures with optimized oxide layers such as Ni/NiO/Ni,Reference Fumeaux, Herrmann, Kneubühl and Rothuizen108,Reference Hobbs, Laibowitz and Libsch135,Reference Heiblum, Wang, Whinnery and Gustafson175–Reference Choi, Yesilkoy, Ryu, Cho, Goldsman, Dagenais and Peckerar178 Al/Al2O3/Al,Reference Gloos, Koppinen and Pekola179 and Nb/Nb2O5/NbReference Periasamy, Berry, Dameron, Bergeson, Ginley, O’Hayre and Parilla150,Reference Periasamy, Guthrey, Abdulagatov, Ndione, Berry, Ginley, George, Parilla and O’Hayre151,Reference Periasamy, Bergeson, Parilla, Ginley and O’Hayre180 show symmetry in the I–V curves, which is compliant with theoretical predictions. Although not displaying rectification properties, the Ni/NiO/Ni system is widely used for detection and mixing up to 30 THz IR radiation due its significantly low resistance-area product of 1 Ω (μm2),Reference Fumeaux, Herrmann, Kneubühl and Rothuizen108,Reference Hobbs, Laibowitz and Libsch135,Reference Wilke, Oppliger, Herrmann and Kneubühl176,Reference Abdel-Rahman, González and Boreman177 which indicates the potential for a low RC constant. However due to a lack of asymmetry, the second Ni electrode must be replaced with a metal of different workfunctions to achieve rectification. This has been investigated by Hoofring et al.,Reference Hoofring, Kapoor and Krawczonek181 Krishnan et al.,Reference Krishnan, La Rosa, Stefanakos, Bhansali and Buckle111,Reference Krishnan, Stefanakos and Bhansali182 and Esfandiari et al.Reference Esfandiari, Bernstein, Fay, Porod, Rakos, Zarandy, Berland, Boloni, Boreman, Lail, Monacelli and Weeks183 with Au, Cr, and Pt contacts, respectively, all displaying good asymmetrical I–V response. Other structures of dissimilar materials which have shown promising results are Al/Al2O3/Ni,Reference Gustafson, Schmidt and Perucca184 Nb/Nb2O5/Pt,Reference Periasamy, Berry, Dameron, Bergeson, Ginley, O’Hayre and Parilla150,Reference Periasamy, Guthrey, Abdulagatov, Ndione, Berry, Ginley, George, Parilla and O’Hayre151,Reference Periasamy, O’Hayre, Berry, Parilla, Ginley and Packard185 ZrCuAlNi/Al2O3/Al,Reference Cowell, Alimardani, Knutson, Conley, Keszler, Gibbons and Wager186 and also Nb/Nb2O5/Ag (tested in-house and by Ref. Reference Grossman, Harvey and Reintsema187). More tested metal–insulator combinations are listed in Ref. Reference Periasamy, Berry, Dameron, Bergeson, Ginley, O’Hayre and Parilla150.
ZrCuAlNi was suggested as an electrode due to its low roughness after growth, making it suitable for MIM devices.Reference Cowell, Alimardani, Knutson, Conley, Keszler, Gibbons and Wager186,Reference Alimardani, Cowell, Conley, Evans, Chin, Kilpatrick and Dubey188 However, it is not ideal due to formation of an interfacial compound at the interface with the insulator. This was highlighted by Grover and Moddel,Reference Grover and Moddel173 who anticipated the importance of material selection for a good MIM and that arbitrary combinations of metals and oxides are not always feasible, as for example, Al/Al2O3/PtReference Tiwari, Bean, Szakmány, Bernstein, Fay and Porod189 displays a linear I–V and yet has been successfully shown to work in an antenna-coupled IR detector. A study by Heiblum et al.Reference Heiblum, Wang, Whinnery and Gustafson175 tested Al/Al2O3/Al, Cr/Cr2O3/Au, Al/Al2O3/Ag, and Nb/Nb2O5/Au MIMs by exposing them to an IR laser and concluded their poor rectification properties due to the production of large thermal contributions when exposed to laser radiation. This is a very useful approach, which must be applied to other MIM candidates for solar applications. An alternative concept was previously described (Fig. 16), consisting of a MIM diode based on a TW structure, which although having a symmetrical configuration (Nb/Nb2O5/Nb), outperforms planar type MIM diodes by three orders of magnitude at micrometer wavelength.Reference Grover, Dmitriyeva, Estes and Moddel134
One of the most important findings in this field is a method for characterizing the electrical properties of MIM devices by nanoindentation and later a bent wire technique suggested by Periasamy et al.Reference Periasamy, Berry, Dameron, Bergeson, Ginley, O’Hayre and Parilla150,Reference Periasamy, Guthrey, Abdulagatov, Ndione, Berry, Ginley, George, Parilla and O’Hayre151,Reference Periasamy, Bergeson, Parilla, Ginley and O’Hayre180,Reference Periasamy, O’Hayre, Berry, Parilla, Ginley and Packard185,Reference Periasamy, Bradley, Parilla, Berry, Ginley, O’Hayre and Packard190 The concept is based on a metal being deposited on a silicon substrate, after which a continuous oxide is grown and the second electrode is a bent wire of a desired material. This ensures a small contact area and the ability to characterize a point-contact type MIM junction. This work is very useful as it gives the chance to study various metal–insulator combinations before attempting to optimize planar thin-film diode devices. This technique was used to systematically study the influence the metal workfunction difference has on the electrical properties of MIM diodes.Reference Periasamy, Berry, Dameron, Bergeson, Ginley, O’Hayre and Parilla150 The structures analyzed have a Nb bottom electrode, Nb2O5 insulator grown by anodic oxidation, and eight different Metal 2 selections (Hf, Zr, Nb, Ti, Cu, Ag, Au, and Pt). The result was that the workfunction difference has a direct influence on rectification properties, with the asymmetry increasing sharply for ∆Ф > k BT. This agrees with theoretical predictions and with the models by Simmons.Reference Simmons191 Conversely, nonlinearity FOM displayed no direct correlation with ∆Ф. The highest FOMs were observed for Nb/Nb2O5/Pt, which displayed 1500 asymmetry, 4 nonlinearity, and 20 V−1 responsivity meeting the criteria outlined in Eqs. (18)–(20). Recently, this work was continued through Ref. Reference Chin, Periasamy, O’Regan, Amani, Tan, O’Hayre, Berry, Osgood, Parilla, Ginley and Dubey152, the fabrication of 6400 μm2 planar devices with the same Nb/Nb2O5 base and six metal top contacts (Ag, Cu, Nb, Ni, Au, and Pt). The work confirmed a direct linear relation between increasing asymmetry and increasing ∆Ф with Nb/Nb2O5/Pt showing optimal results with FOMs of 7742 asymmetry, 4.7 nonlinearity, and 52.2 V−1 responsivity. These are to our knowledge the largest FOM values recorded and hence the most promising structure to be successfully integrated into a solar rectenna.
Periasamy et al.Reference Periasamy, Guthrey, Abdulagatov, Ndione, Berry, Ginley, George, Parilla and O’Hayre151 also characterize other oxides with a Nb metal base and Pt bent wire and prove a hypothesis whereby the best rectification properties are expected from using dissimilar metals and low barrier heights at each metal–insulator interface to sooner promote the faster Fowler–Nordheim tunneling in the forward direction. To achieve smaller barriers, high electron affinity insulators must be selected. Due to this reason, Nb2O5 and TiO2 outperform Al2O3 and MgO. Another requirement for the insulator is a large dielectric constant since for small area devices the capacitance is reduced, however due to the requirements for tunneling the ultra-thin thicknesses in turn increase capacitance, which has to be kept to a minimum as per Eq. (2).
Modeling approaches
Modeling MIM devices is a significant challenge due to the many practical aspects of such ultra-thin layers. Interface roughness, pinholes, and fabrication anomalies may all adversely influence device performance, and are difficult to account for reliably in the models. Nevertheless, modeling MIM performance is essential to confirm established experimental results and fully understand device operation as there is always room for improvement. SimmonsReference Simmons191 first proposed a model incorporating the Wentzel–Kramers–Brillouin (WKB) approximation, which is frequently used to reproduce MIM I–V curves. This model is very good at predicting forward characteristics, however it overestimates currents passing in reverse bias, leading to close to symmetric simulated I–V curves for dissimilar metal electrodes. EliassonReference Eliasson168 developed a comprehensive model to predict rectification efficiency, tunneling transmission probability, and estimation of device resistance in thin MIM diodes, with the exception of image forces and effective mass. Recently, Hashem et al.Reference Hashem, Rafat and Soliman192 developed more accurate models to simulate the I–V curves and FOM of MIM devices. The model can be used for multiple insulator layers, whereas Simmons model is only limited to single insulator predictions. These models were shown to accurately trace experimental results reported by Choi et al.Reference Choi, Yesilkoy, Chryssis, Dagenais and Peckerar193 (on a polysilicon/SiO2/polysilicon tunnel diode), whilst Simmons simulations predicted almost linear behavior. With double insulator devices, the models are accurate in forward characteristics, however slightly underestimate the leakage currents in reverse bias. Recent work by Cowell et al.Reference Cowell, Muir, Keszler and Wager194 has developed a model to estimate the barrier height formation and tunneling effective mass of a MIM diode exhibiting Fowler–Nordheim tunneling, which can be used to help assess the impact of different processing conditions on the performance of the device.
Fabrication and characterization
Apart from material selection, the fabrication techniques used to manufacture MIM devices are also important for good device performance. Metal deposition is commonly deposited by sputtering or evaporation, techniques which are well understood, give high quality thin films and are industrially scalable. Controlled deposition of the ultra-thin insulator required for tunneling is a challenge. Anodic oxidationReference Periasamy, Berry, Dameron, Bergeson, Ginley, O’Hayre and Parilla150–Reference Chin, Periasamy, O’Regan, Amani, Tan, O’Hayre, Berry, Osgood, Parilla, Ginley and Dubey152 of the first metal electrode is a good way of controlling growth of a high quality oxide, however, it is limited to only being able to grow the derivative oxide of the underlying metal. For research purposes, pulsed-laser deposition (PLD) supplemented by reflection high energy electron diffraction (RHEED)Reference McMitchell, Tse, Bouyanfif, Jackson, Jones and Lancaster195,Reference Palgrave, Borisov, Dyer, McMitchell, Darling, Claridge, Batuk, Tan, Tian, Verbeeck, Handermann and Rosseinsky196 can be used for monolayer controlled growth of oxide layers. This technique achieves ultra-thin continuous stoichiometric films of extremely high qualities, however PLD is not industrially scalable. Alternatively, reactive magnetron sputtering may be used, but there is some uncertainty over the stoichiometry and thickness control when depositing insulators. One of the most promising growth techniques is ALD, which is a self-limiting deposition process allowing accurate thickness and stoichiometry control similar to RHEED assisted PLD whilst maintaining a comparably high throughput and possibility of industrial scale processing.
MIM device arrays of nanometer gap junctions over square centimeter areas,Reference Miskovsky, Cutler, Mayer, Weiss, Willis, Sullivan and Lerner17 to create metal–vacuum–metal (MVM) tunnel junctions which have similar properties to MIM diodes, also present a fabrication challenge. Common lithographic techniques have been used, but the economically viable techniques are limited to micron scale devices. However, when the common lithographic techniques are supplemented by a recently optimized selective area ALD technology,Reference Gupta and Willis197 tunnel junctions of approximately 1 nm can be produced. This enables designs of antenna-rectifier coupled devices other than the more common planar types, which have great potential for success (see Miskovsky et al.Reference Miskovsky, Cutler, Mayer, Weiss, Willis, Sullivan and Lerner17). Another challenge is fabricating arrays of nanoscaled lateral diodes to be of the same size scale as required for high frequency antennas. Bareib et al. have developed a highly efficient method for producing an array of several million nanodiodes by temperature-enhanced transfer printing.Reference Bareib, Ante, Kälblein, Jegert, Jirauschek, Scarpa, Fabel, Nelson, Timp, Zschieschang, Klauk, Porod and Lugli198 These devices were characterized with a conductive atomic force microscope (C-AFM) setup, which showed good asymmetry in the I–V response of the nanodiodes. An alternative technique was developed by the authors, which involves the deposition in a vacuum of the full MIM layers, followed by colloidal lithography and Ar ion milling to give an array of nanodiodes (Fig. 25), and preliminary C-AFM confirms asymmetry.
SEM image showing an array of nanodiodes produced by growing an MIM multilayer, followed by colloidal lithography and Ar ion milling.

Current MIM tunnel diodes remain limited to rectify the IR part of the solar spectrum due to their RC time constant. In a study to confirm the applicability of MIM diodes to solar rectennas, Grover and ModdelReference Grover and Moddel173 conclude that efficient coupling between antenna and rectifier must be achieved, which implies that the rectifier impedance must be around 100 Ω as identified by Ma and Vandenbosch.Reference Ma and Vandenbosch99 Results by Chin et al.Reference Chin, Periasamy, O’Regan, Amani, Tan, O’Hayre, Berry, Osgood, Parilla, Ginley and Dubey152 show promising improvement in MIM performance, although the structure has a limited current density passing through it due to the relatively thick oxide used (15 nm). MIM diodes appear to be a good candidate for the rectifiers in a solar rectenna and the ever increasing success in modeling, characterization, and fabrication of these multilayered devices have shown their potential.
Metal–insulator–insulator–metal diodes
The addition of another insulating layer was proposed as it would benefit the rectification properties of the tunnel diode. Using MIIM devices, the diode FOMs are improved over the single insulator case. Asymmetry here can be achieved even with similar metal electrodes, as long as the electron affinity of both insulators is different. For the purpose of understanding the concept, we will qualitatively explain the simple case of Metal 1 and 2 being the same and Insulator 1 having a higher electron affinity than Insulator 2. At zero bias, the band structure is the one depicted in Fig. 26(a). When a negative bias is applied to Metal 1 w.r.t. Metal 2, the bands shift as in Fig. 26(b), where the effective tunneling distance, d t, is of the length of both insulator thicknesses and direct tunneling through both insulators is observed. Increasing the negative bias will eventually shift the bands to the situation in Fig. 26(c) and the d t is now shorter, however the electrons will fall into the quantum well (QW), from where the tunneling probability is reduced. By applying a small positive bias to Metal 1 w.r.t. Metal 2, the initial tunneling will occur directly through both insulators as in Fig. 26(d). Increasing the positive bias will shorten the effective d t and the tunneling is again direct but through only one of the insulators [Fig. 26(e)]. A continued increase in the applied positive bias will promote Fowler–Nordheim tunneling, whilst under reverse biasing conditions, electrons will continue to tunnel into the QW. Hence, the origin of the asymmetry in the I–V curves of MIIM diodes with similar metal electrodes is due to the shift in dominant tunneling mechanism during forward and reverse bias and the formation of the QW due to using insulators of dissimilar electron affinity. By using different metal electrons, the rectification properties of MIIM diodes can be further improved.
Ideal band diagram for a MIIM diode with the same metal electrodes (Ф1 = Ф2) and two insulators of equal thickness (χ1 > χ2). (a) No bias situation (V A = 0 V); (b, c) negative bias at Metal 1 (reverse bias); (d, e) positive bias at Metal 1 (forward bias).

If the thickness of the lower electron affinity insulator is increased relative to the other insulator, then the QW will be wide enough to form resonant energy levels.Reference Moddel and Eliasson199,Reference Grover and Moddel200 These quantized resonant tunneling energy levels have electron transmission probabilities higher than that for adjacent energy levels. Therefore, they introduce significant asymmetry into the I–V curveReference Eliasson168 in the opposite direction to the one which would be observed if no resonant tunneling states are present (step MIIM), as discussed and shown by Grover and ModdelReference Grover and Moddel200 (see Fig. 27). Adding extra insulators with resonant levels further increase rectification.Reference Di Ventra, Papp, Coluzza, Baldereschi and Schulz201
Energy-band profiles for the W/Nb2O5/Ta2O5/W MIIM diodes discussed by Grover and Moddel (left) under forward and reverse bias for the resonant (a and c) and step (b and d) diodes, and their corresponding I –V curves also compared to an asymmetric MIM diode (right). Notice how current enhancement for the resonant diode is in forward bias, whilst that for the step diode is in reverse bias. (Reprinted from Ref. Reference Grover and Moddel200, ©2012 with permission from Elsevier.)

MIIM devices were first introduced for solar-based applications by Phiar Corp and patented by Eliasson and Moddel.Reference Moddel and Eliasson199,Reference Eliasson and Moddel202 The performance of MIM and MIIM diodes as IR detectors was compared by Hegyi et al.Reference Hegyi, Csurgay and Porod203 by simulating their responsivity. It was shown that the MIIM diode has 10 times higher responsivity than a derivative MIM diode. This was experimentally shown by Maraghechi et al.Reference Maraghechi, Foroughi-Abari, Cadien and Elezzabi204 who recorded up to 10 times better nonlinearity for a Cr/Al2O3/HfO2/Cr diode compared with Cr/Al2O3/Cr and Cr/HfO2/Cr diodes. A more applicable example, already referred to, is by Grover and Moddel,Reference Grover and Moddel200 who compared their W/Nb2O5/Ta2O5/W structure to an MIM Diode with equivalent barriers as that of a W/Nb2O5 on one side and a W/Ta2O5 on the other side, again clearly showing improved response from the MIIM device (Fig. 27).
Material selection for MIIM diodes has similar criteria to that of MIM, in that the structure has to exhibit one kind of tunneling in one direction and another tunneling mechanism in the other, thus promoting highly asymmetrical nonlinear I–V curves. A significant challenge is fabricating two ultra-thin, stoichiometric, high quality insulators. The appropriate technique for research purposes is RHEED PLD, although ideally ALD would be the better option in terms of prospects for industrial scaling. Alimardani et al.Reference Alimardani, Cowell, Wager and Conley205–Reference Alimardani and Conley207 have researched the use of ALD for depositing the double insulators required to produce efficient MIIM diodes. A recent patentReference Sekar, Kumar, Rabkin and Costa208 proposes the use of a triple-insulator barrier which adds further complexity to the fabrication process. The models created by Hashem et al.Reference Hashem, Rafat and Soliman192 will help identify which material systems to concentrate experimental efforts on. Improved performance from multiple barrier tunnel diodes is yet to be realized but the few reports that exist suggest significant potential. Integration with antenna for solar rectenna would also have to be researched as the addition of extra insulators may have deteriorating effect on the RC constant preventing these devices to be used at high frequencies although their rectification properties are clearly superior.
Geometric diodes
Geometric diodes are devices that display rectification properties due to the difference in charge carrier transport probabilities from one electrode to another as a result of a geometric constraint. An increasingly popular concept patented by ModdelReference Moddel209 consists of a thin film patterned into an inverse arrowheadReference Zhu, Joshi, Grover and Moddel210 configuration shown in Fig. 28(a). The electrodes are placed on the top of the thin film at both ends of the structure. The width of the neck, d neck, is of the same magnitude as the mean-free path length (MFPL) of the thin film material to obtain rectification.Reference Zhu, Joshi, Grover and Moddel210–Reference Grover214 Looking at Fig. 28, an assumption is made by which charge carriers experience specular reflections at the boundaries.Reference Zhu, Grover, Krueger and Moddel211 At zero bias, the distribution of carriers is random and scattered across the left and right side of the structure and no net current flow is observed. Upon applying a bias, carriers gain extra velocity in addition to their random thermal drift. For a plain nonconstrained geometry, there will be equal net flow from one end to the other, which would define a completely linear I–V characteristic (ohmic behavior for perfect conductors). By applying a geometric constraint as the one shown in Fig. 28, the motion of the carriers is influenced and favored in one direction. Carriers moving from the left to right either pass directly through the neck or collide against the angled edge and eventually channel through the neck.Reference Zhu, Joshi, Grover and Moddel210–Reference Moddel, Zhu, Grover and Joshi213 On the right hand side, most of the carriers are blocked and reflected away from the neck by the vertical blocks.Reference Zhu, Joshi, Grover and Moddel210–Reference Moddel, Zhu, Grover and Joshi213 The probability of electrons passing from the left to the right is enhanced over the probability of them passing from right to left due to the funnel-like construction in the forward direction. The neck is required to be of the order of the MFPL, otherwise the probability of electrons passing in reverse direction will increase significantly and compromise the rectification performance.
(a) Schematic of a geometric diode theory of operation. (b) SEM image of a graphene geometric diode with metal contacts developed by Zhu et al. (Reprinted from Ref. Reference Zhu, Joshi, Grover and Moddel210, ©IOP Publishing. Reproduced by permission of IOP Publishing. All rights reserved.)

Neck design is crucial to successful geometric diode performance and is therefore one of the governing factors in the material selection criteria for the device. The material would also have to withstand high current densities through the neck.Reference Zhu, Joshi, Grover and Moddel210 Metals are suitable to be used,Reference Grover and Moddel173 however, their MFPL at room temperature is 10–30 nm,Reference Ashcroft and Mermin215 which complicates the patterning process and requires expensive techniques such as electron-beam lithography. Graphene has been identified as a suitable and promising alternative to be used in geometric diodes.Reference Moddel209–Reference Joshi, Zhu, Grover and Moddel212,Reference Grover214 Advantages of graphene are that the MFPL can be tailored up to 1 µmReference Castro Neto, Guinea, Peres, Novoselov and Geim216 which means that common lithographic techniques can be used for device patterning and fabrication, resistances are low enough to be matched to the antenna impedance,Reference Zhu, Joshi, Grover and Moddel210 and very low capacitance values of the order of 1 aFReference Joshi, Zhu, Grover and Moddel212 lead to a low RC time constant of around 1.6 fs.Reference Zhu, Grover, Krueger and Moddel211 All these benefits identify their potential to be used at IR and even optical frequency rectennas. Recent work on graphene geometric diodes has shown optical frequency rectification at 10.6 µm wavelength radiation (equivalent to 28 THz) matched with both a metal or a graphene bow-tie antenna.Reference Zhu, Joshi, Grover and Moddel210 Further improvement in the design of these diodes could improve the performance of the device and potentially reach operational frequencies in the visible regime.
Rectenna design
Learning from the success in optimizing the microwave rectenna, it can be seen that appropriate circuit design is of paramount importance for increasing the performance and efficiency of the device. The solar rectenna is an entirely different challenge as it is constrained by physical limitations and complex material selection criteria and trade-offs. Research is mainly concentrated toward manufacturing and characterization of antenna and rectifier components, where novel technologies are emerging and great improvement has been seen over the years. Nevertheless, designing the best rectenna architecture is as equally important as optimizing its two main constituents. There are many publication on antenna-coupled rectifiers used for opticalReference Knight, Sobhani, Nordlander and Halas98,Reference Gustafson, Schmidt and Perucca184,Reference Fukuda, Aihara, Yamaguchi, Ling, Miyaji and Tohyama217–Reference Satoh and Inokawa219 or IRReference Fumeaux, Herrmann, Kneubühl and Rothuizen108,Reference Grover, Dmitriyeva, Estes and Moddel134,Reference Wilke, Oppliger, Herrmann and Kneubühl176,Reference Abdel-Rahman, González and Boreman177,Reference Tiwari, Bean, Szakmány, Bernstein, Fay and Porod189,Reference Bareib, Tiwari, Hochmeister, Jegert, Zschieschang, Klauk, Fabel, Scarpa, Koblmüller, Bernstein, Porod and Lugli220–Reference Enderra, Gonzalo, Martinez, Alderman, Huggard, Murk, Marchand and de Maagt222 sensing whereas, to the best of our knowledge, there is no antenna-rectifier device reported to harvest electromagnetic energy at the high solar frequencies. The gap between sensing and harvesting lies in how efficiently the incoming signal is converted and this is what limits the realization of a true working solar rectenna. We review a few rectenna architectures proposed in the literature, which could result in future success.
Rectennas can either be designed as a planar device or have a geometrical constraint. The diode is used as a passive component with the sole purpose of rectifying the AC signal generated from the antenna. In this case, the requirements for the diode are emphasized on low resistance and capacitance (resulting in high cut-off frequency), and high I–V asymmetry at a small bias (implying low leakage current and low turn-on voltage). Both planar and geometric designs are suitable for using this function of the diode. The following three architectures utilize the diodes ability to rectify current.
Figure 29 shows a dipole antenna coupled with a MOM diode based on an Al/AlOx/Pt structure. This type of architecture is used for IR detectionReference Grover, Dmitriyeva, Estes and Moddel134,Reference Abdel-Rahman, González and Boreman177,Reference Tiwari, Bean, Szakmány, Bernstein, Fay and Porod189,Reference Bareib, Tiwari, Hochmeister, Jegert, Zschieschang, Klauk, Fabel, Scarpa, Koblmüller, Bernstein, Porod and Lugli220 and up to 28 THzReference Abdel-Rahman, González and Boreman177 can be sensed with a Ni/NiO/Ni diode. Arrays of the structure can be fabricated either with e-beam lithography or a more economical nanotransfer printing process, which does not compromise the quality of the tunnel junction.Reference Bareib, Tiwari, Hochmeister, Jegert, Zschieschang, Klauk, Fabel, Scarpa, Koblmüller, Bernstein, Porod and Lugli220 This design gives the benefit of producing small area diodes directly coupled to an antenna, which can be tailored to the length scale of the desired operating frequency. With appropriate material selection and improved impedance match, the cut-off frequency can be increasedReference Abdel-Rahman, González and Boreman177 and electromagnetic energy could potentially be harvested rather than just detected.
Schematic diagram of an infrared detector proposed as a suitable design for a solar rectenna. The structure consists of a dipole antenna coupled to a metal–oxide–metal diode. (Reprinted from Ref. Reference Tiwari, Bean, Szakmány, Bernstein, Fay and Porod189, ©2009 with permission from American Vacuum Society.)

A common approach in rectenna design is a simple planar structure which is composed of antenna-rectifier arrays on a single chip [Fig. 30(a)]. The size of the individual rectennas in the array depends on the aimed harvesting frequency, i.e., for the visible range the rectennas should be of nanoscale dimensions whereas micro-scale would suffice for the near-IR. Alternatively, the device can be designed as having a common rectifier with an array of antennas [Fig. 30(b)] – bowtie, patch, spiral, etc. The limitations are impedance matching and antenna and rectifier cut-off frequency. With the ever increasing technological advances and device modeling, the necessary goals are seen as realistic and feasible.
Schematic diagram of a MIM-based planar-style rectenna architecture with (a) rectenna array and (b) antenna array with common rectifier.

Finally, Fig. 31 shows schematics of the approach proposed by Miskovsky et al.Reference Miskovsky, Cutler, Mayer, Weiss, Willis, Sullivan and Lerner17 This design consists of an array of needle-like nanostructures, which have been designed to utilize a geometric constraint for the tunneling mechanism. At the tip of each nanostructure, a 1 nm junction is formed which can either form a MVM-type barrier or if an insulator is placed then the barrier will be an MIM-type. The fabrication of this type of structure is very complex, but was recently optimized by use of selective area ALD – a technique developed and patented by Prof. Brian Willis of the University of Connecticuit.Reference Gupta and Willis197 Similar design can be implemented with the described graphene geometric diodeReference Zhu, Joshi, Grover and Moddel210 where instead of leaving a tunnel junction, the tip of the needle-like nanostructure is brought close to the collector electrode. This rectenna design is very promising and yet to be optimized in terms of material selection, ease of manufacturing, and reliability.
Schematic diagram of the rectenna design proposed by Miskovsky et al. showing a top (a), side (b), and 3D (c) view. (Reprinted from Ref. Reference Miskovsky, Cutler, Mayer, Weiss, Willis, Sullivan and Lerner17, ©2012 N.M. Miskovsky et al.)

Another planar device design has already been introduced in section “Rectifier: Schottky barrier diodes”, whereby the rectifier is used as an active component producing a current enhancement as a result of hot-electron injection into the metal and crossing over a Schottky barrier, which is seen as a reverse current enhancement in an I–V plot (similar to what is observed during the PV effect). The design necessitates a diode with low barrier height, low leakage current and a suitable top metal to increase the amount of electrons excited to a higher energy state. It must be made clear that this device, although having components similar to a rectenna, is fundamentally different to the rectenna. With rectennas, the aim is to optimize the absorption by a load, whereas for hot-electron devices it is in optimizing the absorption efficiency of the LSPR nanoparticle. A good review of hot-electron devices can be found in Ref. Reference Clavero223. Efficiency estimates for rectennas prevail to those for hot-electron devices, although this remains an intriguing field for future development.
Socioeconomic impact and future work
The defining milestone for the rectenna was the Raytheon development of the microwave rectenna in the 1960s.Reference Brown14 The ability to capture background radiation to demonstrate a working device, a helicopter no less, was a remarkable achievement. Concerns regarding energy security have led to a growing interest in harvesting solar radiation – a huge source of energy offering roughly 350 W/m2. In 2011, the International Energy Agency predicted that solar energy technologies such as PV panels, solar water heaters, and power stations built with solar collector mirrors could provide a third of the world's energy by 2060. Unsurprisingly, there was no mention of a rectenna device because there has never been a successful demonstration of a solar rectenna with even modest efficiencies of a few percent.
Solar cells made of silicon have already made a huge impact in a whole range of devices that use Si cells for power and they have also made a tremendous socioeconomic impact in developing countries. It is worth recalling that around 1.2 billion people on our planet have no access to power and about 2.8 billion people use solid fuels (wood, charcoal, coal, and dung) for cooking and heating.224 Every year fumes and smoke from open cooking fires kill approximately 1.5 million people mostly women and children, from emphysema and other respiratory diseases and therefore a key responsibility for scientists and engineers is to carry out research to address such inequality. The advent of “plastic electronics” offers the possibility of inexpensive, flexible solar cells using semiconductors albeit at lower efficiencies of around 5–10%.
The rectenna is simply another means of collecting background radiation whether it be at optical frequencies in the solar spectrum (430–790 THz) or at IR frequencies (0.3–430 THz) meaning that cells could operate at night. The ultimate goal then of a rectenna is to augment current technologies and with current low frequency efficiencies of over 90%, the incentive to carry out research is obvious. However, the situation is not so simple and the key observation is that as the frequency of operation of the rectenna rises, the efficiency drops so that at solar frequencies most predicted efficiencies are a fraction of one percent. Here then is the first research challenge: to increase the efficiency to match at least the PV efficiencies offered by low cost plastic electronic solar PV (5–10%). Second, a rectenna device capable of operation at solar frequencies, which is a tremendous fabrication challenge with diodes of nanometer dimensions needed. Using expensive e-beam lithography techniques may demonstrate proof of principle but are too costly for commercialization. Therefore, the engineering challenge is to find inexpensive fabrication techniques capable of scale-up and able to provide the efficiencies required.
So what are the prospects? There is little doubt that the task is hard – low cost fabrication of nanoantennas and diodes of nanometer dimensions is nontrivial. But the rewards are significant. Perhaps most important is that, as noted in section “Efficiency limits”, there is no scientific reason suggesting that a rectenna device operating at solar frequencies should not be capable of efficiencies in the region of 10% and ideally far greater. This then is the challenge and the potential reward is reason alone why there are several laboratories exploring such technologies. Let us be bold and assume success in this goal. What would be the implications? First of all, to have developed the technologies to fabricate the nanoantennas and diodes using scalable manufacturing processes would provide an extra option to the generation of energy. Second, success would not only impact upon a wide range of energy technologies but would be transferable such that it would also transform wide range of technologies associated with for example the health, transport, and infrastructure sectors. These sectors are fundamental to our socioeconomic progress.
This review has identified many positive points on the development of the solar rectenna. Modeling the conversion efficiency has been attempted on many occasions, however as seen in Fig. 8 the many different assumptions predict a wide spread of efficiency values. The scientific community understands the operational theory of the device but further work is required to confirm and identify the major contributing loss and gain effects to accurately predict the efficiency. There is also lack of experimentally derived efficiency results at the high solar frequencies as research was until now mainly concentrated on developing new technology for nanofabrication and optimization of antennas and diodes, modeling device response, and theoretically estimating matching suitability. In the course of this review, new developments have been highlighted, which have given promising results for both the antenna and the rectifier. The technology is mature enough for it to be used to fabricate and characterize prototype rectenna devices. Testing prototypes will help identify further work, which needs to be carried out on the antenna and rectifier. A very useful methodology has been developed to characterize materials for MIM diodes and some experimental results of actual devices have been reported, identifying potential diodes which could be branded with having ideal I–V characteristics and far exceed the minimum FOM requirements. However, these diodes need to be characterized for their cut-off frequency and matching with an antenna. Work on the other rectifiers (MIIM and geometric diodes) is yet too undeveloped to have conclusive results, but provisional tests show great potential and they must be pursued and optimized.
In summary, despite the fact that Tesla suggested the transference of energy through electromagnetic radiation in the 1890s and despite the practical development of rectennas in the 1960–70s, the goal of solar rectification, or even large transfers of high-frequency power, has not yet been realized at the efficiencies we need. The two key issues that we need to address are to increase the efficiencies to useable levels, here suggested at 5–10%, and to develop low cost scalable manufacturing routes. The secondary goal is to increase the efficiency and here we can only speculate but we should harbor an ambition to obtain efficiencies exceeding that of the best solar cells tested to date of around 45%.225
Summary
In this article, the history and operation of the rectenna device have been reviewed from its initial concept as a receiver in MPT through to developments in pursuit of high-efficiency solar harvesting. Rectennas have been studied extensively for application in wireless energy transmission by use of man-made microwave energy with conversion efficiencies as high as 92%, which brings optimism to the goal of beating the Shockley–Queisser limit by achieving high-efficiency solar rectenna energy converters. Efficiency trends have been reviewed, where experimentally obtained efficiency values for rectenna devices have shown an overall decrease with an increase in operating frequency. Although there is no agreement on an optimized model for characterizing the performance of a rectenna, all theoretical work suggests that to improve efficiency, three criteria must be met – (1) efficient absorption by the antenna at the desired frequency, (2) a high cut-off frequency diode to efficiently rectify the incoming signal, and (3) impedance matching between antenna and rectifier to avoid signal transfer losses. Solving these three challenges would result in efficient device operation, which has the potential of operating at higher thermodynamic efficiency than current PV cells. Work on improving the performance of the antenna and rectifier has been reviewed showing substantial technological advancement and improved theoretical understanding of these two device components. Rectenna design also plays a major role in optimizing the device and a few architectures have been discussed for their suitability. It was finally argued that the most essential future work required is to build rectenna devices based on optimized technology and design, as this is currently lacking in the literature. Attempts have been made on antenna-rectifier devices which have been aimed to work as IR or visible light sensors. Fabricating rectenna prototypes will enable scientists to characterize and assess their performance, giving them opportunity to identify new areas for necessary optimization.
Acknowledgments
This work was supported in part by EPSRC grant number EP/G060940/1. Peter M. Gammon would like to gratefully acknowledge the financial support from the Royal Academy of Engineering. Jing S. Pang and Peter K. Petrov acknowledge the financial support under the King Abdullah University for Science and Technology (KAUST), Global Collaborative Research Academic Excellence Alliance (AEA), and Academic Partnership Programs (APP).