

Most dairy cows experience a phase of negative energy balance during the transition period (Herdt, Reference Herdt2000). Lipolysis, a consequence of a negative energy balance, can be measured by elevated serum concentrations of NEFA and BHBA (Herdt, Reference Herdt2000; McArt et al. Reference McArt, Nydam, Oetzel, Overton and Ospina2013). Both are risk factors for several postpartum diseases (McArt et al. Reference McArt, Nydam, Oetzel, Overton and Ospina2013). Critical thresholds for NEFA and BHBA have been determined for the prepartum (i.e. NEFA = 0·3 to 0·5 mEq/l, BHBA = 0·8 mmol/l) and postpartum (i.e. NEFA = 0·7 to 1·0 mEq/l, BHBA = 1·2 to 1·4 mmol/l) periods (McArt et al. Reference McArt, Nydam, Oetzel, Overton and Ospina2013), respectively. Although BHBA is a commonly used parameter, NEFA concentrations, both pre- and postpartum, offer more information on odds of negative health outcomes than BHBA (Chapinal et al. Reference Chapinal, Carson, Duffield, Capel, Godden, Overton, Santos and LeBlanc2011). Several electronic measuring devices have been validated for on farm testing of BHBA in dairy cows (Iwersen et al. Reference Iwersen, Falkenberg, Voigtsberger, Forderung and Heuwieser2009, Reference Iwersen, Klein-Jobstl, Pichler, Roland, Fidlschuster, Schwendenwein and Drillich2013; Mahrt et al. Reference Mahrt, Burfeind, Voigtsberger, Muller and Heuwieser2014). Unfortunately, there is no device for on farm testing for NEFA available so far.
Besides BHBA, other metabolites in the lipid metabolism have been shown to be associated with NEFA and periparturient disease. Prepartum levels of cholesterol are a predictor of retained placenta in dairy cows in addition to NEFA (Quiroz-Rocha et al. Reference Quiroz-Rocha, LeBlanc, Duffield, Wood, Leslie and Jacobs2009). Furthermore, triglycerides (TAG) and NEFA are both associated with fatty liver (Bobe et al. Reference Bobe, Young and Beitz2004) and an increase in postpartum liver TAG concentrations is accompanied by an increase in plasma NEFA concentrations (van den Top et al. Reference van den Top, Wensing, Geelen, Wentink, van't Klooster and Beynen1995). Besides cholesterol and TAG, high-density lipoproteins (HDL) are related to the lipid metabolism during the transition period (Kurpinska et al. Reference Kurpinska, Jarosz, Ozgo and Skrzypczak2015).
Hand-held devices for measuring cholesterol, triglycerides (TAG), and high-density lipoproteins (HDL) are commercially available in human medicine (Accutrend® Plus system, Roche Diagnostics, Indianapolis, USA; CardioChek® PA, PTS Diagnostics, Indianapolis, USA). These devices have been shown to be a valid alternative to laboratory analysis (Coqueiro et al. Reference Coqueiro, Santos, Neto, Queiroz, Brugger and Barbosa2013; Ferreira et al. Reference Ferreira, Franca, Correr, Zucker, Andriolo and Scartezini2015).
Therefore, the objective of this study was to evaluate the association between different parameters related to lipid metabolism and to find out if those parameters could be used to predict the concentration of NEFA. Specifically, we set out to determine the relationship of BHBA, cholesterol, TAG and HDL to NEFA and to study, if BHBA, cholesterol, TAG and HDL could serve as surrogates for NEFA both before and after calving by means of point of care systems.
Materials and methods
A total of 254 primi- (n = 88) and multiparous (n = 166) Holstein dairy cows from a commercial dairy farm in Saxony-Anhalt, Germany were included in the trial. Sixty-six prepartum samples had to be excluded from cows that did not calve within 10 d after first sample collection, resulting in 188 prepartum samples. The farm housed approximately 1200 cows in a freestall barn with an average 305d-lactation of 10 124 kg (4·1% fat, 3·4% protein). Close-up cows were housed in groups of approximately 12 cows with deep-straw bedding and fed a total mixed ration once a day at 0700 h. Feed was pushed up several times a day. Fresh cows were housed in groups of approximately 20 cows with slatted floors and cubicles equipped with rubber mats. A total mixed ration was delivered over a conveyer belt system 10 times per day. Cows were milked three times daily in a 52 stall rotary milking parlor.
Data was collected between May and August 2010. One blood sample was taken from each cow between d 10 and d 1 prepartum. Second and third samples were collected on d 2 and d 10 postpartum, respectively. All experimental procedures reported herein were conducted with the approval of the Institutional Animal Care and Use Committee of Freie Universität Berlin.
Blood samples were collected from the coccygeal vein using sterile 9 ml tubes without anticoagulant (Venoject II, Termumo Europe N.V., Leuven, Belgium). The measurement of BHBA was conducted within 30 s after blood sampling on farm with an electronic BHBA ,measuring device (Precision Xceed, Abbott Diabetes Care Ltd., Witney, UK) that had been validated and used in several studies (Bach et al. Reference Bach, Heuwieser and McArt2016; Iwersen et al. Reference Iwersen, Falkenberg, Voigtsberger, Forderung and Heuwieser2009; Mahrt et al. Reference Mahrt, Burfeind, Voigtsberger, Muller and Heuwieser2014). After BHBA measurement blood was allowed to clot. For NEFA, cholesterol, TAG and HDL the concentration was measured by laboratory analysis because hand-held devices for measuring these parameters are not validated yet for the use in dairy cattle. Blood samples were centrifuged within 2 h after sampling at 1000 g for 10 min at ambient temperature and serum was separated and stored at −22 °C until analysis. The serum samples were sent to an accredited, commercial lab (Synlab Laboratories, EU accreditation number: D-PL-14016-01-00, accreditation body: DAkkS, Berlin, Germany). The concentration of NEFA was measured with a clinical chemistry analyser (AU 680, Beckman Coulter, Krefeld, Germany) and a testkit from Randox by photometric measurement. The lower limit of quantitation was 0·07 mmol/l. The inter- and intraassay coefficients of variation were 2·3 and 2·9%, respectively, for NEFA. For the determination of cholesterol an enzymatic assay with cholesterol oxidase, phenol and 4-aminophenazone was used based on the formation of a quinoneimine dye. The rate of colour development was measured spectrometrically at 540/600 nm. In order to determine TAG an enzymatic assay with glycerol-3-phosphate oxidase, phenol and 4-aminophenazone was used producing a chromophore which was read at 660/800 nm. The inter- and intra-assay coefficients of variation were 2·7 and 0·7%, respectively, for cholesterol and 3·9 and 1·8%, respectively, for TAG. For the determination of HDL an enzymatic assay with cholesterol esterase, cholesterol oxidase and a chromogen system was used to yield a blue colour complex which was measured bichromatically at 600/700 nm. For HDL the inter- and intraassay coefficients of variation were validated for two different concentrations but for humans only. The inter- and intra-assay coefficients of variation were 3·08 and 1·32%, respectively, for a low concentration and 4·79 and 4·79%, respectively, for a high concentration.
Statistical analysis
A total of 188 cows were sampled between d 10 and d 1 prepartum. Of those, 181 samples had sufficient laboratory results and were used for statistical analysis. In total, 254 cows were sampled postpartum. Of those, 246 cows had laboratory results from d 2 postpartum, 245 cows had results from d 10 postpartum and were used for statistical analysis. Data were entered into Excel spreadsheets (version 2010; Microsoft Corporation, Redmond, WA) and statistical analyses were performed with IBM SPSS Statistics for Windows software (version 20.0; IBM Deutschland GmbH, Ehningen, Germany) and MedCalc for Windows (version 12.0.3.0., MedCalc Software bvba, Mariakerke, Belgium). The level of significance for all statistical tests was set at P < 0·05. The normal distribution of NEFA, BHBA, cholesterol, TAG and HDL was assessed by plotting and visually examining the data and performing a Kolmogorov–Smirnoff-test.
All statistical analyses were carried out separately for 4 different sample sets. In order to include a longer time frame to take samples prepartum, which would be beneficial in practice, an early prepartum sample set (i.e. d 10 to 1; n = 181) was defined. To find out if the predictive value improved before calving a late prepartum sample set (i.e. d 3 to 1; n = 91) was defined which included eligible samples of the early prepartum sample set. After calving, an early postpartum (i.e. d 2 postpartum; n = 246) and a late postpartum (i.e. d 10 postpartum; n = 245) sample set were defined and analysed. The degree of association between BHBA, cholesterol, TAG, and HDL with NEFA was determined by computing Spearman's rank correlation coefficients. For the prediction, if the NEFA concentration exceeded a certain value and for the determination of thresholds of the predicting variables, receiver operator characteristic analysis (ROC) was used. The predicting variables were either single analytes (i.e. BHBA, cholesterol, TAG, HDL) or a combination of these analytes utilising a modified procedure. The aim of the second approach was to determine thresholds for a combination of predicting variables and to calculate Se and Sp for the determination of NEFA if 1, 2, 3 or 4 of the predicting variables were higher than the thresholds. Because the ROC analysis only allows 1 predicting variable, BHBA, cholesterol, HDL and TAG concentrations were transformed into binary variables (i.e. 0 and 1) and a dummy variable was calculated to be used for the ROC analysis. The dummy variable equalled the sum of the recoded BHBA, cholesterol, HDL and TAG values and could range from 0 (i.e. all variable below the threshold) to 4 (i.e. all variables above the threshold). Thresholds for the recoding of BHBA, cholesterol, HDL and TAG were chosen at random and the calculations were repeated until the highest area under the curve (AUC) for the prediction of NEFA was achieved. The Se was defined as the proportion of positives that were correctly identified as cows over the critical NEFA threshold. The Sp was defined as the proportion of negatives that were correctly identified as cows below the critical NEFA threshold. In accordance with McArt et al. (Reference McArt, Nydam, Oetzel, Overton and Ospina2013) the following critical thresholds for NEFA were chosen: 0·3 and 0·5 mEq/l prepartum and 0·7 and 1·0 mEq/l postpartum. Additionally, the AUC, positive predictive value (PPV) and the negative predictive value (NPV) were calculated utilising the prevalence in the study population. The calculations were conducted for three different scenarios. Firstly, a combination in which BHBA, cholesterol and TAG were treated equally was analysed. Secondly, BHBA was set as a fixed parameter (i.e. BHBA level had to exceed a certain threshold for the sum of predicting variables to be positive) and combined with cholesterol and TAG. We used BHBA as a fixed parameter because it is the most common metabolite to assess negative energy balance in transition cows and hand-held measuring devices are already validated in cows. Thirdly, a combination of only BHBA and cholesterol was tested.
Results and discussion
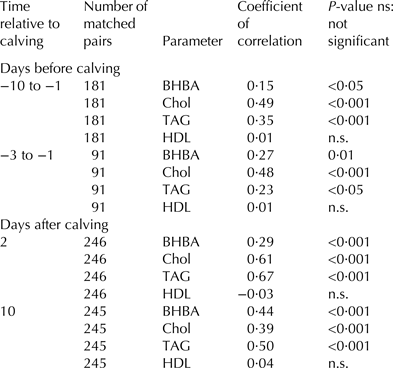
Prepartum mean NEFA concentration was 0·22 ± 0·24 mEq/l (min = 0·07; max = 2·51 mEq/l). Postpartum NEFA averaged 0·65 ± 0·49 mEq/l (min = 0·07; max = 2·65 mEq/l). Before and after calving NEFA concentrations were weakly or moderately correlated with BHBA, TAG and cholesterol (P < 0·05; Table 1). No significant correlation was found between NEFA and HDL (P > 0·05).
Coefficients of correlation between the concentration of nonesterified fatty acids (NEFA in mEq/l) and the concentrations of β-hydroxybutyrate (BHBA in mmol/l), cholesterol (Chol in mmol/l), triglycerides (TAG in mmol/l) and high-density lipoproteins (HDL in mmol/l)

With BHBA as a surrogate measure the prediction of a NEFA concentration ≥0·3 mEq/l prepartum was not significant (P > 0·05). A NEFA concentration ≥0·5 mEq/l prepartum could be predicted with an AUC = 0·77–0·81; however, the positive predictive value (PPV) was low (i.e. PPV = 0·17–0·27). Considering these results, a high percentage of cows predicted with a NEFA concentration ≥0·5 mEq/l would be false positives and would undergo unnecessary treatment. Postpartum a NEFA concentration ≥0·7 and 1·0 mEq/l could be predicted with a PPV = 0·31–0·57 (AUC = 0·64–0·78).
When using cholesterol prepartum a NEFA concentration ≥0·3 and 0·5 mEq/l could be predicted with a high sensitivity (i.e. Se = 0·9–1·0), however, the specificity was low (i.e. Sp = 0·37–0·48; AUC = 0·59–0·65). Postpartum, the best results were found on d 2 after calving for predicting a NEFA concentration ≥0·7 mEq/l (i.e. AUC = 0·77; Se = 0·86; Sp = 0·66; PPV = 0·6; NPV = 0·89).
The usability for TAG as a prepartum predictor was low (i.e. AUC = 0·54–0·57). Better results were found for TAG on d 2 postpartum (i.e. AUC = 0·84; Se = 0·77; Sp = 0·86; PPV = 0·77; NPV = 0·87).
Neither pre- nor postpartum NEFA concentrations could be predicted utilising HDL (P > 0·05).
The prediction of NEFA by only one parameter was not sufficient, because either Se, Sp, or PPV was low. With a low Se, a high percentage of ill cows would not be found and remain without treatment. With a low specificity, a high percentage of healthy cows would be identified as ill and falsely treated.
The weak correlation between transition period NEFA and BHBA is in accordance with the results found by McCarthy et al. (Reference McCarthy, Mann, Nydam, Overton and McArt2015) who identified a low correlation between postpartum NEFA AUC and postpartum BHBA AUC (r = 0·26). No significant correlation was found between prepartum BHBA AUC and prepartum NEFA AUC (P > 0·05). Although early lactation studies suggested that the peak of mean NEFA concentration occurs before the peak of the mean BHBA (Hammon et al. Reference Hammon, Sturmer, Schneider, Tuchscherer, Blum, Engelhard, Genzel, Staufenbiel and Kanitz2009; Janovick et al. Reference Janovick, Boisclair and Drackley2011), McCarthy et al. (Reference McCarthy, Mann, Nydam, Overton and McArt2015) observed that the largest proportion of cows had maximum NEFA and BHBA concentrations on the same day. It was suggested that the reason for the low correlation might be that ketone synthesis not only depends on energy balance and availability of intermediates in the Krebs cycle, but could also be related to individual differences in hepatic gluconeogenic capacity (Reynolds et al. Reference Reynolds, Aikman, Lupoli, Humphries and Beever2003; McCarthy et al. Reference McCarthy, Mann, Nydam, Overton and McArt2015). Furthermore, sources of carbon other than NEFA (e.g. lactate and ketogenic amino acids) contributing to BHBA synthesis might be an explanation for the weak relationships between blood concentrations of NEFA and BHBA (McCarthy et al. Reference McCarthy, Mann, Nydam, Overton and McArt2015). The low associations between NEFA, cholesterol and HDL, respectively, might be due to physiological changes in lipid metabolism during the transition period. Kurpinska et al. (Reference Kurpinska, Jarosz, Ozgo and Skrzypczak2015) observed a decrease of total cholesterol and HDL in the last month of pregnancy and an increase in the first 2 months of lactation. An increased requirement of foetal tissues as well as maternal glands for steroid hormones synthesis is likely to be the reason for the decrease of cholesterol during the last stage of pregnancy (Turk et al. Reference Turk, Juretić, Gereš, Turk, Rekić, Simeon-Rudolf, Robić and Svetina2005). In contrast to cholesterol and HDL, the concentration of TAG was rather stable during lactation (Kurpinska et al. Reference Kurpinska, Jarosz, Ozgo and Skrzypczak2015).
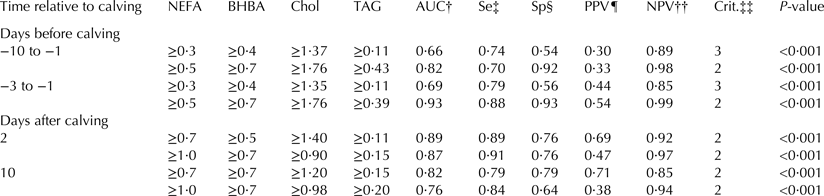
For the second part of our analysis, we combined the parameters mentioned above in order to achieve higher AUC, Se and Sp. Because a correlation between NEFA and HDL was not found and the prediction of a certain NEFA concentration by ROC analysis was not significant, HDL was not used in these analyses and the dummy variable was only calculated as the sum of BHBA, cholesterol and TAG (Table 2). A NEFA concentration ≥0·5 mEq/l between d 3 and d 1 prepartum could be predicted with a high reliability (i.e. Se = 0·88; Sp = 0·93; AUC = 0·93), if two or more parameters exceeded the calculated cut points (i.e. BHBA ≥0·7 mmol/l; cholesterol ≥1·76; TAG ≥0·39 mmol/l). After calving predictive values improved as well compared to the calculations using only one parameter (Table 2). After calving, the highest Se and Sp was found on d 2 postpartum for the prediction of a NEFA concentration ≥1·0 mEq/l by a combination of BHBA ≥0·7, cholesterol ≥0·9 and TAG ≥ 0·15 mmol/l in which the parameters were treated equally (i.e. Se = 0·91; Sp = 0·76; AUC = 0·87).
Receiver-operator characteristic curve determination of critical β-hydroxybutyrate (BHBA in mmol/l), cholesterol (Chol in mmol/L) and triglycerides (TAG in mmol/l) thresholds as predictors of nonesterified fatty acid (NEFA in mEq/l) concentrations considering a combination in which β-hydroxybutyrate, cholesterol and triglycerides were treated equally

† AUC, area under the curve.
‡ Se, sensitivity.
§ Sp, specificity.
¶ PPV, positive predictive value.
†† NPV, negative predictive value.
‡‡ Crit., number of parameters above threshold.
If BHBA was chosen as a fixed parameter, results were inferior to the approach using all parameters in an equal combination as mentioned above. The highest Se and Sp (i.e. Se = 0·75; Sp = 0·94; AUC = 0·83) was found between d 3 and d 1 prepartum for the prediction of a NEFA concentration ≥0·5 mEq/l by a combination of BHBA ≥0·7, cholesterol ≥1·76 and TAG ≥0·39 mmol/l.
In our last approach, BHBA was combined only with cholesterol, because it would be more convenient in practice to just measure two parameters instead of 3 and for both of which hand-held measuring devices are commercially available. However, those results were overall lower than the equal combination approach. The highest Se and Sp (i.e. Se = 0·75; Sp = 0·94; AUC = 0·83) was found between d 3 and d 1 prepartum for the prediction of a NEFA concentration ≥0·5 mEq/l by a combination of BHBA ≥0·7l and cholesterol ≥1·80 mmol/l.
Based on our data the equal combination of all three parameters (BHBA, cholesterol and TAG) showed the best results to determine if NEFA concentrations exceeded a certain threshold.
The approach to combine different variables to improve ROC analysis was used in other studies before. In human medicine Pepe et al. (Reference Pepe, Cai and Longton2006) combined multiple biomarkers for cancer in order to maximise the AUC. In another study, clinical signs were combined and a standard operating procedure established in order to predict the time of parturition in cattle (Streyl et al. Reference Streyl, Sauter-Louis, Braunert, Lange, Weber and Zerbe2011). For the prediction of NEFA the combination of multiple surrogate measures (i.e. BHBA, cholesterol and TAG) has not been used before, but could be an alternative to the prediction by only one parameter. For some of our calculations we used BHBA as a fixed parameter because hand-held measuring devices for BHBA have been already validated for the use in cattle. However, we found that an equal combination of BHBA, cholesterol and TAG generated better results and thus the use of hand-held devices for measuring cholesterol and TAG in cows should be considered. Hand-held devices for cholesterol and TAG are already validated for the use in human medicine (Coqueiro et al. Reference Coqueiro, Santos, Neto, Queiroz, Brugger and Barbosa2013; Ferreira et al. Reference Ferreira, Franca, Correr, Zucker, Andriolo and Scartezini2015) and have been used in cats to measure blood TAG concentrations (Kluger et al. Reference Kluger, Dhand, Baral, Snow, Malik and Govendir2010). For our purpose, however, the measuring ranges in human medicine are too high (Kluger et al. Reference Kluger, Dhand, Baral, Snow, Malik and Govendir2010) and have to be adapted to cows. Therefore, in our study the concentration of cholesterol and TAG was measured by laboratory analysis. We are aware of the fact that this method is not suitable for daily use in practice. However, we suggest that further research for the usage of human medicine hand-held measuring devices for cholesterol and TAG in cows should be conducted based on our findings.
The objective of this study was to determine if 4 parameters related to lipid metabolism (i.e. BHBA, cholesterol, TAG and HDL), for which hand-held measuring devices are commercially available for cows (i.e. BHBA) and in human medicine (i.e. cholesterol, TAG and HDL), correlate with the concentration of NEFA and to evaluate if those devices could potentially serve as surrogate measures for NEFA. In conclusion, prepartum a NEFA concentration ≥0·5 mEq/l could be predicted with a high accuracy when using a combination of BHBA, cholesterol and TAG as surrogates. Although this method would not predict the exact NEFA value, it can predict if NEFA is over a certain threshold and therefore provides insight in the lipid metabolism and helps to identify high risk cows. Further investigations about the usage of hand-held devices for measuring cholesterol and TAG which are only used and validated in human medicine so far are necessary before this method can be applied in practice considering the test characteristics of the hand-held devices. The study was conducted on only one farm and breed during a relatively short season. These circumstances are a limitation and further research is warranted considering multiple farms and longer time periods. In the future, the combination of BHBA, cholesterol and TAG might serve as an alternative to laboratory analysis in order to predict if NEFA concentrations are above a certain threshold.
We gratefully thank the farm personnel of the dairy farm for the kind cooperation. The support of Daniel Stiles for generating the manuscript is gratefully acknowledged. Julia Ruoff was partly funded by Tiergyn e.V. (Berlin, Germany).