Introduction
The Bilibino NPP is one of the smallest nuclear power plants ever operated in the world. It is located in the Chukotka Autonomous Okrug, near the city of the same name. The construction of this plant was driven by the expansion of gold mining activities and by the lack of highways and railways in the Bilibino‑Chaunsky mining region.
Construction work began in 1966. Between 1974 and 1977, four power units with EGP‑6 reactors were successively commissioned. The EGP‑6 is a graphite‑water reactor with an electrical capacity of 12 MW per unit, whose predecessors include the AM reactor (Obninsk NPP) and the AMB‑100 reactor (Beloyarsk NPP). Currently, all reactors of the Bilibino NPP have been shut down: one was decommissioned in 2018, and the remaining three were decommissioned in 2025.
During the operation of low‑power reactors, as well as higher‑capacity power reactors, a certain amount of radionuclides is released into the atmosphere. One of the main dose‑forming radionuclides in releases from nuclear reactors of any type is 14C (UNSCEAR 2000; Ekidin et al. Reference Ekidin, Zhukovskii and Vasyanovich2016; Vasyanovich et al. Reference Vasyanovich, Ekidin, Vasilyev, Kryshev, Sazykina, Kosykh and Kapustin2019). Since the EGP‑6 is a scaled‑down version of the RBMK, radiocarbon formation in this reactor type occurs through the following mechanisms (Gaiko et al. Reference Gaiko, Korablev, Solov’ev, Trosheva, Shamov, Umanets and Shcherbina1985; IAEA 2004; Konstantinov et al. Reference Konstantinov, Korablev, Solov’ev, Shamov, Fedorov and Litvinov1989; Narkunas et al. Reference Narkunas, Smaizys, Poskas and Kilda2010):
In the graphite moderator 14C is formed mainly by the reactions 13C(n,γ)14C and 14N(n,p)14C (∼ 88.2% of total production). However, most of the formed 14C remains in the graphite during reactor operation and is not released into the atmosphere (Galy et al. Reference Galy, Toulhoat, Moncoffre, Pipon, Bérerd, Ammar, Simon, Deldicque and Sainsot2018);
In the nitrogen purging circuit (metal structures): 14N(n,p)14C (∼ 4.0%);
In the coolant (boiling water) by the reactions: 17O(n,α)14C, 14N(n,p)14C (∼ 2.3%);
In the reactor space (N2–He purge circuit): 14N(n,p)14C (∼ 2.2%);
In the fuel elements (fuel and cladding): 17O(n,α)14C, 14N(n,p)14C (∼ 2.1%);
In the cooling system of channels of the reactor control and protection system: 17O(n,α)14C, 14N(n,p)14C (∼ 0.7%);
Other sources (∼ 0.5%).
Unlike EGP-6 reactors, where 14C is released mainly via activation of nitrogen in the nitrogen–helium mixture circulating through the reactor core, in PWRs the activation of nitrogen occurs in the primary coolant. The reducing conditions (excess hydrogen) convert most of the 14C into gaseous organic compounds (IAEA 2004; Magnusson Reference Magnusson2007), whereas in graphite–water reactors the release is predominantly 14CO2 (Hou, Reference Hou2018).
In addition to natural production, anthropogenic sources have significantly contributed to the 14C global inventory. Nuclear weapons testing during the 1950s and 1960s released an estimated 2.2·108 GBq of 14C into the environment (IAEA 2004), causing a substantial increase in atmospheric 14C. This resulted in an approximate doubling of 14C concentrations in the Northern Hemisphere and a more than 1.5-fold increase in the Southern Hemisphere. Since the 1970s, however, geochemical carbon cycle processes have reduced these interhemispheric variations. As a result, contemporary atmospheric 14C concentrations are now comparable between hemispheres and are approaching pre-nuclear testing levels (Hua et al. Reference Hua, Turnbull, Santos, Rakowski, Ancapichún, De Pol-Holz, Hammer, Lehman, Levin, Miller, Palmer and Turney2022).
In nature, 14C is continuously produced through the absorption of thermal neutrons by 14N atoms in the upper troposphere and stratosphere. These thermal neutrons are generated by the interaction of cosmic rays with atmospheric substances: 14N(n,p)14C (IAEA 2004).
Since monitoring of 14C in discharges from nuclear power plants in Russia has been carried out for less than 10 years, it is difficult to assess the activity of 14C released into the atmosphere during past reactor operations. The lack of instrumental measurements of 14C releases during the early operations of nuclear power facilities prevents accurate assessment of their environmental and human health impacts. This is especially relevant for graphite‑moderated reactors, since they have one of the highest specific discharge rates (the amount of 14C formed per unit of electricity produced) (IAEA 2010). However, assessing the 14C content in annual tree rings exposed to the source of radiocarbon releases may solve this problem.
Radiocarbon discharges from nuclear power plant operations can lead to localized increases of its atmospheric concentrations. These changes can be monitored by analyzing annual rings from trees growing in the potentially affected area. During photosynthesis, trees absorb carbon dioxide, including 14CO2. The ratio of radiocarbon isotopes present in the ambient air is preserved in the organic matter of the wood. Notably, cellulose does not migrate within tree tissues after it is formed. Therefore, the cellulose in tree rings retains a 14C activity that is proportional to the activity of 14C (in the form of 14CO2) in the surrounding atmosphere (Levin et al. Reference Levin, Kromer, Schoch-Fischer, Bruns, Münnich, Berdau, Vogel and Münnich1985).
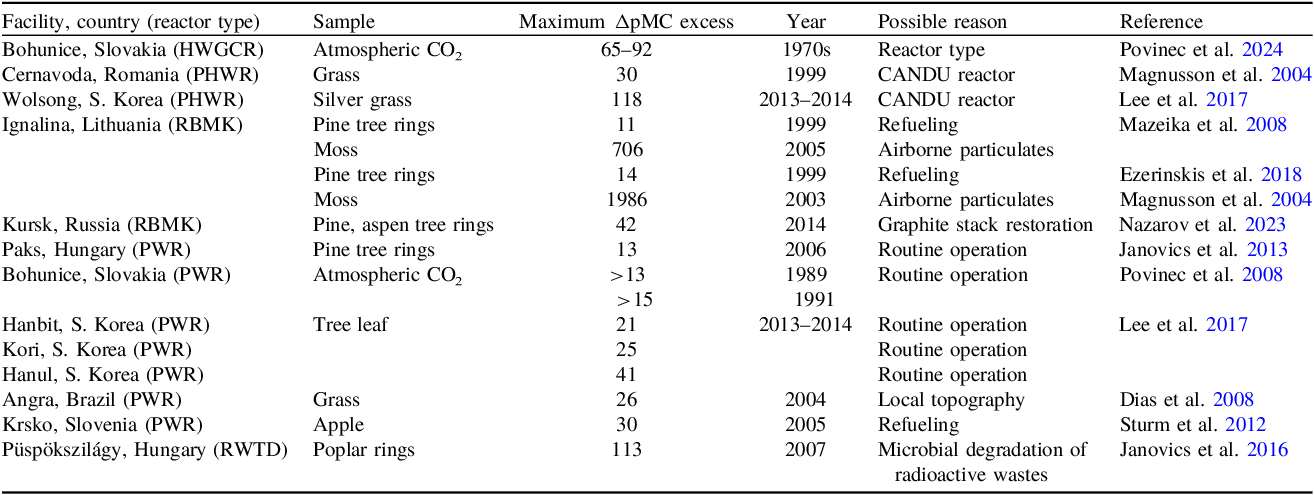
Numerous retrospective studies have employed tree rings to reconstruct the impact of 14C releases from nuclear facilities. In Europe, tree ring analyses around the Bohunice NPP in Slovakia have been used to reconstruct long-term 14C levels, with the highest excess observed during the operation of the KS-150 heavy-water gas-cooled reactor in the 1970s, while a significant decrease was noted after its shutdown and replacement by VVER-440 (PWR) reactors (Ješkovský et al. Reference Ješkovský, Povinec, Steier, Šivo, Richtáriková and Golser2015; Povinec et al. Reference Povinec, Šivo, Šimon, Holý, Chudý, Richtáriková and Morávek2008, Reference Povinec, Kontul’, Ješkovský, Kaizer, Richtáriková, Šivo and Zeman2024). Similarly, investigations at the Ignalina NPP (RBMK) in Lithuania documented elevated 14C levels in pine tree rings, with the highest excess observed during periods of fuel channel replacements (Ezerinskis et al. Reference Ežerinskis, Šapolaitė, Pabedinskas, Juodis, Garbaras, Maceika and Remeikis2018; Mazeika et al. Reference Mazeika, Petrosius and Pukiene2008). The impact of graphite-water reactor operation on the 14C contents in tree rings has been also demonstrated (Nazarov et al. Reference Nazarov, Kruzhalov, Vasyanovich, Ekidin, Kukarskikh, Parkhomchuk, Petrozhitskii and Parkhomchuk2022, Reference Nazarov, Kruzhalov, Vasyanovich, Ekidin, Pyshkina, Kukarskikh and Parkhomchuk2023). For Paks NPP (PWR) in Hungary, tree rings showed a low but measurable 14C excess (average ∼ 5.5 pMC above background), reflecting the predominant release of 14C in hydrocarbon form (Janovics et al. Reference Janovics, Kern, Güttler, Wacker, Barnabás and Molnár2013). Beyond routine reactor operations, tree rings have also been successfully used to monitor 14C releases from radioactive waste treatment and disposal facilities, with excess values up to 113 pMC in some cases (Janovics et al. Reference Janovics, Kelemen, Kern, Kapitány, Veres, Jull and Molnár2016). A study from South Korea, in which tree rings samples collected near Wolsong (PHWR), Hanul, Kori, and Hanbit (PWRs) NPPs demonstrated that heavy water reactors produce substantially higher 14C excess than PWRs (Lee et al. Reference Lee, Kim, Kang, Song, Yun and Kim2017). At Brazil’s Angra Nuclear Power Plant, the largest excess was attributed to local topography (Dias et al. Reference Dias, Santos, Stenström, Nicoli, Skog and Correa2008). Table 1 summarizes the maximum 14C excess values reported in these studies.
Maximum reported 14C excess (ΔpMC) in environmental samples near nuclear facilities.

Table 1. Long description
The table has 14 rows and 6 columns. The columns are labeled Facility, country (reactor type), Sample, Maximum ΔpMC excess, Year, Possible reason, and Reference. The rows list different nuclear facilities, the type of reactor, the sample type, the maximum ΔpMC excess, the year of the study, the possible reason for the excess, and the reference. Row 1: Bohunice, Slovakia (HWGCR), Atmospheric CO2, 65–92, 1970s, Reactor type, Povinec et al. 2024. Row 2: Cernavoda, Romania (PHWR), Grass, 30, 1999, CANDU reactor, Magnusson et al. 2004. Row 3: Wolsong, S. Korea (PHWR), Silver grass, 118, 2013–2014, CANDU reactor, Lee et al. 2017. Row 4: Ignalina, Lithuania (RBMK), Pine tree rings, 11, 1999, Refueling, Mazeika et al. 2008. Row 5: Ignalina, Lithuania (RBMK), Moss, 706, 2005, Airborne particulates, Ezerinskis et al. 2018. Row 6: Ignalina, Lithuania (RBMK), Pine tree rings, 14, 1999, Refueling, Magnusson et al. 2004. Row 7: Ignalina, Lithuania (RBMK), Moss, 986, 2003, Airborne particulates, Magnusson et al. 2004. Row 8: Kursk, Russia (RBMK), Pine, aspen tree rings, 42, 2014, Graphite stack restoration, Nazarov et al. 2023. Row 9: Paks, Hungary (PWR), Pine tree rings, 13, 2006, Routine operation, Janovics et al. 2013. Row 10: Bohunice, Slovakia (PWR), Atmospheric CO2, >13, 1989, Routine operation, Povinec et al. 2008. Row 11: Bohunice, Slovakia (PWR), Atmospheric CO2, >15, 1991, Routine operation, Povinec et al. 2008. Row 12: Hanbit, S. Korea (PWR), Tree leaf, 21, 2013–2014, Routine operation, Lee et al. 2017. Row 13: Kori, S. Korea (PWR), Tree leaf, 25, 2013–2014, Routine operation, Lee et al. 2017. Row 14: Hanul, S. Korea (PWR), Tree leaf, 41, 2013–2014, Routine operation, Lee et al. 2017. Row 15: Angra, Brazil (PWR), Grass, 26, 2004, Local topography, Dias et al. 2008. Row 16: Krsko, Slovenia (PWR), Apple, 30, 2005, Refueling, Sturm et al. 2012. Row 17: Püspökszilágy, Hungary (RWTD), Poplar rings, 113, 2007, Microbial degradation of radioactive wastes, Janovics et al. 2016.
The compiled data in Table 1 demonstrate that 14C excess in the vicinity of nuclear facilities varies widely depending on reactor type, operational conditions, sample type, and local geography. In general, heavy water reactors and non‑routine operations (e.g., refueling, maintenance, waste disposal) produce higher excess values, whereas pressurized water reactors during normal operation consistently yield low excess, typically below 50 pMC.
The aim of this paper is to provide a retrospective assessment of the impact of 14C discharges from the Bilibino NPP on the environment and the population under normal operating conditions.
Instruments and methods
Annual ring sampling of Cajander larch (Larix cajanderi Mayr) was carried out in the area with the highest expected concentration of carbon-14 from discharges of the Bilibino NPP. This area, located 1.5 km southwest of the plant’s ventilation stacks, was identified using long-term meteorological parameters (Figure 1) (Reliable prognosis). The wood cores were collected at a height of approximately 150 cm above the soil surface with a Pressler borer. A total of 10 cores were taken from the site.
Location of sampling site and wind rose in Bilibino 2005–2022.

Tree ring samples were selected to cover the operational period of the Bilibino NPP (1974–2022). Under normal operating conditions, 14C release rates are assumed to remain relatively stable; therefore, a 4-year sampling period was chosen to better resolve potential short‑term increases in 14C releases.
The annual ring widths of all cores were measured using standard dendrochronological techniques (Cook and Kairiukstis Reference Cook and Kairiukstis1990; Rinn Reference Rinn1996; Stokes and Smiley Reference Stokes and Smiley1968). The measurements were carried out with a TSAP‑LINTAB measuring system. The measured ring widths ranged from 0.01 to 0.6 mm. COFECHA software (Holmes Reference Holmes1983) was used for cross‑dating quality control. Based on this cross‑dated chronology, rings of equivalent age from all 10 cores were pooled into composite samples representing specific years.
Cellulose was chemically extracted from the tree rings during sample preparation described in detail in Parkhomchuk et al. (Reference Parkhomchuk, Petrozhitskiy, Ignatov, Kuleshov, Lysikov, Okunev, Babina and Parkhomchuk2024). Extracted cellulose was then completely combusted and converted into graphite using the absorption-catalytic setup (ACS) (Lysikov et al. Reference Lysikov, Kalinkin, Sashkina, Okunev, Parkhomchuk, Rastigeev, Parkhomchuk, Kuleshov, Vorobyeva and Dralyuk2018) to produce targets for accelerator mass spectrometry (AMS). The ACS has been validated in inter‑comparison studies (Parkhomchuk et al. Reference Parkhomchuk, Petrozhitskiy, Ignatov, Kuleshov, Lysikov, Okunev, Babina and Parkhomchuk2024). Polyethylene STD (BN 268530 Thermo Scientific) was used as a background reference material, demonstrating a background of 1.2 ± 0.3 pMC and reproducible results for the NIST OX-I standard, confirming its suitability for environmental 14C analysis.
The 14C measurements were performed at the AMS Golden Valley laboratory using the BINP AMS facility (an accelerator mass spectrometer designed at the Budker Institute of Nuclear Physics, Novosibirsk) (Nazarov et al. Reference Nazarov, Kruzhalov, Ekidin, Vasyanovich, Parkhomchuk, Rastigeev, Kalinkin and Parkhomchuk2021; Parkhomchuk and Rastigeev Reference Parkhomchuk and Rastigeev2011). The successful participation of the BINP AMS in the Glasgow International Radiocarbon Inter-comparison (GIRI) is described in Petrozhitskiy et al. (Reference Petrozhitskiy, Parkhomchuk, Ignatov, Kuleshov, Kutnyakova, Konstantinov and Parkhomchuk2024).
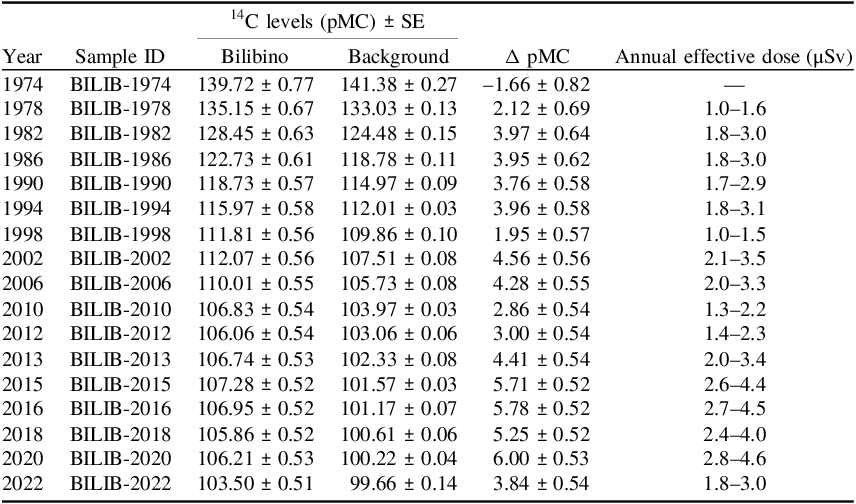
A combined global dataset of atmospheric 14CO₂ for June–August in Northern Hemisphere zone covering 1974–2018 (Hua et al. Reference Hua, Turnbull, Santos, Rakowski, Ancapichún, De Pol-Holz, Hammer, Lehman, Levin, Miller, Palmer and Turney2022) and 2020–2022 (Hammer and Levin Reference Hammer and Levin2023) was used to define background values for this study (Table 2).
14C levels (pMC) in tree rings and background air and estimated annual effective dose range (kveg = 0.16–0.27).

Table 2. Long description
A table with 14 rows and 5 columns. The columns are labeled Year, Sample ID, Bilibino, Background, Δ pMC, and Annual effective dose (μSv). The table presents data on 14C levels in tree rings and background air, along with estimated annual effective dose ranges from 1974 to 2022. Each row lists the year, sample ID, 14C levels in Bilibino and background, the difference in pMC, and the annual effective dose range. Notable trends include variations in 14C levels and dose ranges over the years.
The anthropogenic contribution to the 14C specific activity in each annual ring ΔA (Bq/g C) was calculated as:
 $$\Delta A{\rm{ }} = {\rm{ }}2.26\cdot{10^{-3}}\left( {\rm{{{A_{meas}}-{A_{back}}}}} \right),$$
where Ameas is the measured pMC of the sample;
Aback – average background pMC in the atmosphere during the specific year;
2.26·10–3 – coefficient between pMC and Bq/g C, based on the relationship that 100 pMC = 226 Bq/kg C (Stenström et al. Reference Stenström, Skog, Georgiadou, Genberg and Mellström2011).
The expected effective dose from 14C exposure was estimated based on the following assumptions (IAEA 2001):
-
• Equilibrium between 14C concentration in the air and food;
-
• Ingestion is the primary mode of exposure;
-
• Released 14C is associated with 14CO2 molecules and absorbed by plants during photosynthesis;
-
• The resulting organic molecules are subsequently transferred, along with stable 12C, through food chains and into the human body.
The expected annual dose D (Sv/a) was calculated as (IAEA 2001):
 $${D{\rm{ }} = {\rm{ }}\Delta A\cdot g/{k_{veg}},}$$
where g = 5.6·10−5 (Sv/a)/(Bq/g) is the effective dose rate factor that relates the annual dose rate (Sv/a) to the concentration of 14C per gram of carbon in people (Bq/g);
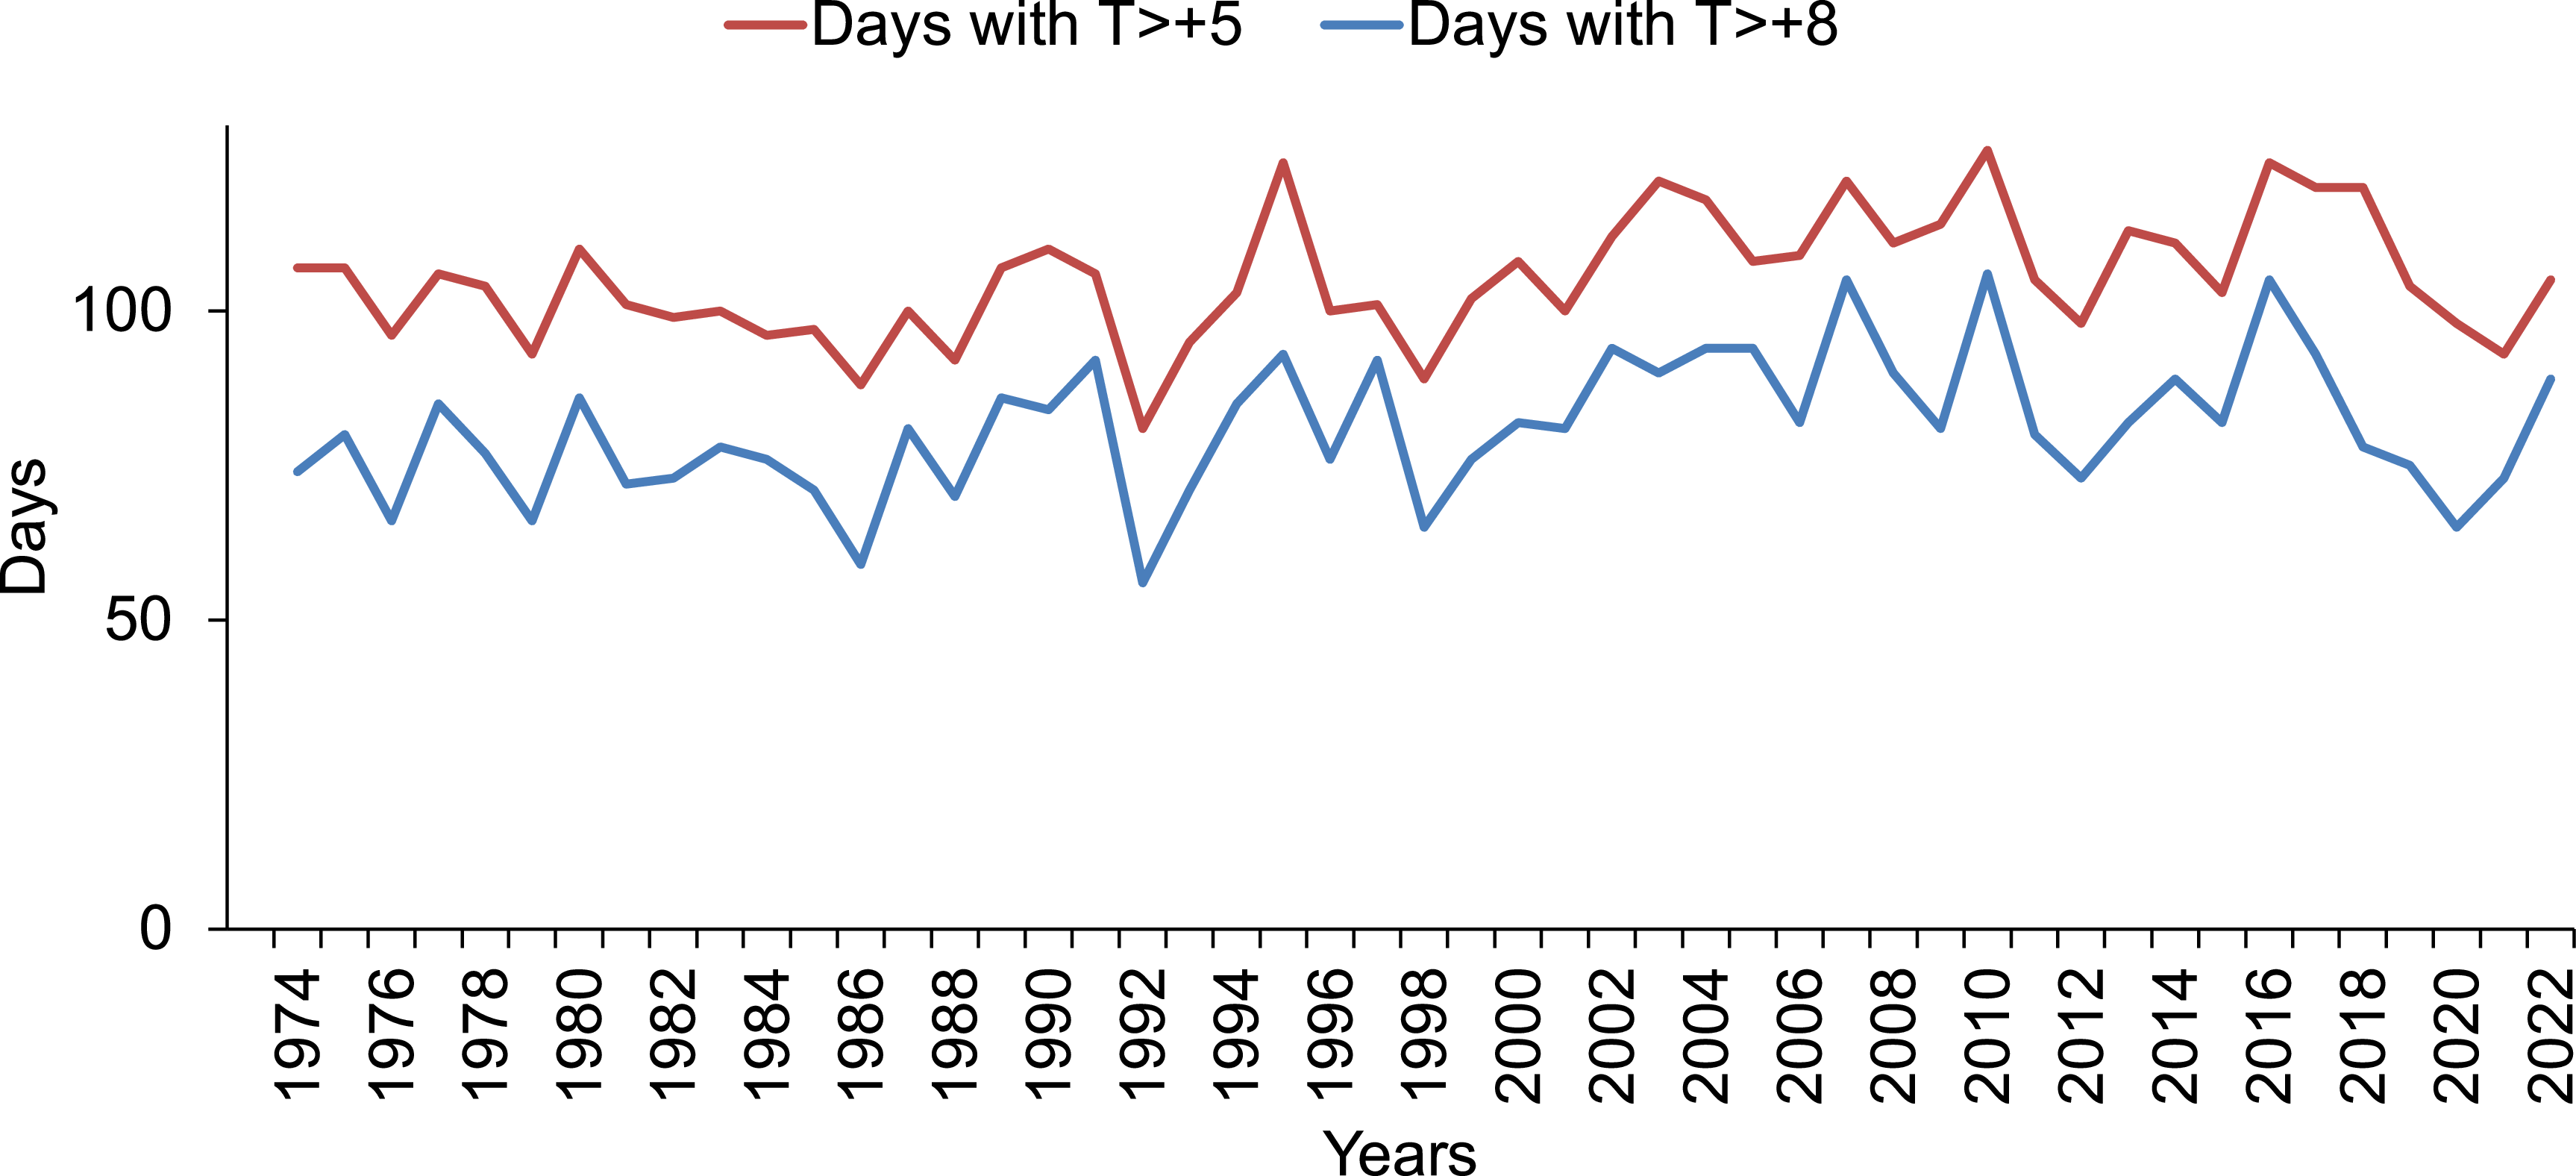
kveg – is a coefficient that considers the number of days per year during the growing season. The active vegetation period is typically defined by the transition of average daily temperatures through +5°C (Sinicina et al., Reference Sinicina, Goldberg and Strunnikov1973). However, despite the potential for photosynthesis at lower daytime temperatures (4–5 °C), heat limitations can restrict wood growth (Rossi et al. Reference Rossi, Deslauriers, Griçar, Seo, Rathgeber, Anfodillo, Morin, Levanic, Oven and Jalkanen2008). Therefore, a temperature threshold of +8 °C should also be considered. Using data from the Ostrovnoye meteorological station (90 km west of Bilibino), we estimate the radial growth period of Larix cajanderi Mayr in the study region to be 60–100 days (Figure 2). These boundary values were used in the calculations, thus kveg = 0.16–0.27.
Number of days in Bilibino region with temperatures more than +5 and +8 °C.

Results and discussion
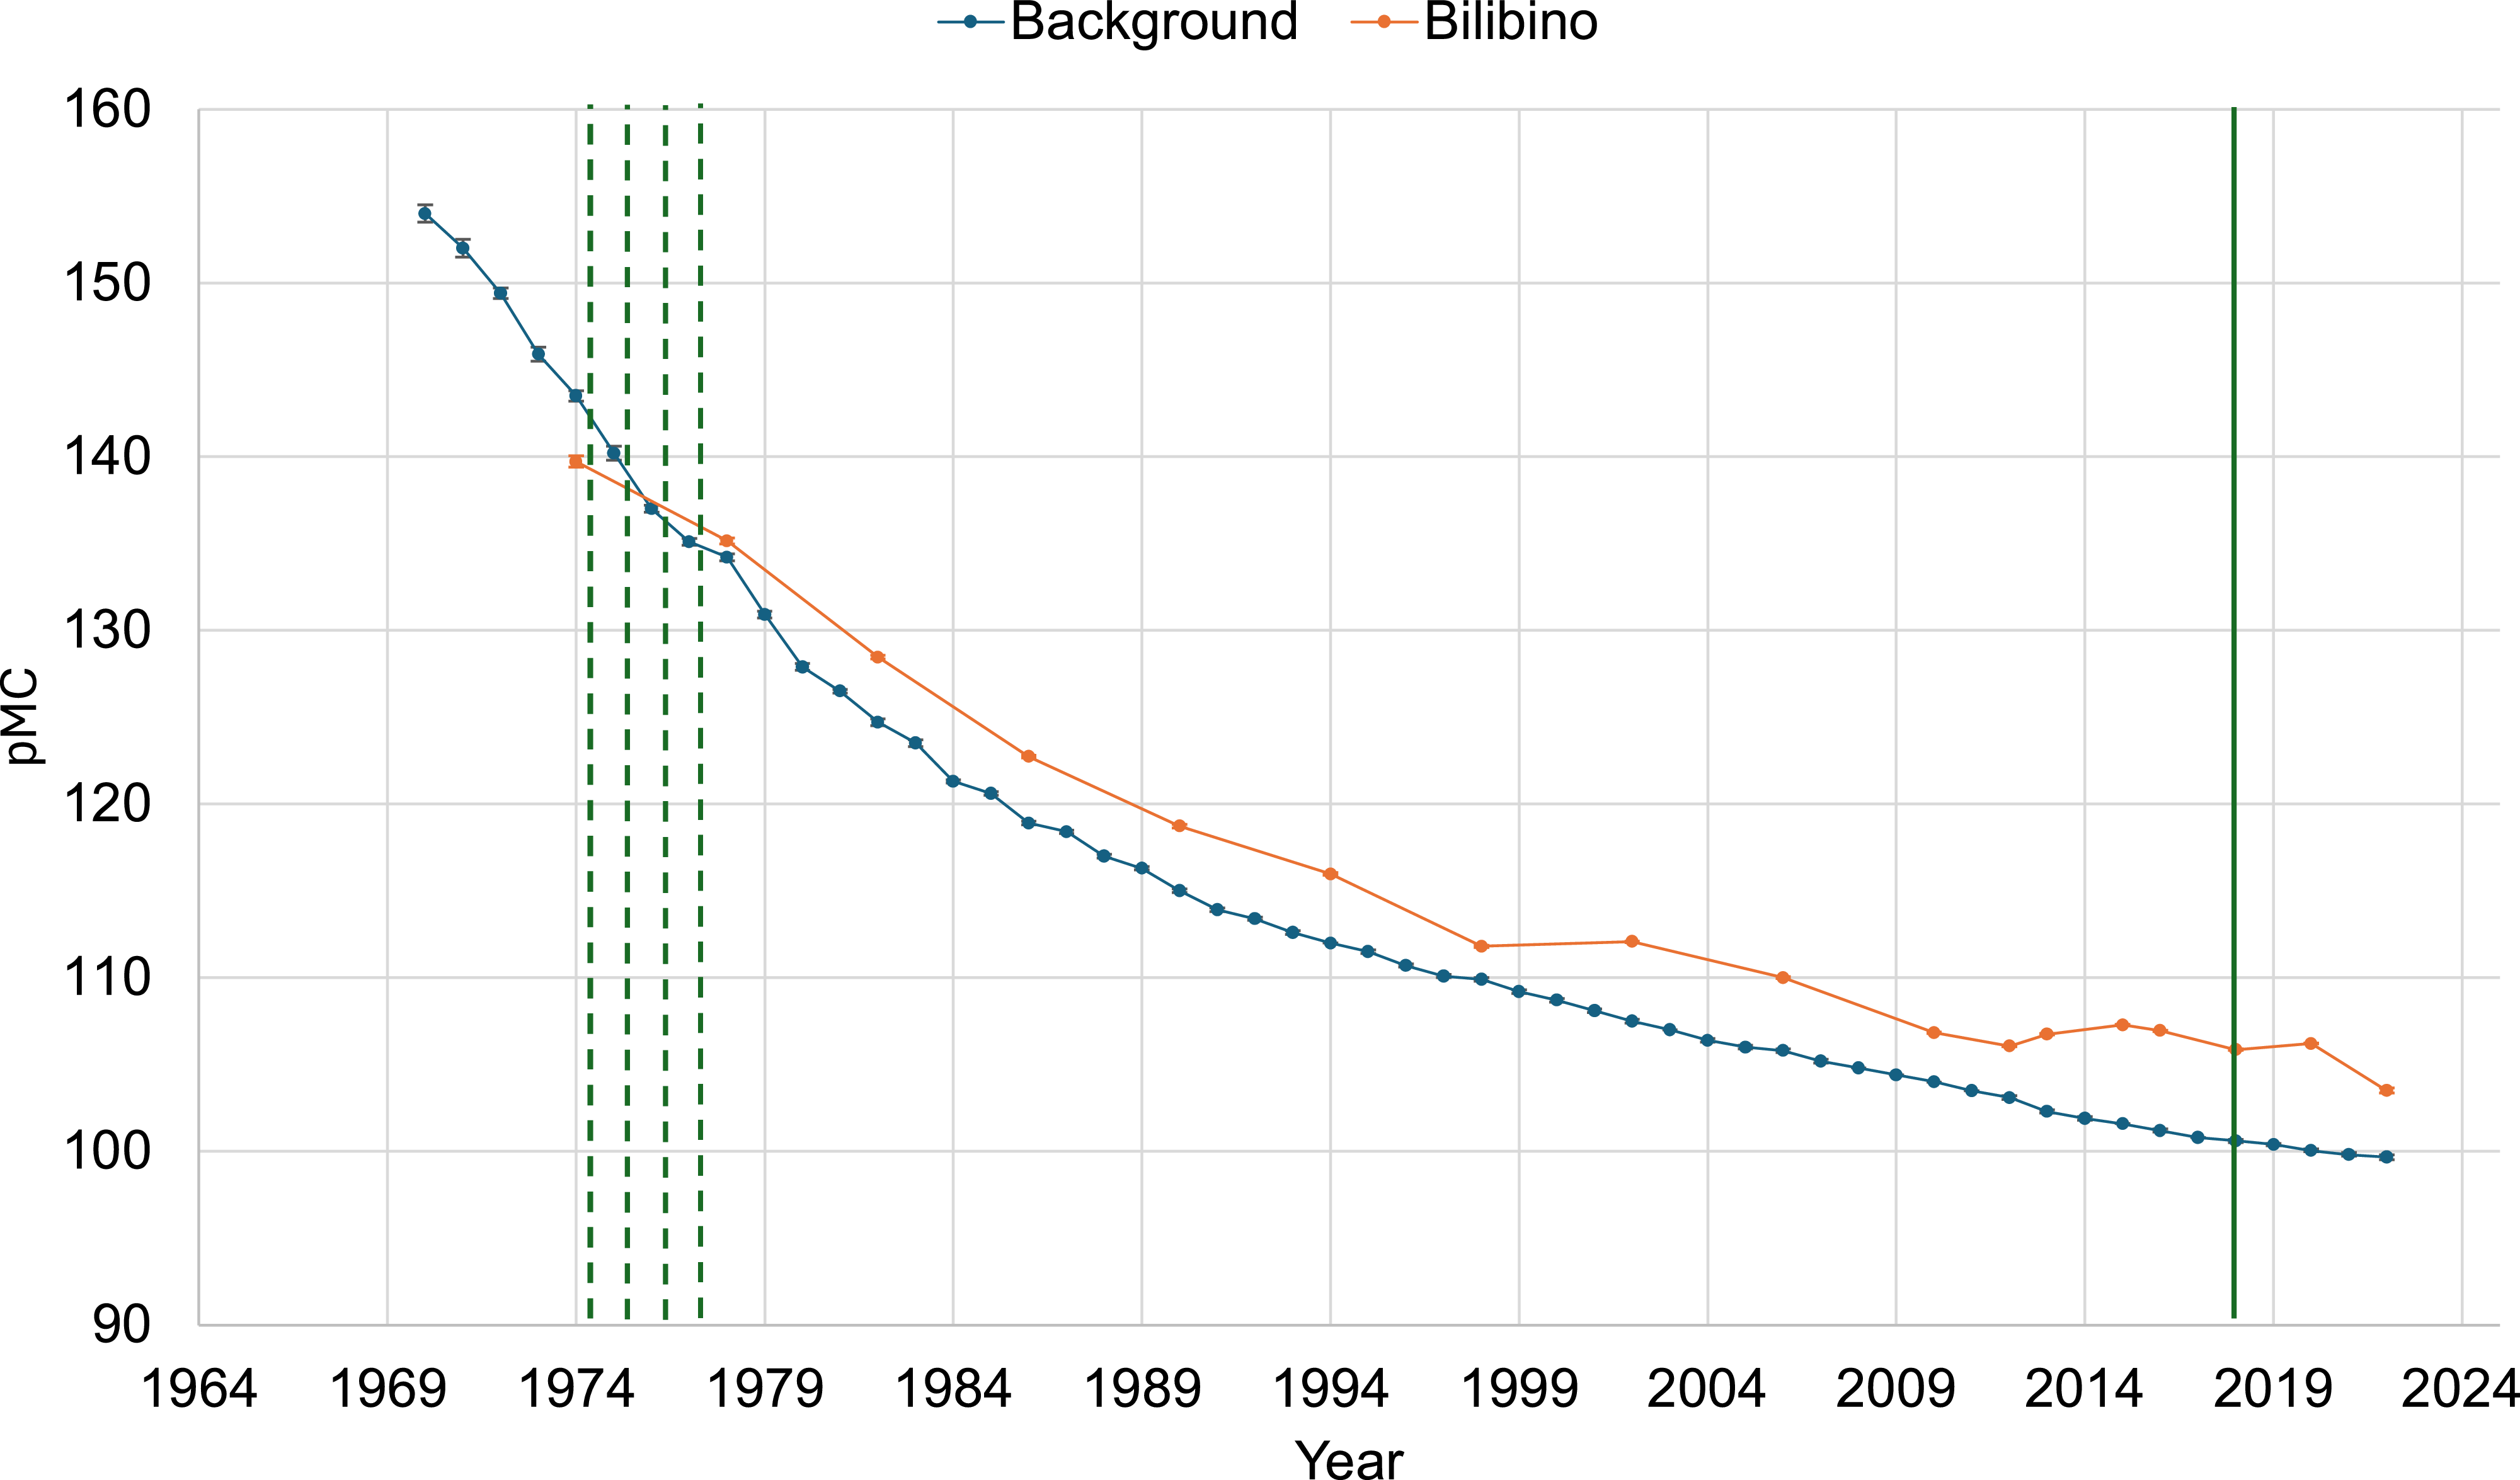
Figure 3 demonstrates the results of 14C measurements in the annual rings of Cajander larch in comparison with the global atmospheric 14C background levels. The dotted lines indicate the commissioning dates of power units 1–4 of the Bilibino NPP: January 4, 1974; January 2, 1975; January 2, 1976; and January 1, 1977, respectively.
14C levels (pMC) in tree rings from the Bilibino NPP site and the background atmosphere (1974–2022). Dotted lines indicate the commissioning dates of power units 1–4 (1974–1977). The solid line marks the shutdown of the first power unit in 2018.

The contribution of radiocarbon discharges from the Bilibino NPP during normal operation is visible in the annual tree rings near the plant. The greatest difference between the measured and the background values, that is, the greatest anthropogenic contribution from the operation of the Bilibino NPP, was observed between 2013 and 2020, ranging from 4.4 to 6.0 pMC. No correlation was found between the 14C excess and electricity production (r = –0.06, p = 0.83). This suggests that the observed increase may be related to graphite masonry work performed during this period. Manipulation on the graphite stack can lead to higher releases (Ežerinskis et al. Reference Ežerinskis, Šapolaitė, Pabedinskas, Juodis, Garbaras, Maceika and Remeikis2018), as most of the 14C produced remains trapped in the graphite during routine reactor operation and is not released to the atmosphere under normal conditions.
The 14C excess (ΔpMC) observed at the Bilibino NPP is comparable to that reported for the Ignalina NPP (RBMK) and the Paks NPP (PWR) (Table 1). This relatively low excess may be attributed to the small size of the EGP‑6 reactor (including its fuel elements, graphite stack, and overall core volume), as well as to the short vegetation period in the study region, during which trees actively assimilated 14CO2.
The annual effective doses calculated by eq. 2 range from 1.0–1.5 µSv in 1998 to 2.8–4.6 µSv in 2020 (Table 2). This calculation assumes that the diet consists exclusively of locally produced food, and consequently, that the specific activity of 14C is in equilibrium in food and atmospheric air. The dose values obtained are in good agreement with previously reported values: about 3 μSv/year for the Bohunice NPP (PWR, Povinec et al. Reference Povinec, Šivo, Šimon, Holý, Chudý, Richtáriková and Morávek2008), 0.2–5.3 μSv/year for Kursk NPP (RBMK, Nazarov et al. Reference Nazarov, Kruzhalov, Vasyanovich, Ekidin, Pyshkina, Kukarskikh and Parkhomchuk2023) and 0.2–2.0 μSv/year for the Ignalina NPP (RBMK, Mazeika et al. Reference Mazeika, Petrosius and Pukiene2008).
Conclusion
In this work, the 14C content was analyzed in the annual rings of the most representative tree species in the Bilibino NPP area, Cajander larch (Larix cajanderi Mayr). Measurements performed using an accelerator mass spectrometer revealed an anthropogenic contribution to the specific activity of 14C in each of the samples, which is attributed to the operation of four EGP-6 graphite-water reactors. The excess ranged from 2.0 pMC in 1998 to 6.0 pMC in 2020. The largest contribution is likely associated with maintenance work on the graphite stack, which resulted in additional radiocarbon activity being released from the pores of the graphite.
The retrospective assessment of annual effective doses, based on a conservative approach, yielded values well below the public dose limit of 1 mSv per year (ICRP 2007).
Currently, all reactors of the Bilibino NPP have been shut down. However, the decommissioning process (including fuel unloading and dismantling of the graphite stack) will likely be accompanied by increased 14C releases. Therefore, continued monitoring of this radionuclide in NPP releases and environmental compartments remains important.
Financing
The research was carried out at the expense of subsidies from the Ministry of Education and Science of the Russian Federation for the implementation of the scientific topic FUMN-2024-0001.