Implications
The lignification of structural fibre in white and red clover silage increases because of delayed harvest without affecting the mean ruminating and total chewing time per kg NDF. The distribution of particle length and width values in rumen contents and faeces reflects the indigestible NDF/NDF ratios in the different legume crops, whereas the 95% percentile length value in faeces did not differ between legume crops.
Introduction
The use of clover in diets for dairy cows has a long tradition but is primarily grown as a mixture with grass species. White clover is known to increase the feed intake but the dry matter (DM) yield per hectare is low. Red clover has a higher DM yield potential but a generally lower digestibility than white clover. Legume crops like clover are characterized by a lower content of structural fibre (NDF), higher ratio of indigestible NDF (INDF) to NDF, a lower potential digestibility of NDF (DNDF), a higher rate of digestion of DNDF and more lignified and rigid NDF fibre compared with grass silages with similar organic matter digestibility (Hoffman et al., Reference Hoffman, Sievert, Shaver, Welch and Combs1993; Dewhurst et al., Reference Dewhurst, Fisher, Tweed and Wilkins2003).
The content of structural fibre in the cell wall changes during growth and maturation (Rinne and Nykänen, Reference Rinne and Nykänen2000). The effects of maturity stage on the chewing time and the particle size distribution in digesta of grass silage have been well studied by Beauchemin and Iwaasa (Reference Beauchemin and Iwaasa1993) and De Boever et al. (Reference De Boever, De Smet, De Brander and Boucque1993), but studies focusing on the maturity effects of red and white clover silages are limited. Fibre from different botanical forage origin subjected to different processing and particle size distribution differ considerably in their effectiveness in stimulating chewing activity, rumen fermentation and ruminal retention time (Owens et al., Reference Owens, Secrist, Hill and Gill1998).
A high chewing activity, high saliva secretion and frequent and strong rumen contractions are important for optimal rumen function in terms of formation of a floating layer system, as well as an effective retention of large undigested particles, rumen fermentation and prevention of digestive disorders (Mertens, Reference Mertens1997; Nørgaard et al., Reference Nørgaard, Nadeau, Randby and Volden2011). The mean chewing time per kg forage NDF has been used for characterization and ranking the structural value of feeds for dairy cattle.
The feed evaluation systems for dairy cattle, like the Nordic ration formulation system NorFor (Volden, Reference Volden2011), are generally based on digestive kinetics and particle size values from experiments with grass and alfalfa crops. In the Nordic ration formulation system (Nørgaard et al., Reference Nørgaard, Nadeau, Randby and Volden2011) the chewing index values of the individual forages depends on the content of NDF, particle length and a hardness factor of the NDF fibre (Nørgaard et al., Reference Nørgaard, Nadeau, Randby and Volden2011). The INDF to NDF ratio is considered to reflect the resistance against physical degradation during mastication during ruminating (Nørgaard et al., Reference Nørgaard, Nadeau, Randby and Volden2011).
The particle size in forage, digesta and faeces has been measured using different techniques, for example, the wet and dry sieving techniques (Allen et al., Reference Allen, Robertson and van Soest1984), the Penn State particle Separator (Kononoff et al., Reference Kononoff, Heinrichs and Buckmaster2003) and the image analysis technique (Luginbuhl et al., Reference Luginbuhl, Fisher, Pond and Burns1991; Nørgaard and Sehic, Reference Nørgaard and Sehic2003). Arithmetic and geometric mean particle size obtained from the sieving technique appears to be a poor descriptor of particle size distribution in feed and digesta because of the variation around the mean and skewed distribution. Use of the image analysis technique makes it possible to characterize the distribution of both particle length and particle width values of particles (Nørgaard, Reference Nørgaard2006).
An optimal utilization of clover in diets requires information regarding their structural value and the degradation of the fibre during eating and ruminating and comminution. There is limited knowledge available about chewing activity and the comminution characteristics of particles from red and white clover silage at different harvest times and especially clover crops grown at Nordic latitudes. Studies where the pure forage effect is studied is scarce, as high-yielding dairy cows are fed concentrated rations and thereby the digesta and faeces contain residues from both concentrates and forages. Therefore, the objective of this study was to characterize the structural value of red and white clover silage in terms of chewing activity and changes in particle size distributions along the digestive tract from cows fed red and white clover silages at different harvest times.
Material and methods
The silages
The red clover (Trifolium pratense L. (Rajah)) and white clover (Trifolium repens (Klondike)) crops were grown in 2007 and harvested with a disk mower (John Deere 500, Holbaek, Denmark) at two stages of maturity before bloom (early) at May 14th and after bloom (late) at June 3rd (White clover) and 18th (red clover). The crops were prewilted for 48 h before baling (Massey Ferguson 139) without additives into small bales of 30 kg, which were wrapped with 10 layers of plastic film within 2 h.
Animals, experimental design and housing
Four non lactating rumen cannulated Jersey cows with an average initial live weight of 588 ± 52 kg were assigned into a 4 × 4 Latin square design with four dietary treatments assigned to four experimental periods with a length of 3 weeks each. The dietary treatments included restrictive feeding with white clover silage harvested at two stages of growth, early (EW) and late (LW), and red clover silage harvested at two stages of growth, early (ER) and late (LR). The cows had access to separate, automatic water bowls and a manger for forage. The cows were kept in individual temperate tie stalls, with rubber mats. BWs were measured before the experiment began and after each experimental period. The experimental procedures used in this study were approved by the Research Animal Ethics Committee (The Animal Protection Law – The Danish Ministry of Food, Agricultural and Fisheries, EU directive EU 86/609).
Feeding and management
Each experimental period consisted of an adaption period from days 1 to 14, and a recording and collection period from days 15 to 20. The animals were fed ad libitum from days 1 to 11 and 80% of ad libitum from day 12; feeding was twice daily at 0730 and 1530 h. Mineralized salt (NaCl) blocks containing biotin (12 mg/kg), manganese (190 mg/kg), iron (210 mg/kg), copper (80 mg/kg), cobalt (12 mg/kg), zinc (300 mg/kg), iodine (50 mg/kg) and selenium (20 mg/kg) were available during the adaption periods.
Sampling of feeds
Fresh samples were collected from all four crops after harvest. Subsamples of herbage were divided into plant parts: stems, petioles, leaves and flowers. The stipules were included in the stem fraction. The subsamples were weighed, freeze-dried and ground to pass through a 1 mm screen of a Cyclotec sample mill (Foss, Hilleroed, Denmark).
A sample of 0.5 kg was taken from each silage bale with a silage spear for DM determination at 60°C to constant weight and further chemical analyses. The samples were pooled to one sample per treatment per period (16 samples).
Chewing activity
Chewing activity was measured for 96 h continuously from day 15 in each period before the morning meal in the recording period. Jaw movements (JM) oscillations (JMO) were recorded by means of a chewing halter (Nørgaard and Hilden, Reference Nørgaard and Hilden2004). The individual JM were identified from the JMO and clustered into crude cycles (CC) and CC were clustered into crude periods of eating and ruminating. The chewing rate and basic chewing rate (BCR) within each cycle were estimated according to Schleisner et al. (Reference Schleisner, Nørgaard and Hansen1999). The individual crude periods were classified as either rumination periods, eating periods, idling periods or licking. The daily time spent eating and ruminating was estimated as the accumulated daily duration of identified eating and rumination crude periods. The daily chewing time was estimated as the daily eating time plus the daily rumination time. The cycle time was estimated as the time from the first JM to the last JM in a CC + 1/BCR. The effective eating and rumination times within the corresponding periods were estimated as the sum of cycle time values. The inter cycle times (ICT) between the individual rumination cycles (the time from swallowing to regurgitating a bolus) was estimated as the difference between total rumination time and effective rumination time divided by the daily number of ruminating cycles minus one cycle per period (Schleisner et al., Reference Schleisner, Nørgaard and Hansen1999).
Eating rate
Eating rate at restricted feeding was measured at day 1 in the recording period during four test meals of 20 min. Twenty per cent of the daily ration was offered at 0730, 0755, 1530 and 1555 h. Eating behaviour was observed during the 20 min and orts and the remaining 10% were weighed and re-fed after meal two and four. The eating rate was calculated as silage consumed per time spent eating (min/kg DM and min/kg NDF).
Boli, rumen and faeces sampling
Faeces samples (200 ml) were collected by rectal collection at days 1, 2, 3 and 4 in the recording period in the morning (0700 h), at noon (1200 h) and in the afternoon (1600 h), respectively, and stored at −20°C. The three samples from each day were homogenized and frozen. Samples from all 4 days were pooled to one representative sample per cow and period. At day 20, three rumen samples were collected from the rumen, before the morning meal, 1 h after the cow finished eating the morning meal and again at 1200 h. One large handful was obtained 10 to 15 cm beneath the mat surface in the ventral rumen sac. The rumen contents were evacuated at 1230 h at day 20. The rumen material was separated through a filter with 1 cm pore size into a liquid and a solid phase and three samples of each phase were stored at −20°C. Furthermore, a proportional sample of the solid and liquid rumen material was made. Before returning the contents to the rumen, the cow was fed 5 kg of its daily feed. The first 25 boli were collected through the rumen fistula by the opening of the oesophagus and thereafter weighed.
Chemical analysis
Forage, rumen content and faeces were analysed for DM, ash, CP, NDF, ADF and ADL concentrations. The silages were further analysed for crude fat, crude fibre and short chain fatty acid concentration. For chemical analyses, samples were freeze dried and ground through a 1.5 mm screen in a Cyclotec sample mill for fibre analyses and through a 1 mm screen for all other analyses. The DM determination was made at 60°C to constant weight. The ash content was determined by incineration at 525°C for 10 h in a Heraeus (type MR 260 E) furnace. Fresh silage samples were analysed for total nitrogen (N) following the Kjeldahl procedure (Association of Official Analytical Chemists (AOAC), 2002) and CP content was calculated as N × 6.25. Crude fat was determined after hydrolysis with HCl and extraction with petroleum ether in a Soxtec system (Foss, Hillerød, Denmark). NDF, ADF and ADL were analysed sequentially according to van Soest et al. (Reference Van Soest, Robertson and Lewis1991) with the use of α-amylase and corrected for ash. All fibre analysis was carried out by use of Fibrecaps (Foss Electric, Hillerød, Denmark). The content of indigestible NDF (INDF) was determined in sacco and incubation after 288 h in the rumen of samples ground through a 1.5 mm screen in a cutter mill (Heavy-Duty Cutting Mill SM 2000, Retsch, Haan, Germany; Åkerlind et al., Reference Åkerlind, Weisbjerg, Eriksson, Thøgersen, Udén, Ólafsson, Harstad and Volden2011). Sugar, Klasons lignin and uronic acid were measured by methods described by Knudsen (Reference Knudsen1997). Silage fermentation products were analysed in silage extracts. Water (1 l) was added to thawed samples (100 g). The samples were blended in a Bosch Chopper (Type: CNCM13ST1; Ballerup, Denmark) and 40 ml of homogenized sample was centrifuged. pH was measured in the supernatant before stabilizing with 5% metaphosphoric acid. Acetic, propionic, butyric and lactic acid and ammonia were quantified by gas chromatography as described by Kristensen et al. (Reference Kristensen, Storm, Raun, Rojen and Harmon2007).
Washing and sieving of samples
Faeces (30 g), boli (30 g), rumen mat (30 g) and rumen fluid samples (90 g) were washed in nylon bags (10 μm pore size) in a washing machine including 4.0 ml liquid soap (Biotex color, Copenhagen, Denmark) per bag and washed for 2 h at 40°C. The samples were freeze-dried and dry-sieved into seven fractions (4.750 (T), 2.360 (O), 1.000 (M), 0.500 (S), 0.212 (D), 0.106 (C) mm and a bottom bowl) by use of a vertical sieve shaker (Retsch AS 200; Retsch GmbH). Entangled particles were separated by the use of a brush. The mass proportion of particles of each sieve and the mean geometric particle size (GPS) were calculated according to Waldo et al. (Reference Waldo, Smith, Cox, Weinland and Lucas1971).
Image analysis
After sieving particles, image analysis was used for measuring the PL and PW distribution in rumen mat and faeces. From sieve fraction T and O, all the material was scanned and from sieve fraction M (20 mg) and S (7 mg) two subsamples were scanned. The particles were placed on a HP Scanjet 8300 Scanner (Alleroed, Denmark) and scanned at 2400 dpi in multicolour with a blue background. From sieve fraction D (3 mg), C (2 mg) and B (1 mg), one subsample was distributed on a Scan Mate F8Plus and multi-colour scanned at 4800 dpi against a blue background. The area (PA), length (PL) and width (PW) dimensions were measured for each identified particle by use of Image Pro Plus (ver. 5.5; Rockville, MD, USA; media cybernetics, 2007). A gamma distribution function (γi) was estimated for PL, PW and PL to PW ratio (PL : PW) values for each sieving fraction by weighting with the PA values. The overall probability density distribution functions PDF(PL), PDF(PW) and PDF(PL : PW) were estimated as composite functions of γi by weighting with the proportion of particle mass within each sieving fraction. The most frequent length (mode PL), width (mode PW) and PL : PW (mode PL : PW) values were estimated by stepwise identification of peaks on PDF(PL) and PDF(PW)-functions. In this study, the PDF(PW)-functions had two peaks and the peak at the lowest PW value was considered as the mode 1 value and the peak at the highest PW value was considered as the mode 2 value. The peaks on the PDF functions were identified by stepwise comparison of the PDF(xn) by PDF(xn + 1) with steps of 0.01, 0.002 and 0.01 mm for PL, PW and PL : PW, respectively. The 95 percentile of length, width and PL : PW values were estimated from the cumulative distributions functions of PL, PW and PL : PW values, respectively, as described by Nørgaard (Reference Nørgaard2006). A mean log(PL)i and log(PW)i were estimated for each sieving fraction by weighting with PA values. The overall geometric PL and PW were estimated from the log(PL)i and log(PW)i values by weighting with the mass proportion within the individual sieving fractions as described by Nørgaard and Hilden (Reference Nørgaard and Hilden2004).
Statistical analysis
All experimental data were analysed using the PROC MIXED of SAS® (SAS system for Windows, release 9.2; SAS Institute Inc., Cary, NC, USA). Intake, eating rate, chewing activity and particle size data were analysed according to the following model:
 $$ {{Y}_{ijk}}\:{\rm{ = }}\:\mu \:{\rm{ + }}\:{{T}_i}\:{\rm{ + }}\:{{P}_j}\:{\rm{ + }}\:{{C}_k}\:{\rm{ + }}\:T{{P}_{ij}}\:{\rm{ + }}\:{{e}_{ijk}} $$
where Yijk is the dependent variable, μ the overall mean, Ti the fixed effect of treatment (i = 1 to 4), Pj the fixed effect of period (j = 1 to 4), Ck the random effect of cow, TPij the interaction between treatment and period and eijk the residual error.
Comparison of particle size in rumen content sampled at different times and particle size in boli, rumen mat, rumen fluid and faeces were analysed according to the following model:
 $$ {{Y}_{ijkl}}\:{\rm{ = }}\:\mu \:{\rm{ + }}\:{{T}_i}\:{\rm{ + }}\:{{P}_j}\:{\rm{ + }}\:{{C}_k}\:{\rm{ + }}\:{{S}_l}\:{\rm{ + }}\:T{{P}_{ij}}\:{\rm{ + }}\:{{C}_k}{{P}_j}\:{\rm{ + }}\:{{e}_{ijkl}} $$
where Yijk is the dependent variable, μ the overall mean, Ti the fixed effect of treatment (i = 1 to 4), Pj the fixed effect of period (j = 1 to 4), Ck the random effect of cow, Sl the fixed effect of sample time, TPij the interaction between treatment and period, CkPj the interaction between treatment and period (random) and eijk the residual error. Effects were declared significant at P < 0.05 and as a tendency to significance at 0.05 < P < 0.10 in the Wald F-test.
Results
Silages
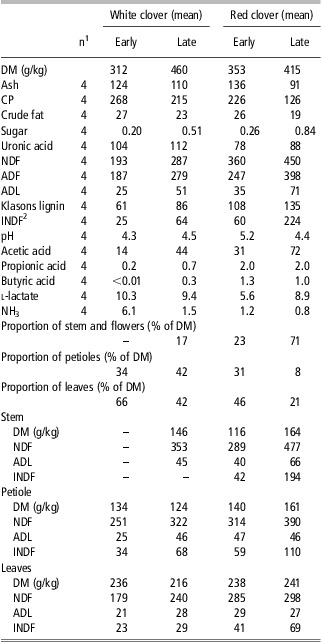
The chemical composition and nutritional characteristics of the silages are presented in Table 1. The late harvested clover crops had a higher DM content compared with the early harvested crops because of weather conditions. The differences in NDF content between early and late were at the same level for both type crops and were 19% and 28% in white clover silage and 36% and 45% in red clover silage for early and late, respectively. The fermentation products were primarily lactic and acetic acid (Table 1). The butyric acid concentration was higher in red clover than white clover silages. Especially ER had a higher pH value, higher butyric acid concentration and a lower concentration of l-lactate. Despite that all silages must be classified as silages of good fermentation quality. The stem proportion in DM was more than doubled from 23% in ER to 71% in LR.
Chemical composition and pH of clover silages harvested at different stages of growth

DM = dry matter; INDF = indigestible NDF.
All values are in g/kg DM, unless stated otherwise.
1Number of samples per treatment.
2Determined in situ (288 h) on pooled samples.
The NDF content in the red clover stems increased from 289 to 477 g/kg DM, whereas the NDF contents in the leaves were almost the same for the two harvest times (Table 1). The ADL content in the red clover stems increased from 40 to 66 g/kg DM due to later harvest time while the ADL content in the petioles and leaves was almost the same for the two harvest times (Table 1). The NDF content in the petioles was 251 and 322 g/kg DM and in the leaves 179 and 240 g/kg DM for EW and LW, respectively. The ADL contents in the petioles were 25 and 46 g/kg DM and in the leaves 21 and 28 g/kg DM for EW and LW, respectively.
Intake, eating rate and eating activity
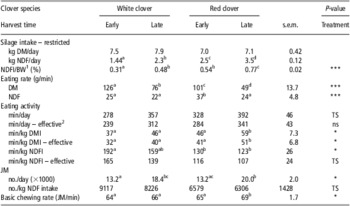
Data on feed intake, eating rate and eating activity are given in Table 2. The eating activity is expressed as the eating time and the effective eating time.
Effects of harvest time (early or late) of red and white clover silage on feed intake and eating activity in cows

DM = dry matter; NDFI = NDF intake; DMI = dry matter intake; JM = jaw movements.
1NDFI/BW: NDF intake per kg BW.
2Effective time, which does not include the pauses.
***P < 0.001, **P < 0.01, *P < 0.05, TS 0.05 < P < 0.10.
Early harvest of the clover silages increased the eating rate (g DM/min, g NDF/min; P < 0.001) and decreased the mean eating time and mean effective eating time in red clover (min/kg DMI; P < 0.05). The eating time to NDF intake ratio (min/kg NDFI) was affected by treatment (P < 0.05), with the highest value in EW and the lowest in LR. The number of JM/day was higher in the late harvested clover silages (P < 0.05) and the BCR during eating was higher in LR (P < 0.05).
Ruminating and total chewing
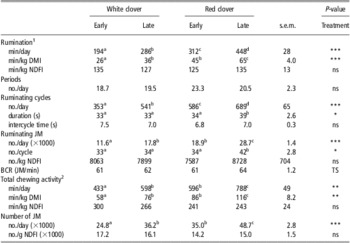
Data on ruminating and total chewing activity are given in Table 3 presented as the effective time, which does not include the duration of the ICT. Early harvest decreased the ruminating time (P < 0.001), total chewing time (min/day, min/kg DMI; P < 0.01), number of cycles during ruminating (P < 0.001) and the number of JM/day during ruminating and total chewing (P < 0.001). The cows spent from 194 min/day on ruminating when fed EW to 286 min/day when fed LW. For the red clover silage, the ruminating interval ranged from 312 to 448 min/day. The mean duration of the rumination cycles was higher for LR compared with the other three treatments (P < 0.05). The number of JM/cycle during ruminating was 42 in LR and higher than the 33 to 34 for EW, LW and ER (P < 0.05).
Ruminating and total chewing activity by cows fed different clover diets

DMI = DM intake; NDFI = NDF intake; JM = jaw movements; BCR = basic chewing rate.
1Effective ruminating activity.
2Effective total chewing activity.
***P < 0.001, **P < 0.01, *P < 0.05, TS 0.05 < P < 0.10.
Particle size distribution in rumen mat and faeces measured by image analysis
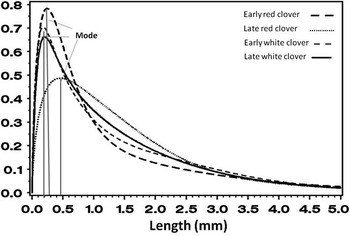
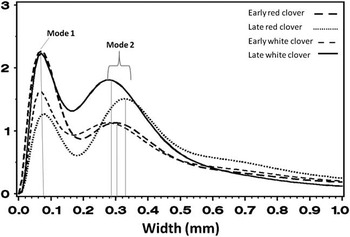
The PDF(PW) for rumen mat and faeces particles had two distinct local peaks at each of the four treatments (Figure 2), whereas only one peak was identified on the PDF(PL) (Figure 1).
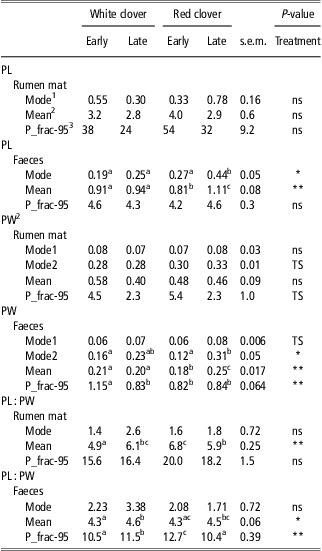
The distributions of PL, PW and PL : PW values in rumen mat and faeces are left skewed with many short and thin particles and few large particles as illustrated in Figure 1. The distributions of PL and PW values in rumen mat and faeces are characterized by one (PL) or two (PW) local peaks, a geometric mean and 95 percentile values. There was a tendency to higher mode 2 PW values in the rumen mat from red clover treatments compared with white clover treatments (P < 0.10). There was no significant difference in mean PL in rumen mat between the four treatments (Table 4). The mean PL : PW ratio in rumen mat was significantly higher in LW compared with EW and higher in ER compared with LR (P < 0.01).
PL (mm), PW (mm) and PL : PW proportion in rumen mat and faeces by cows fed different clover diets measured by image analysis

PL = particle length; PW = particle width; GPL = geometric particle length.
1Mode: most frequent PL, PW or PL : PW.
2Mean: the GPL, PW or PL : PW.
3P_frac-95: the 95% percentile value.
***P < 0.001, **P < 0.01, *P < 0.05, TS 0.05 < P < 0.10.
The mode PL value in faeces was higher in LR compared with the three other treatments (P < 0.05). The mode 2 PW value in faeces was significant higher in LR compared with EW and ER (P < 0.05). The mean PL and PW values in faeces were lower in ER than LR (P < 0.01), but no difference was found between EW and LW. There was a difference in the mean PL and PW values in faeces between white clover and red clover with the highest value in LR, followed by the white clovers and then the ER with the lowest value (P < 0.01).
Particle size distribution in boli, rumen contents and faeces measured after dry sieving
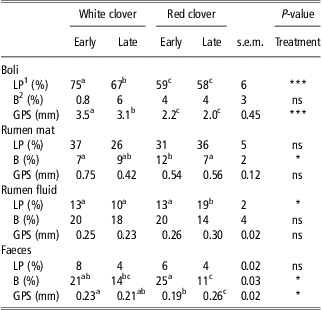
Particle size in boli, rumen mat, rumen fluid and faeces from cows fed different clover species measured by sieving is presented in Table 5. There was a higher mean particle size and a higher proportion of large particle retained on the sieves with a pore size >1 mm in boli from cows fed white clover compared with red clover (P < 0.001). Early harvest of white clover caused a significantly higher mean particle size and a higher proportion of large particles (>1 mm) in boli compared with LW (P < 0.001), and in the rumen fluid the amount of large particles was significantly higher in LR compared with the three other treatments (P < 0.05). Early harvest of red clover silage caused a higher proportion of rumen mat and faeces particle DM retained in the bottom bowl (P < 0.05). The mean particle size in faeces increased because of late harvest in red clover (P < 0.05).
Particle size (mm) in boli, rumen mat, rumen fluid and faeces by cows fed different clover species measured by sieving
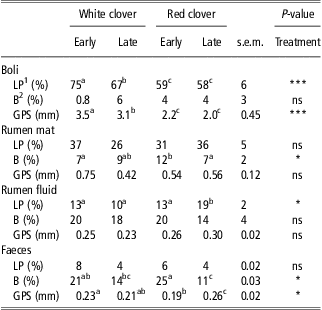
GPS = geometric particle size.
1LP: % large particles retained on the sieves with a particle size of 4.75 + 2.36 + 1.0 mm.
2B: % particles retained in the bottom bowl.
***P < 0.001, **P < 0.01, *P < 0.05, TS 0.05 < P < 0.10.
The proportion of large and small particles and the GPS value of the 1st, 5th, 10th, 15th and 25th feed boli did not differ between boli numbers (data not shown).
Table 6 shows the proportion of long particles (LP) retained on sieves with a pore size larger than 1 mm and particles retained in the bottom bowl. Furthermore, the particle size values in content sampled from the ventral sac before and after the morning meal are shown. There were a higher proportion of small particles in the samples from the ventral sac collected before the morning meal compared with the samples collected after the morning meal and samples from the rumen evacuation (P < 0.001). The mean particle size was higher after the morning meal than before (P < 0.05). There was no interaction between collection time and treatment.
Particle retained on sieves larger than 1 mm and at the bottom bowl and particle size (mm) in rumen content sampled at different times from cows fed different clover species measured by sieving

GPS = geometric particle size.
1There was no interaction between collection time and treatment.
2% large particles retained on the sieves with a particle size of 4.75 + 2.36 + 1.0 mm.
3% particles retained in the bottom bowl.
***P < 0.001, **P < 0.01, *P < 0.05, TS 0.05 < P < 0.10.
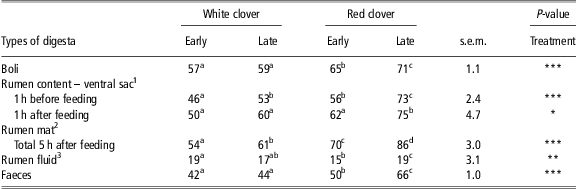
The content of particle DM in DM (PDM) ranged from 15% in rumen fluid from cows fed early harvested red clover silage to 86% in rumen mats from cows LR (Table 7). Late harvest caused a higher PDM value in feed boli, rumen mat, rumen fluid, rumen samples and faeces from cows fed red clover silage and rumen mat and rumen samples collected before the morning meal from cows fed white clover silage (P < 0.001).
Particle DM relative to total DM (%) in the different types of digesta
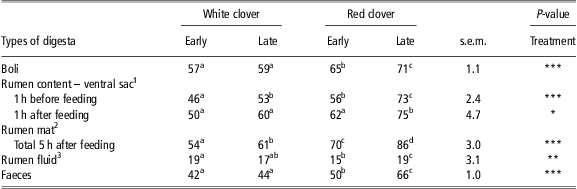
1Rumen sample collected in the ventral rumen sac.
2Rumen mat refers to the solid material collected on a wire net during rumen evacuation.
3Rumen fluid refers to the fluid material collected during rumen evacuation.
***P < 0.001, **P < 0.01, *P < 0.05, TS 0.05 < P < 0.10.
The particle size in rumen mat, rumen fluid and faeces relative to the particle size in boli is shown in Table 8. The proportion of large particles >1 mm was higher in the boli samples compared with rumen mat and rumen mat was higher than rumen fluid and faeces (P < 0.001). The proportion of particles retained in the bottom bowl increased from boli samples to rumen samples and further to rumen fluid (P < 0.001). The proportion of small particles did not differ between rumen fluid and faeces. The mean particle size decreased generally from boli samples to rumen mat and further to rumen fluid (P < 0.001). However, the GPS was not different between rumen fluid and faeces.
The particle size in rumen mat, rumen fluid and faeces relative to the particle size in boli

GPS = geometric particle size.
1Rumen mat refers to the solid material collected on a wire net during rumen evacuation.
2Rumen fluid refers to the fluid material collected during rumen evacuation.
3Material refers to boli, Rc, Rf and faeces.
4There was no interaction between material and treatment.
5% large particles retained on the sieves with a particle size of 4.75 + 2.36 + 1.0 mm.
6% particles retained in the bottom bowl.
***P < 0.001, **P < 0.01, *P < 0.05, TS 0.05 < P < 0.10.
Discussion
Material and methods
Dry cows were used because the intention was to feed clover silages as the sole feed without any supplements to make sure that the effects seen in the experiment, regarding particle size and chewing activity only derived from the clover silages. All cows fed EW ad libitum during the adaption period suffered from subclinical bloat around the morning feeding with rumen foam, which complicated opening of the rumen fistula. However, the subclinical bloat condition disappeared at the restrictive feeding regime during the recording period.
A feeding level of 80% of ad libitum intake was chosen in the present experiment to avoid bias against more lignified clover parts.
Silages
The leaf/stem proportion is of crucial importance for the feeding value because the digestibility of the stem is lower than leaves and as the lignification mainly takes place in the stem. The stem proportion varies depending on the maturity stage and clover species. The stem part in red clover peaks during the summer. In white clover it is only the leaves, petioles and flowers that are harvested, whereas the stems are the offshoots laying on the soil. Søegaard and Weisbjerg (Reference Søegaard and Weisbjerg2007) studied the competitiveness and quality of white and red clover and alfalfa in spring growth and regrowth. They found that the differences in cell wall characteristics between red clover leaves and stems were less than for alfalfa and white clover. In this experiment, the ADL content in the leaves and petioles increased because of delayed harvest in white clover, whereas the level in red clover appeared independent of harvest time. The INDF/NDF ratio in the leaves was more or less the same in EW and LW, whereas the proportion in red clover leaves increased from 14 to 23 due to later harvest time. The ADL/INDF ratio ranged from 91% in EW to 97% in LW. The ADL value in the ER stem is higher than the INDF value. Clover has a high content of pectins compared with grasses. Pectins are known to challenge the detergent fibre analyses by forming quaternary detergent precipitate gels in the presence of Ca and acidity (van Soest et al., Reference Van Soest, Robertson and Lewis1991). The INDF/NDF ratio in the petioles is higher in the red clover species than white clover when harvest time is taken into consideration.
Intake and eating rate
The highest ad libitum silage NDFI value was found in cows fed red clover silage and for both clover types, the NDFI was highest for the late harvest silages. Kuoppala et al. (Reference Kuoppala, Ahvenjärvi, Rinne and Vanhatalo2009) also found a higher NDFI with late harvest red clover silage. The late harvest increased the DMI with 0.5 and 0.1 kg for white and red clover silages, respectively. It is in agreement with results of Vanhatalo et al. (Reference Vanhatalo, Pursiainen, Kuoppala, Rinne and Tuori2008) who found an increase of 1 kg in daily DMI when more mature red clover silage was fed. The ad libitum intake of NDF ranged from 0.31% when feeding EW to 0.77% of BW in LR (Table 2). This indicates metabolic restricted feed intake, as LR had a lower energy value per kg DM. Therefore, the feed intake was higher at that treatment. Beauchemin and Iwaasa (Reference Beauchemin and Iwaasa1993) examined alfalfa hay at two maturity stages fed to heifers with no supplement of concentrate. In congruence with the present experiment, the NDFI was 0.54% and 0.68% of BW for early and late alfalfa hay, respectively.
The eating rates recorded at day 1 in the recording period ranged from 49 in LR to 126 g DM/min in EW. These values correspond with 8 to 20 min eating time per kg DM, which is much lower compared with the mean effective eating time throughout the 24 h period ranging from 32 to 51 min/kg DMI (Table 2). The reason for these differences might be that the eating rate values are measured in the beginning of a meal when the cows are hungry. Furthermore, in this experiment the cows are fed restrictively, which may stimulate the rate of eating according to Baumont et al. (Reference Baumont, Malbert and Ruckebusch1990), who showed that the eating rate was highest in the beginning of a forage meal. A high eating rate (g DM/min) and a shorter eating time (min/kg DMI) for EW correlates with a higher proportion of LP and a higher mean particle size value in boli. On the contrary, feeding LR led to the lowest eating rate (g DM/min), highest eating time (min/kg DMI) and as a consequence the smallest amount of large particles and the lowest particle size value in boli.
Chewing activity
The eating time (min/kg DMI) was higher for the LR compared with the other treatments. The mean eating time (min/kg NDFI) was higher for EW compared with ER and LR, whereas the rate of eating (g NDF/min) did not deviate from ER and LR. This could indicate that the recorded eating time for EW treatment was overestimated due to a low intake of NDF and consequently a low daily chewing activity with relative short and irregular eating periods or chewing. Within same clover species, there was no effect of harvest time on the eating time (min/kg DMI, min/kg NDFI). In agreement, Beauchemin and Yang (Reference Beauchemin and Yang2005) did not find any effect of eating time with increasing amount of structural fibre in corn silage fed to lactating cows. The BCR was highest for the most mature crop LR, with 3 to 5 more JM/min compared with the other treatments. The higher effective mean eating time (min/kg NDFI) at EW compared with ER and LR is probably due to a need for chewing also on fibre poor rations. Further, short eating times were seen for EW compared with ER and EL. The cows on the EW diet had the lowest intake of structural fibre and probably the highest sensation of hunger. The ad libitum intake of NDF ranged from 0.31% by feeding EW to 0.77% of BW when LR was fed (Table 2). These values are lower than the maximum NDFI values of 1.1% of BW predicted by Mertens (Reference Mertens1997) in cattle fed forage ad libitum.
The intake of forage NDF is considered the major factor affecting the daily time spent ruminating. In this study, the rumination time reflected the intake of structural fibre in the diet as found by Beauchemin and Iwaasa (Reference Beauchemin and Iwaasa1993) in an experiment with alfalfa hay fed to heifers. The daily ruminating time tended to correlate with the duration of the ruminating periods indicating that increased rumination is obtained by longer periods and not by more periods as observed by Beauchemin and Iwaasa (Reference Beauchemin and Iwaasa1993). Beauchemin and Iwaasa (Reference Beauchemin and Iwaasa1993) also found an effect by harvest time of alfalfa hay on ruminating time in min/kg DMI but not in min/kg NDFI and number of JM/kg NDFI as seen in this experiment.
In general, the daily time spent ruminating, the number of ruminating cycles and the number of JM during ruminating appears to be closely related to the daily intake of forage NDF, and not depended on the clover species or harvest time. Nørgaard et al. (Reference Nørgaard, Nadeau, Volden, Randby, Aaes and Mehlqvist2010) presented a model for adjusting the mean rumination time per kg forage NDF according to a BW of 625 kg and NDF intake of 0.7% of BW. Using that model, the adjusted mean rumination time values range from 71 to 75 min/kg NDFI for EW, LW and ER, whereas LR was 98 min/kg NDFI, but the difference was not significant.
There was no effect of harvest time on mean total chewing time (min/kg NDFI), which is in agreement with Beauchemin et al. (Reference Beauchemin, Zelin, Genner and Buchanan-Smith1989) and Rinne et al. (Reference Rinne, Huhtanen and Jaakkola2002) in their experiments with dairy cattle. The daily chewing time and the number of recorded JM during total chewing appear to increase proportionally with concentration of forage NDF, leading to no effect of clover species or harvest time on the mean chewing time or mean number of JM/kg forage NDF intake in accordance with Beauchemin and Buchanan-Smith (Reference Beauchemin and Buchanan-Smith1989) in an experiment with dairy cattle.
Particle size distribution in boli, rumen mat and faeces
The distribution of PL in solid rumen mat and faeces showed one peak, whereas the distribution of PW had two peaks (Figures 1 and 2). These observations differ from results from Nørgaard and Sehic (Reference Nørgaard and Sehic2003) and Nørgaard and Kornfelt (Reference Nørgaard and Kornfelt2006) who found only one peak value for PL and PW in faeces from cattle fed grass silage or barley straw only. These characteristics might be crop specific and could be related to the legumes. Red clover is an upright growing plant like alfalfa, whereas the white clover spreads by stolons, which are horizontal above-ground stems. Clover crops generally have a lower content of NDF than grasses and a higher lignification of the cell wall (Ulyatt et al., Reference Ulyatt, Thomson, Beever, Evans and Haines1988). Ulyatt et al. (Reference Ulyatt, Thomson, Beever, Evans and Haines1988) found the lowest NDF content in the leaves of white clover. In the petiole, the content was higher, whereas it increased in the flowers at advancing maturity (Wilman and Altimimi, Reference Wilman and Altimimi1984). The same result was found in the red clover crop but the difference was the stem part, which gets more lignified during the summer, whereas in white clover very few stems were harvested. The first peak on PDF(PW) PW possibly represents the most frequent PW for particles from the low lignified leaves. The second peak might represent particles from the more lignified stems in red clover and petiole residues from white clover. Nørgaard and Kornfelt (Reference Nørgaard and Kornfelt2006) and Jalali et al. (Reference Jalali, Nørgaard, Weisbjerg and Nielsen2012) only found one peak value in cattle and sheep fed grass silage, respectively. The two peaks might be regarded as a kind of footprint of the uniformity of the forage eaten by ruminants. This might be due to the fact that the petioles and stems in the clover species account for a lower proportion of DM compared with alfalfa crops. It is worth mentioning that these results can only be seen because the particles are scanned. In faeces, there was a difference between the mode 2 values for PW with higher values for the LR compared with ER. The same tendency is seen for the white clover but the difference is not significant between EW and LW. This corresponds with the fact that the NDF in the leaves is less lignified than the NDF in the stems and the two peaks represent leaves and stems, respectively.
Probability density distribution of particle length (PL) in faeces from Jersey cows fed different clover silages.

Probability density distribution of particle width (PW) in solid rumen mat from Jersey cows fed different clover silages.

In faeces, the mean PL and PW and the mode PL values were highest for the LR. Rustas et al. (Reference Rustas, Nørgaard, Jalali and Nadeau2010) found a larger mean faecal particle size with later maturity of whole-crop barley silage and Nørgaard and Kornfelt (Reference Nørgaard and Kornfelt2006) and Jalali et al. (Reference Jalali, Nørgaard, Weisbjerg and Nielsen2012) found a larger mean particle size in faeces from cows fed barley straw than early cut grass silage. An explanation for the fact that the difference is only found in red clover could be that the differences in content of structural fibre are smaller in white clover than in red clover.
The particle size values obtained by sieving showed similar results for rumen mat and faeces samples as obtained by image analysis (Table 4). Feeding EW appeared to result in a higher proportion of large particles and a larger mean particle size in boli. The low lignification of the NDF fibre in EW might have caused softer fibre particles, which might be easier to swallow during eating and easier to masticate during rumination. Feeding ER resulted in a lower proportion of large particles in rumen fluid and a smaller mean particle size in faeces.
Rumen samples were collected at different time intervals to study eventual effects of distance from eating on the particle size and to see if the samples collected from the rumen evacuation were representative for the particle size in general. For both small and large particles, there was a difference in the particle size between the samples collected before and after the morning meal (Table 6). The cows had one to two ruminating periods before the rumen evacuation at noon. Despite that, the particles did not differ in size from the particles in rumen samples collected 1 h after eating. The mean particle size value increased from before to after feeding. The mean particle size in the sample from rumen evacuation did not deviate from either the first or the second sample collected in the ventral rumen sac.
The proportion of particle DM values in boli, rumen mat, rumen fluid and faeces samples from cows fed late red clover silage increased because of delayed harvest and were generally higher compared with the white clover crops (Table 7). Similar results have also been found by Jalali et al. (Reference Jalali, Nørgaard, Weisbjerg and Nielsen2012) in faeces from llamas, sheep and goats fed forage harvested at different stage of maturity.
Looking at the GPS values and the proportion of large particle in different types of digesta, it appears that the GPS value decreases from boli to rumen mat and further to rumen fluid, whereas the GPS values for rumen fluid were not higher compared with faeces particles (Table 8). These results make good biological sense, since no particle size reduction is expected after passage from the rumen.
Conclusions
The mean ruminating and total chewing activity per kg legume NDF was not significantly affected by clover species or harvest time. The distribution of PL in rumen mat and faeces had only one peak, whereas the distribution of PW showed two peaks for both white and red clover diets, and the two peak values for PW are most likely related to residues from leaves and stems/petioles, respectively. Furthermore, the second peak value on the distribution of PW in faeces increased because of delayed harvest time and was linearly related to the INDF/NDF ratio in the clover silages. The mode PL value in faeces was positively related to the INDF/NDF ratio in the clover silage. The early harvested white clover showed the lowest mean particle size of swallowed boli particles. The mean particle size of fibrous particles decreased along the digestive tract by 90% relative to boli.
Acknowledgements
This work was supported by ‘Mælkeafgiftsfonden’, The Faculty of Agricultural Science at Aarhus University and Research School for Animal Production and Health (RAPH) at the University of Copenhagen, Denmark.