Introduction
The disruption of connectivity between brain regions may underlie the core pathology of schizophrenia (Friston, Reference Friston1999; Friston & Frith, Reference Friston and Frith1995). One of the most consistent observations in functional imaging is a network of brain regions, referred to as the default mode network (DMN) (Raichle et al., Reference Raichle, MacLeod, Snyder, Powers, Gusnard and Shulman2001). The DMN shows higher activity during a ‘resting-state,’ when the participants are not actively involved in tasks that demand attention, as opposed to cognitive challenges.
The DMN has been a focus of imaging research into neuropsychiatric disorders, including schizophrenia (Alonso-Solis et al., Reference Alonso-Solis, Vives-Gilabert, Grasa, Portella, Rabella, Sauras and Corripio2015; Garrity et al., Reference Garrity, Pearlson, McKiernan, Lloyd, Kiehl and Calhoun2007; Hu et al., Reference Hu, Zong, Mann, Zheng, Liao, Li and Tang2017; Salgado-Pineda et al., Reference Salgado-Pineda, Fakra, Delaveau, McKenna, Pomarol-Clotet and Blin2011; Zhao et al., Reference Zhao, Li, Feng, Shen, Li, Xu and Xu2018). The most common finding in recent studies is hyper-connectivity within the DMN in patients with schizophrenia, compared to healthy controls (Hu et al., Reference Hu, Zong, Mann, Zheng, Liao, Li and Tang2017; Liu et al., Reference Liu, Kaneko, Ouyang, Li, Hao, Chen and Liu2012; Whitfield-Gabrieli et al., Reference Whitfield-Gabrieli, Thermenos, Milanovic, Tsuang, Faraone, McCarley and Seidman2009). Several other studies, however, have found either reduced connectivity in the DMN in schizophrenia (Bluhm et al., Reference Bluhm, Miller, Lanius, Osuch, Boksman, Neufeld and Williamson2007; Bluhm et al., Reference Bluhm, Miller, Lanius, Osuch, Boksman, Neufeld and Williamson2009; Camchong, MacDonald, Bell, Mueller, & Lim, Reference Camchong, MacDonald, Bell, Mueller and Lim2011; Rotarska-Jagiela et al., Reference Rotarska-Jagiela, van de Ven, Oertel-Knochel, Uhlhaas, Vogeley and Linden2010) or a mixed pattern of increased and decreased connections within the DMN (Garrity et al., Reference Garrity, Pearlson, McKiernan, Lloyd, Kiehl and Calhoun2007; Mannell et al., Reference Mannell, Franco, Calhoun, Canive, Thoma and Mayer2010). Our previous study suggested hypo-connectivity among the default network components in the first episode of schizophrenia, and therefore, a disruption of communication and coordination within the network (Fan et al., Reference Fan, Tan, Wang, Yang, Fan, Xiang and Zuo2019). This alteration might be the underlying cause of the clinical symptoms and abnormal neuropathology observed in schizophrenia. Moreover, a dysfunctional DMN has been reported in patients with first-episode (Fan et al., Reference Fan, Tan, Wang, Yang, Fan, Xiang and Zuo2019; Hu et al., Reference Hu, Zong, Mann, Zheng, Liao, Li and Tang2017), early-onset (Zhao et al., Reference Zhao, Li, Feng, Shen, Li, Xu and Xu2018), and chronic schizophrenia (Camchong et al., Reference Camchong, MacDonald, Bell, Mueller and Lim2011; Hu et al., Reference Hu, Zong, Mann, Zheng, Liao, Li and Tang2017), in individuals at ultra-high risk of psychosis (Shim et al., Reference Shim, Oh, Jung, Jang, Choi, Kim and Kwon2010), and also in first-degree relatives of patients with schizophrenia (Whitfield-Gabrieli et al., Reference Whitfield-Gabrieli, Thermenos, Milanovic, Tsuang, Faraone, McCarley and Seidman2009).
The DMN includes three subsystems: the core (anterior medial prefrontal cortex [aMPFC] and posterior cingulate cortex [PCC]), the dorsomedial prefrontal cortex (dMPFC), and the medial temporal lobe (MTL), each with distinct functional characteristics (Andrews-Hanna, Reidler, Sepulcre, Poulin, & Buckner, Reference Andrews-Hanna, Reidler, Sepulcre, Poulin and Buckner2010). The core components of the DMN are two medial cortical regions, active during tasks that require self-relevant, affective decisions (Andrews-Hanna et al., Reference Andrews-Hanna, Reidler, Sepulcre, Poulin and Buckner2010). The two other subsystems contribute to distinct component processes that are differentially linked to individuals’ mental states and memory-based scene construction, respectively (Andrews-Hanna et al., Reference Andrews-Hanna, Reidler, Sepulcre, Poulin and Buckner2010; Andrews-Hanna, Saxe, & Yarkoni, Reference Andrews-Hanna, Saxe and Yarkoni2014). Previous fMRI studies have reported decreased deactivation in the dMPFC during working memory tasks in chronic schizophrenia patients (Pomarol-Clotet et al., Reference Pomarol-Clotet, Salvador, Sarro, Gomar, Vila, Martinez and McKenna2008; Whitfield-Gabrieli et al., Reference Whitfield-Gabrieli, Thermenos, Milanovic, Tsuang, Faraone, McCarley and Seidman2009). In addition, decreased connectivity between the dMPFC and PCC during resting state (Bluhm et al., Reference Bluhm, Miller, Lanius, Osuch, Boksman, Neufeld and Williamson2007) and working memory tasks (Sambataro et al., Reference Sambataro, Blasi, Fazio, Caforio, Taurisano, Romano and Bertolino2010) has been reported, indicating communication deficits between the core and dMPFC subsystems of the DMN in schizophrenia. Moreover, a disrupted dMPFC subsystem has been associated with a familial risk of schizophrenia (Dodell-Feder, Delisi, & Hooker, Reference Dodell-Feder, Delisi and Hooker2014). Auditory verbal hallucinations are related to the strength of the connectivity from the inferior temporal gyrus to the aMPFC and PCC in patients with schizophrenia (Zhao et al., Reference Zhao, Li, Feng, Shen, Li, Xu and Xu2018). In addition, alterations of functional connectivity, activation, and perfusion of regions in the MTL subsystem have been reported in several papers investigating schizophrenia (Friston, Reference Friston1999; Garrity et al., Reference Garrity, Pearlson, McKiernan, Lloyd, Kiehl and Calhoun2007; Molent, Olivo, Wolf, Balestrieri, & Sambataro, Reference Molent, Olivo, Wolf, Balestrieri and Sambataro2019). Further, in our previous study, we observed abnormalities of the MTL subsystem in first-episode schizophrenia (FES), which correlated with the severity of positive symptoms (Fan et al., Reference Fan, Tan, Wang, Yang, Fan, Xiang and Zuo2019). Abnormal MTL connectivity was also reported in patients with chronic schizophrenia, and the deficit was correlated with impairment in prospection (Yang et al., Reference Yang, Zhang, Li, Wang, Wang, Wang and Chan2019).
In the present study, we examined disorder-specific characteristics of the DMN subsystems in different stages of the illness (i.e. FES and recurrent schizophrenia [RES]). First, we reconstructed individual functional networks within the DMN comprising 11 nodes and then characterized the functional connectivity strength of the DMN. We calculated the mean connectivity strength within the three subsystems to quantify the topological importance of the subsystems of the DMN. Then, we examined the correlations between the three subsystems. We hypothesized: (1) reduced integration of the DMN in FES and RES, compared that to healthy controls; and (2) abnormalities in the MTL subsystem of the DMN, based on our previous study. We also validated our findings in an independent sample of patients and healthy controls.
Methods
Participants
In the primary sample, patients with schizophrenia and healthy controls were recruited from the Beijing Huilongguan Hospital, Beijing, China, including 43 patients with FES (age: 29.1 ± 9.8 years), 82 patients with RES (age: 47.0 ± 10.1 years) and 82 healthy controls (age: 38.3 ± 12.1 years). The inclusion criteria for the patients included: (1) the DSM-IV diagnostic criteria for schizophrenia; (2) right-handedness as confirmed by the short version of the Edinburgh Handedness Scale; and (3) age between 16 and 65 years. Additional inclusion criteria for the FES group included the first outpatient treatment or hospitalization occurring within 2 weeks from the start of the study. The exclusion criteria included: (1) a history of head trauma; (2) current or previous substance or alcohol use disorders (other than nicotine); (3) contraindications for undergoing MRI scan, or an organic brain disease confirmed by MRI; (4) symptoms of significant involuntary movement; and (5) a learning disability or mental retardation. Healthy volunteers had no family history of psychotic illnesses, according to the Family History Research Diagnostic Criteria.
The validation sample comprised 75 patients with FES (age: 24.4 ± 4.7 years), 83 patients with RES (age: 28.3 ± 6.2 years) and 39 healthy controls (31.9 ± 6.5 years), recruited from the Zhumadian Psychiatry Hospital, Henan Province, China. The inclusion and exclusion criteria for the validation sample were the same as above.
All participants provided signed IRB-approved consent forms according to a protocol approved by the Ethics Committee of the Beijing Huilongguan Hospital, Beijing, China, prior to the study.
Clinical procedures
After the participants provided written informed consent, a case report form was completed to document their demographic information and clinical symptoms. Patients were evaluated with the Structured Clinical Interview for DSM-IV (SCID) and the Positive and Negative Symptom Scale (PANSS). The evaluations were performed by one attending psychiatrist from each site, trained for reliability, having achieved intraclass correlation coefficient (ICC) values of 0.80 or above before the trial. An MRI scan was then scheduled; for the FES group, all patients completed the MRI scan within two weeks of the initiation of their antipsychotic medication treatment. The chlorpromazine-equivalent (CPZ) dose was calculated for each patient to consider the effects of the antipsychotic medication (Woods, Reference Woods2003).
MRI protocol
MRI data of the primary cohort were collected on a Siemens Prisma 3 T MRI scanner with a 64-channel head coil. Head motions were minimized by foam pads. Data for structural MRI were acquired using a sagittal T1-weighted 3D-magnetization prepared rapid acquisition gradient echo (MPRAGE) sequence (echo time (TE) = 2.98 ms, inversion time (TI) = 1100 ms, repetition time (TR) = 2530 ms, flip angle (FA) = 7°, field of view (FOV) = 256 × 224 mm2, matrix size = 256 × 224, thickness/gap = 1/0 mm) covering the whole brain. The resting-state functional images were obtained with an echo-planar imaging (EPI) sequence with the following parameters: TR = 2000 ms, TE = 30 ms, FA = 90°, in-plane resolution = 64 × 64, FOV = 224 × 224 mm2, 33 axial slices, thickness/gap = 3.5/0.7 mm, and 240 volumes (8 min). Before the resting-state scan, participants were instructed to close their eyes, remain awake, and think about nothing in particular. After the resting-state fMRI scan, the participants were asked if they fell asleep, and they all denied it.
MRI data of the validation sample were acquired on a GE 3 T MRI scanner. T1-weighted structural images were acquired with a sagittal 3D-MPRAGE sequence (TE = 2.49 ms, TI = 1100 ms, TR = 6.77 ms, FA = 7°, FOV = 256 × 256 mm2, matrix size = 256 × 256, thickness/gap = 1/0 mm) covering the whole brain. The resting-state functional images were obtained with an EPI sequence with the following parameters: TR = 2000 ms, TE = 30 ms, FA = 90°, in-plane resolution = 64 × 64, FOV = 220 × 220 mm2, 33 axial slices, thickness/gap = 4/0 mm, and 210 volumes (7 min).
MRI data analysis
Image preprocessing was performed for every data set using the Connectome Computation System (Xu, Yang, Jiang, Xing, & Zuo, Reference Xu, Yang, Jiang, Xing and Zuo2015) (CCS: http://lfcd.psych.ac.cn/ccs.html). This software provides a common platform for brain connectome analysis, integrating the functionality of AFNI, FSL, and FreeSurfer, thereby extending the utility of FCP scripts (FCON_1000: http://www.nitrc.org/frs/downloadlink.php/2628). It also incorporates the brain surface information reconstructed by FreeSurfer (version 6.0). Image preprocessing comprised both anatomical and functional processing steps. Anatomical and functional preprocessing included: (1) removal of MR image noise using a spatially adaptive non-local means filter (Xing, Zhou, Adelstein, & Zuo, Reference Xing, Zhou, Adelstein and Zuo2011; Zuo & Xing, Reference Zuo and Xing2011); (2) brain surface reconstruction via the recon-all command in FreeSurfer (Dale, Fischl, & Sereno, Reference Dale, Fischl and Sereno1999; Fischl, Reference Fischl2012; Fischl et al., Reference Fischl, Salat, Busa, Albert, Dieterich, Haselgrove and Dale2002; Fischl, Sereno, & Dale, Reference Fischl, Sereno and Dale1999; Segonne et al., Reference Segonne, Dale, Busa, Glessner, Salat, Hahn and Fischl2004); (3) spatial normalization to the MNI152 standard brain space (1 mm isotropic voxel); (4) registration between individual structural and functional images using a white matter (WM) surface boundary-based registration algorithm (Greve & Fischl, Reference Greve and Fischl2009); (5) removal of the first 10 EPI volumes from each scan to allow for signal equilibration (note: to ensure the same timeframe, the first 210 time points were used for both the primary and validation dataset); (6) slice timing correction; (7) 3D motion correction; (8) 4D global mean-based intensity normalization; (9) denoising of head motion with Independent Component Analysis-based Automatic Removal Of Motion Artifacts (ICA-AROMA) (Pruim, Mennes, Buitelaar, & Beckmann, Reference Pruim, Mennes, Buitelaar and Beckmann2015a; Pruim et al., Reference Pruim, Mennes, van Rooij, Llera, Buitelaar and Beckmann2015b), and denoising of mean signals of WM and cerebrospinal fluid (CSF) from the individual WM/CSF mask output using the segmentation routine of FreeSurfer; (10) band-pass temporal filtering (0.01–0.1 Hz); (11) removal of linear and quadratic trends; and finally (12) projection of individual fMRI time series onto the fsaverage surface grid, then down-sampling to the fsaverage5 surface grid (average inter-vertex distance = 4 mm) (Yeo et al., Reference Yeo, Krienen, Sepulcre, Sabuncu, Lashkari, Hollinshead and Buckner2011). The surface-based brain registration (steps 3, 4, and 12) was executed for the subsequent assessments of the functional fractionation of the DMN. For quality control, we firstly checked each T1 and resting-state fMRI dataset visually. No dataset was excluded for head motion artifacts, spiking, or incomplete scans of the whole brain tissue. Secondly, we measured head motion: the inclusion criteria were a maximum absolute head motion displacement/rotation <3 mm/° in x/y/z and a mean frame displacement (FD) <0.5 mm (Power, Barnes, Snyder, Schlaggar, & Petersen, Reference Power, Barnes, Snyder, Schlaggar and Petersen2012; Satterthwaite et al., Reference Satterthwaite, Wolf, Loughead, Ruparel, Elliott, Hakonarson and Gur2012; Van Dijk, Sabuncu, & Buckner, Reference Van Dijk, Sabuncu and Buckner2012). In the primary sample, one control (1.2% of all controls) and 19 patients (one FES and 18 RES; 15.2% of all patients) were excluded because of excessive head motion. In the validation sample, one control (2.6% of all controls) and 12 patients (six FES and six RES; 7.6% of all patients) were excluded. Therefore, the primary dataset included 81 controls, 42 FES, and 64 RES patients, and the validation sample included 38 controls, 69 FES, and 77 RES patients.
We examined the resting-state functional connectivity (RSFC) of 11 seed regions (a sphere with a 6-mm radius) in the DMN (MNI152 standard space with 3 mm isotropic voxels), described in a previous study by Andrews-Hanna (Andrews-Hanna et al., Reference Andrews-Hanna, Reidler, Sepulcre, Poulin and Buckner2010). All seeds were transformed into surface-based space, including the aMPFC, PCC, dMPFC, temporal−parietal junction (TPJ), lateral temporal cortex (LTC), temporal pole (TempP), ventral medial prefrontal cortex (vMPFC), posterior inferior parietal lobule (pIPL), retrosplenial cortex (Rsp), parahippocampal cortex (PHC), and hippocampal formation (HF + ; online Supplementary Figure S1 and Table S1). The seed regions were then masked with the group-level brain tissue mask to exclude non-brain tissue, including all voxels showing non-zero temporal variances, producing the final seed regions of interest (ROIs). Similar to Andrews-Hanna's study, left-lateralized ROIs were used to simplify the analysis, prevent biasing the structure toward the strong correlations exhibited between mirrored (right/left) seed regions, and avoid the strong laterality observed for the lateral parietal ROIs (Liu, Stufflebeam, Sepulcre, Hedden, & Buckner, Reference Liu, Stufflebeam, Sepulcre, Hedden and Buckner2009).
For each of the 11 ROIs, we performed a whole-brain seed-based RSFC analysis for each participant in the left and right hemisphere, vertex by vertex. Individual DMN functional connectivity matrices or graphs were then obtained by calculating the spatial pair-wise correlations of the 11 RSFC maps (Z map) to characterize the functional connectivity of the DMN. Prior to the network analysis (i.e. within-network connectivity and between-network connectivity), we generated individual weighted functional networks by applying a correlation threshold r th of 0 to remove the spurious correlations and consider all the positive correlations. To assess the importance of subsystems in the information communication within the DMN, within-network connectivity was calculated as the mean value of the strength of the connections within the three subsystems of the DMN for each subject, based on their individual DMN matrix. The between-network connectivity was then calculated by averaging the strength of the connections among the three subsystems of the DMN. Within- and between-network connectivities were then used for the subsequent group analysis.
Statistical analysis
To identify abnormal functional connectivity patterns in schizophrenia, we performed Network Based Statistics (NBS) analysis (Zalesky, Fornito, & Bullmore, Reference Zalesky, Fornito and Bullmore2010) and compared the networks between groups using a two-sample t test. The false discovery rate (FDR) with a p value cut-off of 0.05 was applied for the group comparison of connectivity strength to correct for multiple comparisons. Group differences in the network measures (i.e. connectivity within and between subsystems of the DMN) were examined using a one-way analysis of covariance (ANCOVA). Post-hoc tests were performed and examined using FDR correction for multiple comparisons (p < 0.05), adjusting for the effects of age, sex, medication, and head motion (mean FD). To examine whether the network measures correlated with illness duration and medication in the whole patient sample, we conducted a Pearson correlation analysis, adjusting for the effects of age, sex, medication, and head motion (mean FD). The analysis was performed separately for the primary and validation data. Furthermore, we explored the effects of sex and family history of mental illness on the results. Group differences in the network measures between males and females and between patients with and without a family history were examined using ANCOVA. All network topology analyses were performed using GRETNA (www.nitrc.org/projects/gretna) (Wang et al., Reference Wang, Wang, Xia, Liao, Evans and He2015), and the results were visualized on the brain surface using BrainNet Viewer (www.nitrc.org/projects/bnv) (Xia, Wang, & He, Reference Xia, Wang and He2013).
Results
Clinical data
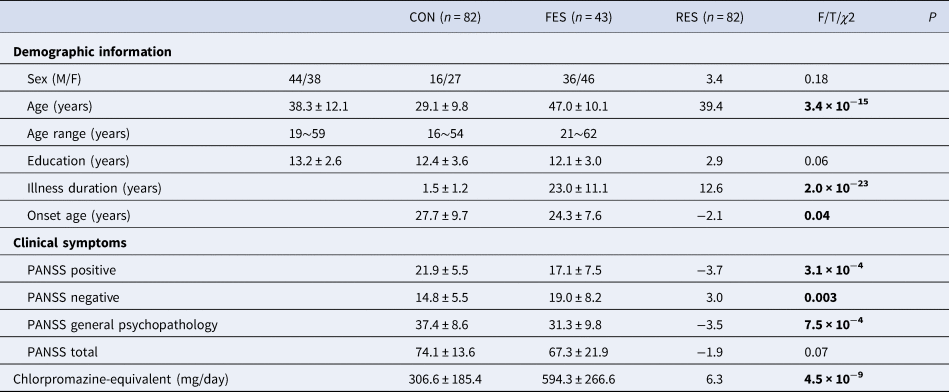
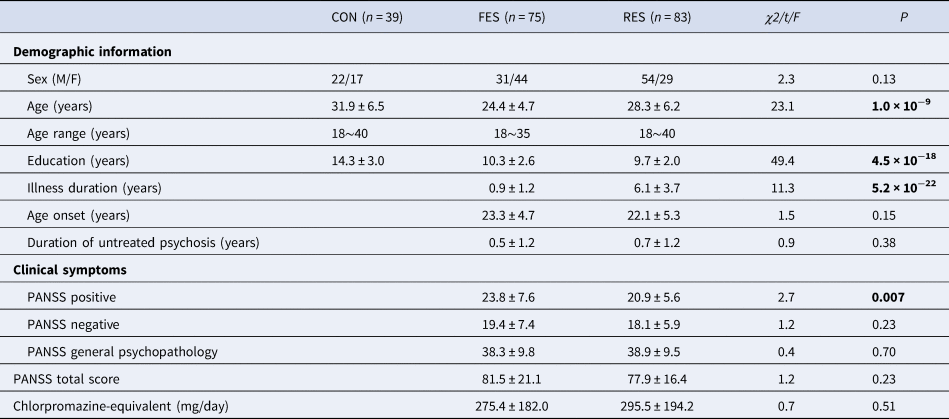
The demographic and clinical characteristics of the participants in the primary and validation samples are shown in Tables 1 and 2, respectively. No significant differences were detected among the three groups in terms of sex and education. Group differences were found in age, onset age, illness duration, PANSS positive, PANSS negative, PANSS general psychopathology, and PANSS total scores (p < 0.05). The RES group in the primary sample was older (t = 14.81, p < 0.001) and took more medication (t = 8.03, p < 0.001) compared to the RES group in the secondary sample. In the statistical analysis, we included age, sex, medication, and mean FD as covariates to consider the effect of these factors.
Demographics of participants in the primary sample

CON, control; FES, first-episode schizophrenia; RES, recurrent schizophrenia; PANSS, positive and negative syndrome scale.
Demographics of participants in the validation sample
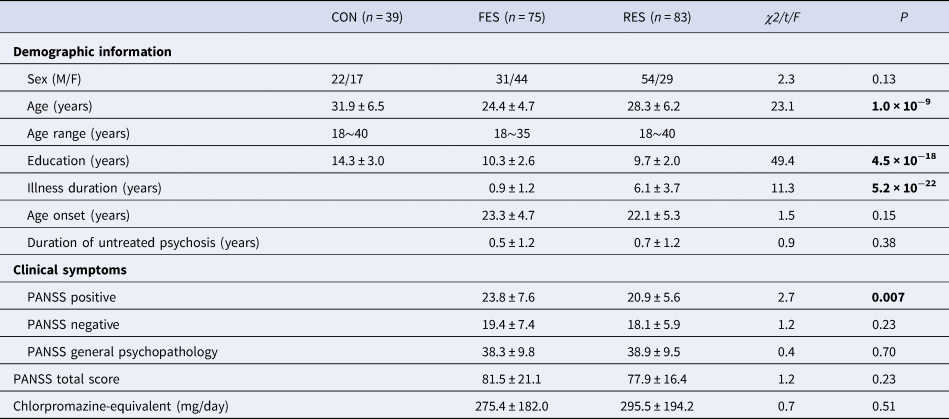
CON, control; FES, first-episode schizophrenia; RES, recurrent schizophrenia; PANSS, positive and negative syndrome scale.
DMN subsystem connectivity
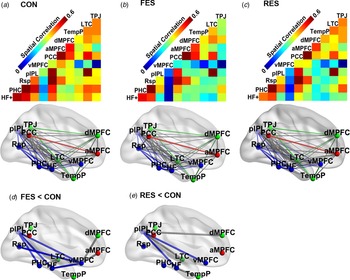
In comparison with controls, the FES group showed reduced functional connectivity within the MTL subsystem (pIPL-PHC, pIPL-HF, pIPL-vMPFC, vMPFC-HF, and vMPFC-Rsp connectivity), between the MTL and dMPFC subsystems (PHC-LTC, HF-LTC, and vMPFC-dMPFC connectivity), and between the MTL and core subsystems (vMPFC-aMPFC connectivity) (Fig. 1d, FDR corrected p < 0.05). The RES group showed significantly reduced functional connectivity within the MTL subsystem (pIPL-HF and pIPL-vMPFC connectivity) and between the MTL and the dMPFC subsystems (pIPL-LTC, HF-LTC, HF-TempP, and pIPL-dMPFC connectivity) compared to controls (Fig. 1e, FDR corrected p < 0.05). No significant difference emerged between the two patient groups.
Functional connectivity of the default mode network and group difference between the three groups. Functional connectivity matrix and maps are shown for the three groups including controls (CON) (a), first-episode schizophrenia (FES) (b) and recurrent schizophrenia (RES) (c). In (a)−(c), nodes with in red, green, and blue ball each represents core subsystem, dorsal medial prefrontal cortex (dMPFC) subsystem, and medial temperal-lobe (MTL) subsystem. The thickness of the lines reflects the strength of the correlation between regions. (d). Group difference of functional connectivity between FES and CON. (e) Group difference of functional connectivity between RES and CON. The results of (d)–(e) are shown under a significance level of p < 0.05 with false discovery rate (FDR) correction. Please find Fig. 1 in color in Supplementary material.

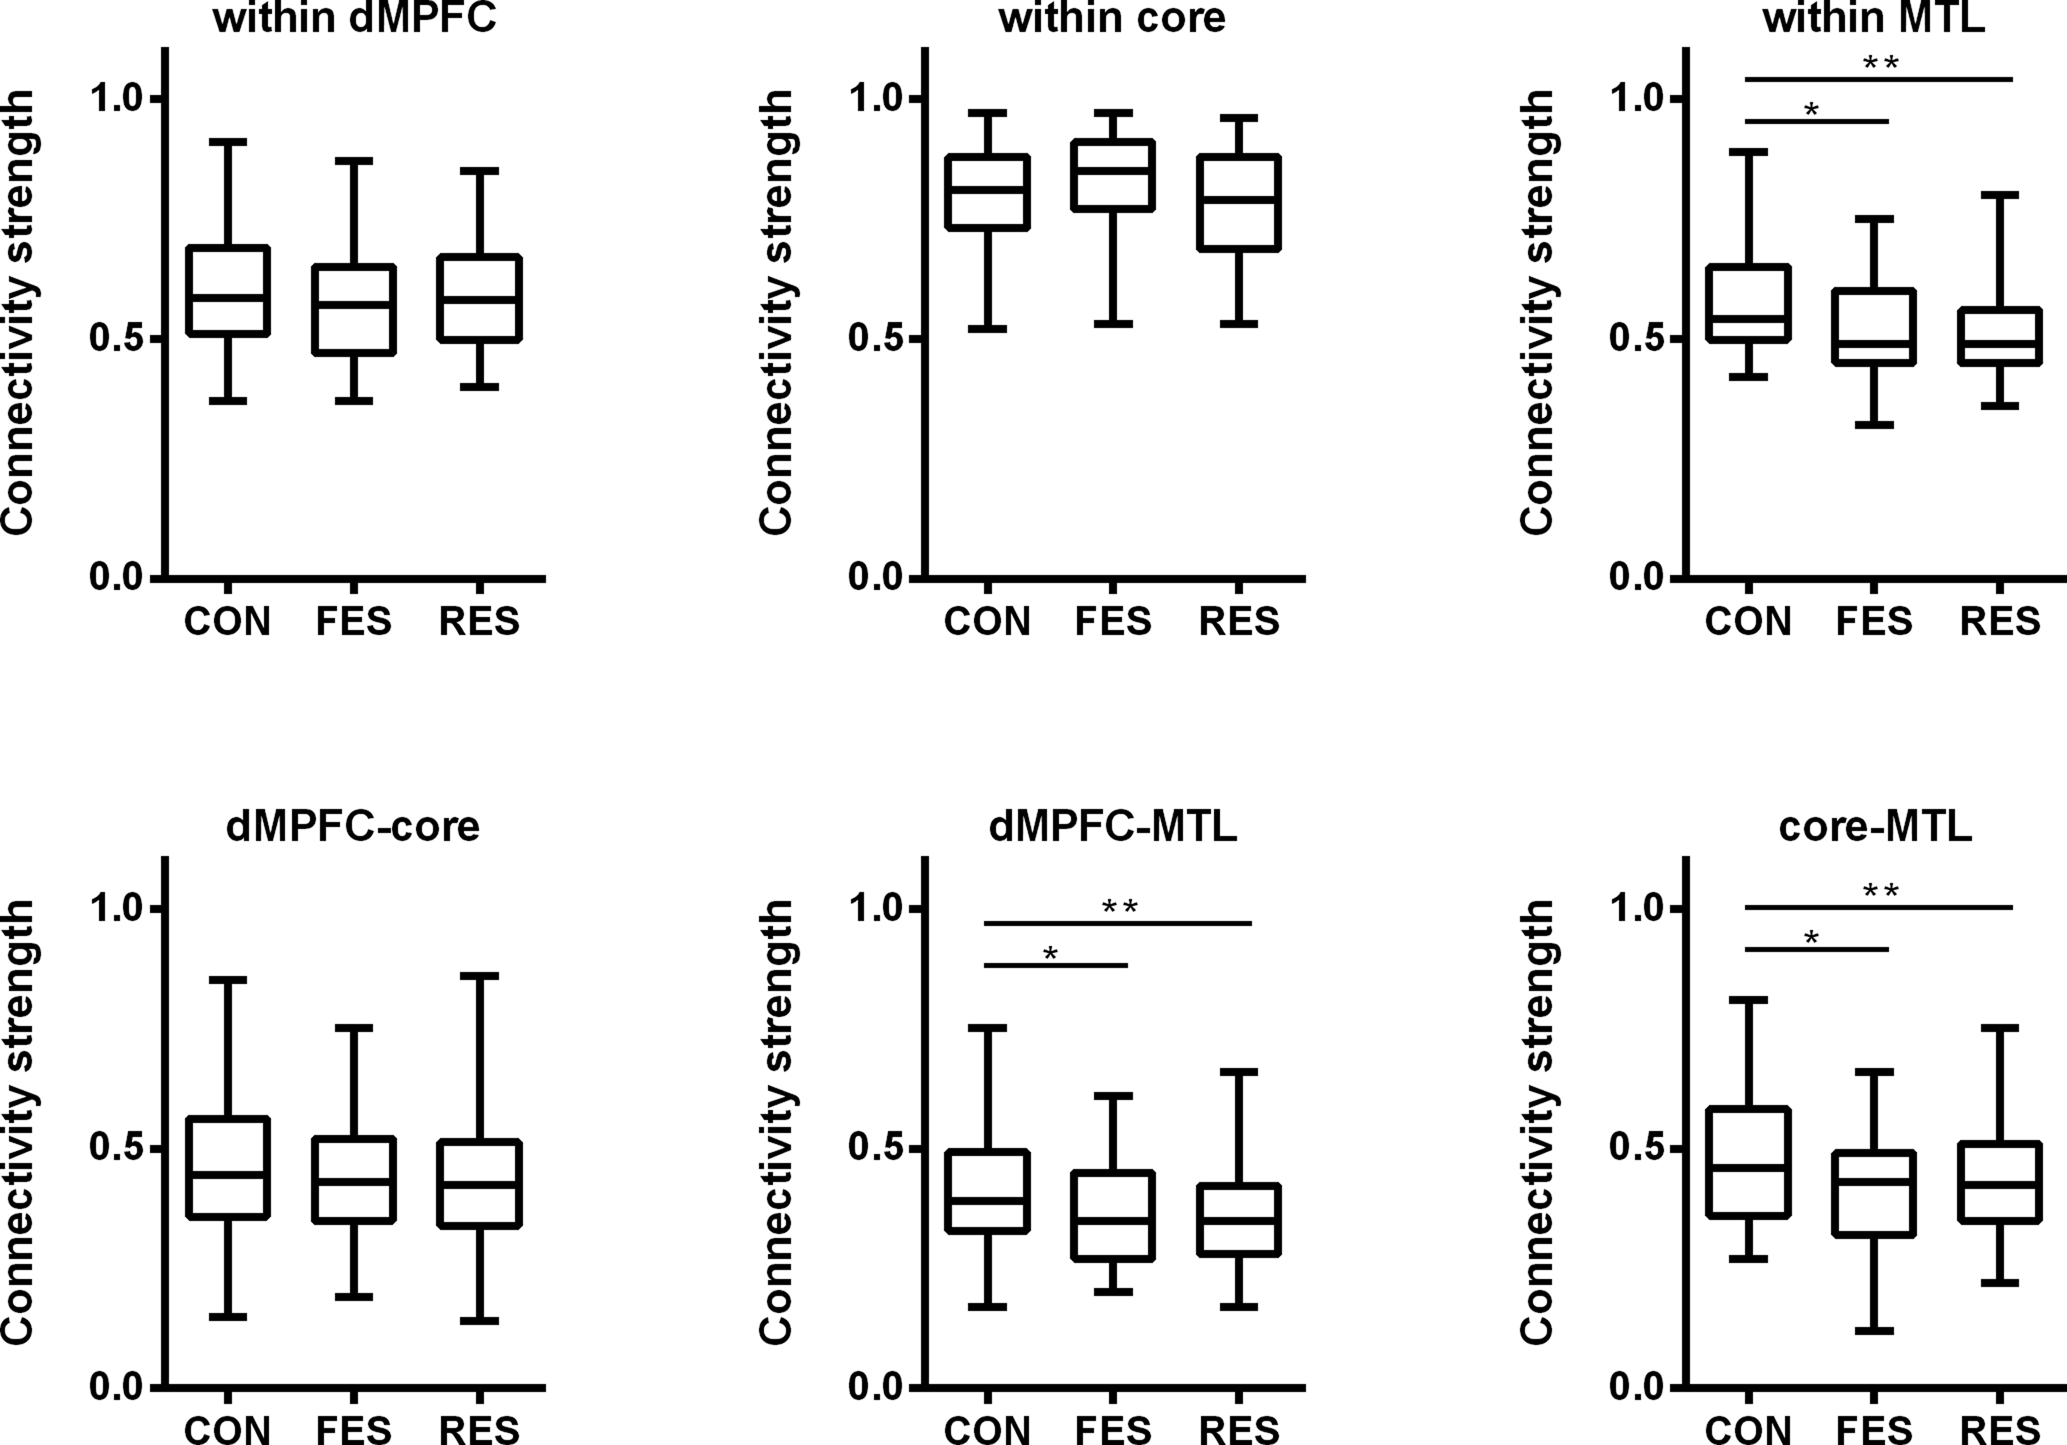
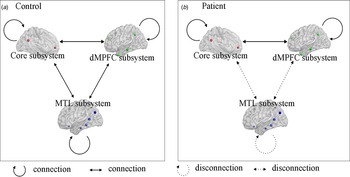
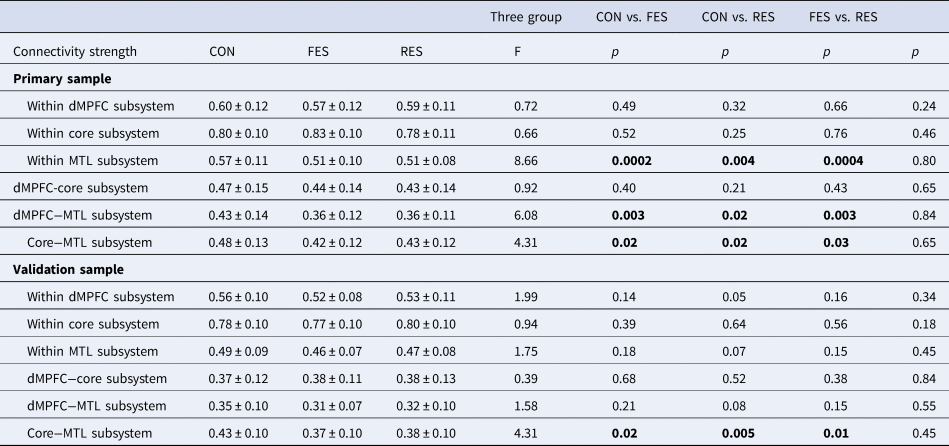
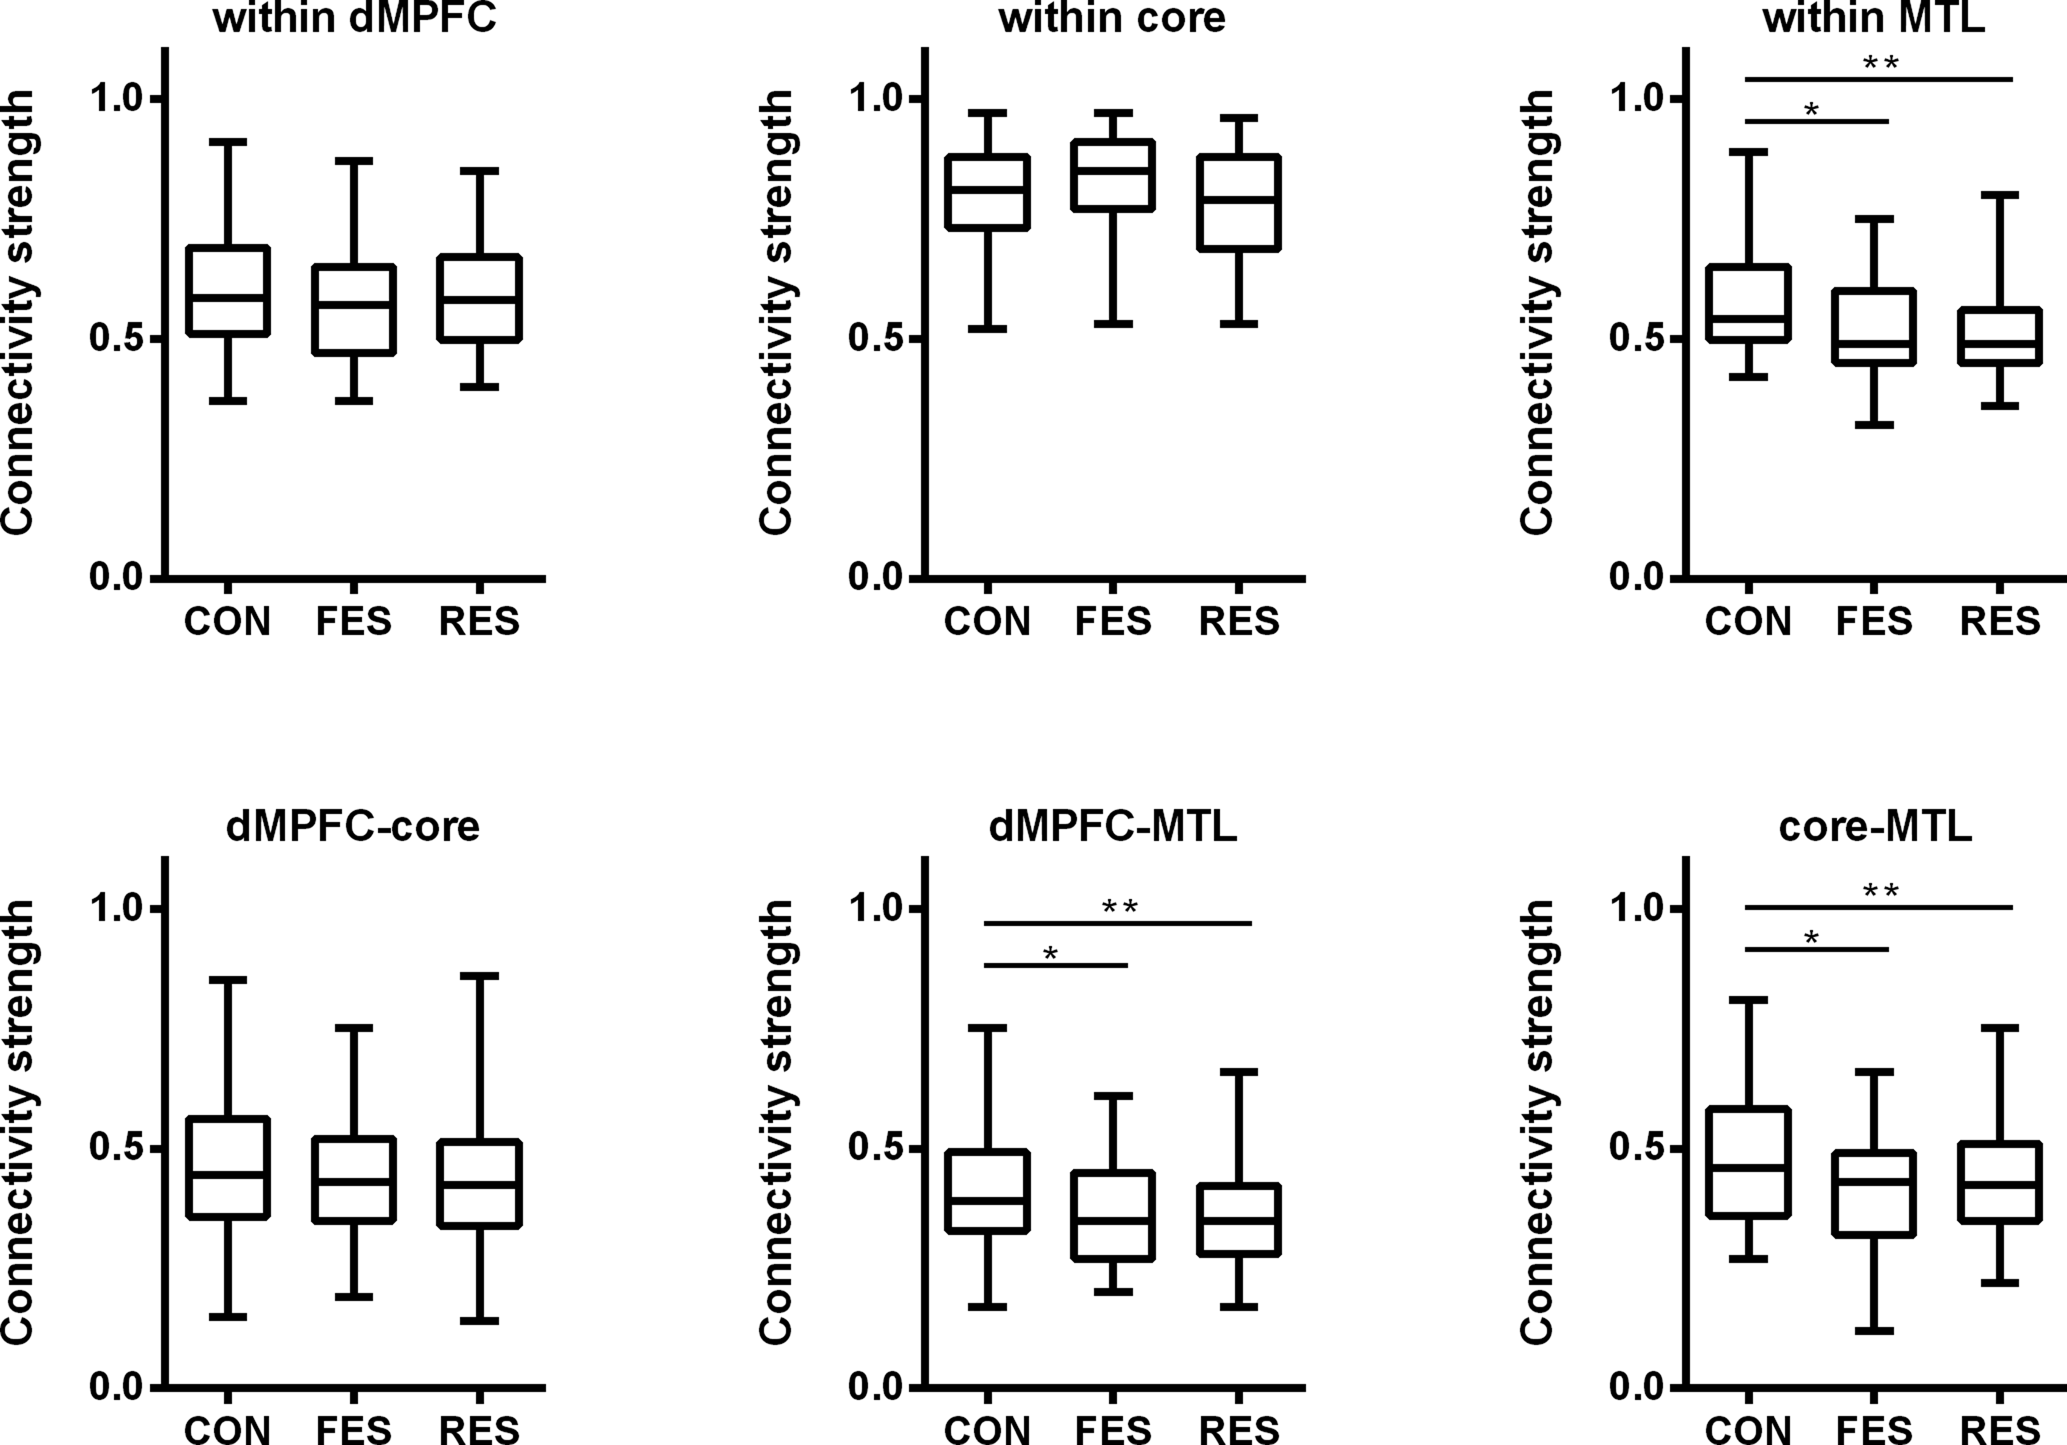
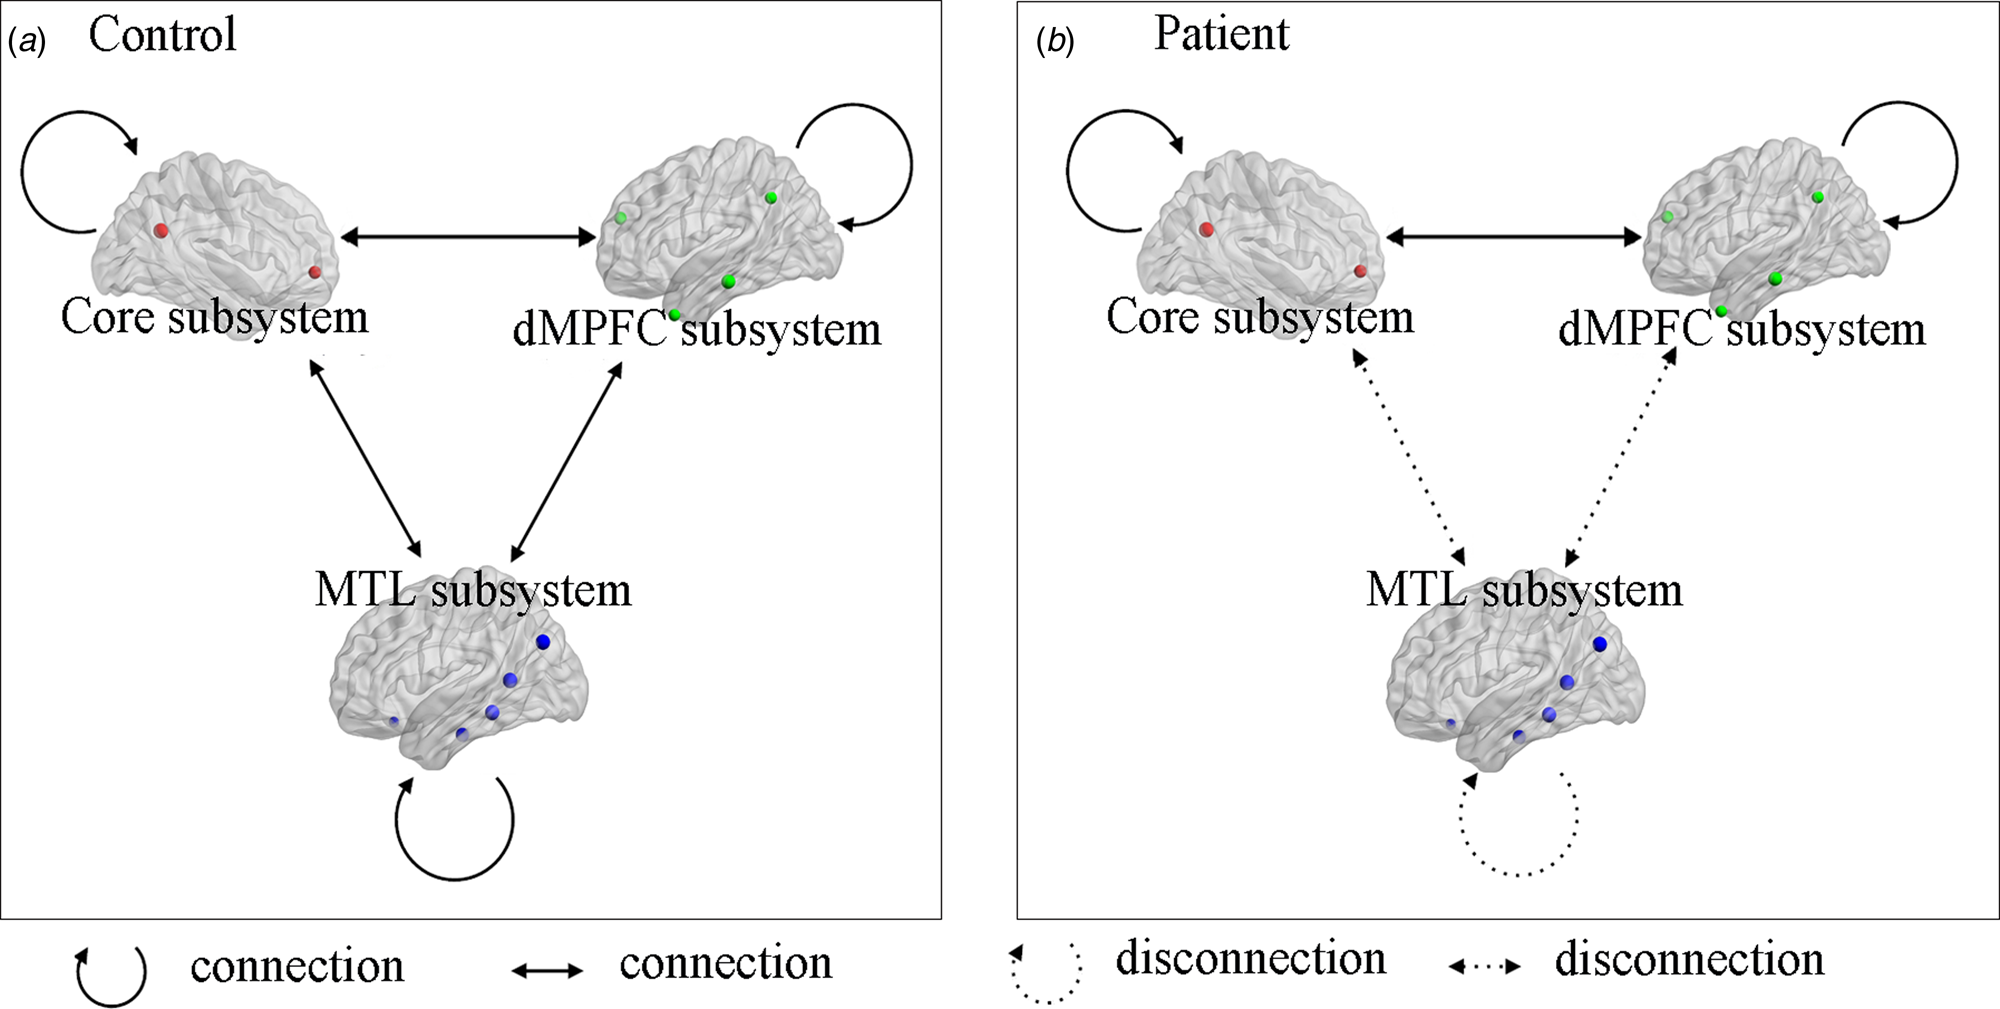
We examined group differences in the strength of functional connectivity within and between subsystems of the DMN in the patient groups compared to controls. As shown in Fig. 2 and Table 3, the connectivity strength within the MTL subsystem was reduced in both the FES and the RES groups, whereas no differences were found between the two patient groups. Furthermore, compared with the healthy controls, the patients showed a significant reduction in the connectivity between the MTL and the other two subsystems (MTL-dMPFC and MTL-core connectivity), with no significant differences between the two patient groups. No significant difference was found in the connectivity strength of the core, dMPFC subsystem, and core-dMPFC connectivity between the three groups. A summary of the results can be found in Fig. 3.
Group differences in connectivity within and between the three DMN subsystems including core, dorsal medial prefrontal cortex (dMPFC) and medial temporal-lobe (MTL) subsystem.
*p < 0.05, **p < 0.005.
Disconnection within and between MTL subsystems in patients with schizophrenia and controls. Please find Fig. 3 in color in Supplementary material.
Connectivity strength within and between subsystems of the DMN

CON, control; FES, first episode schizophrenia; RES, recurrent schizophrenia.
Correlation between functional connectivity and clinical measures
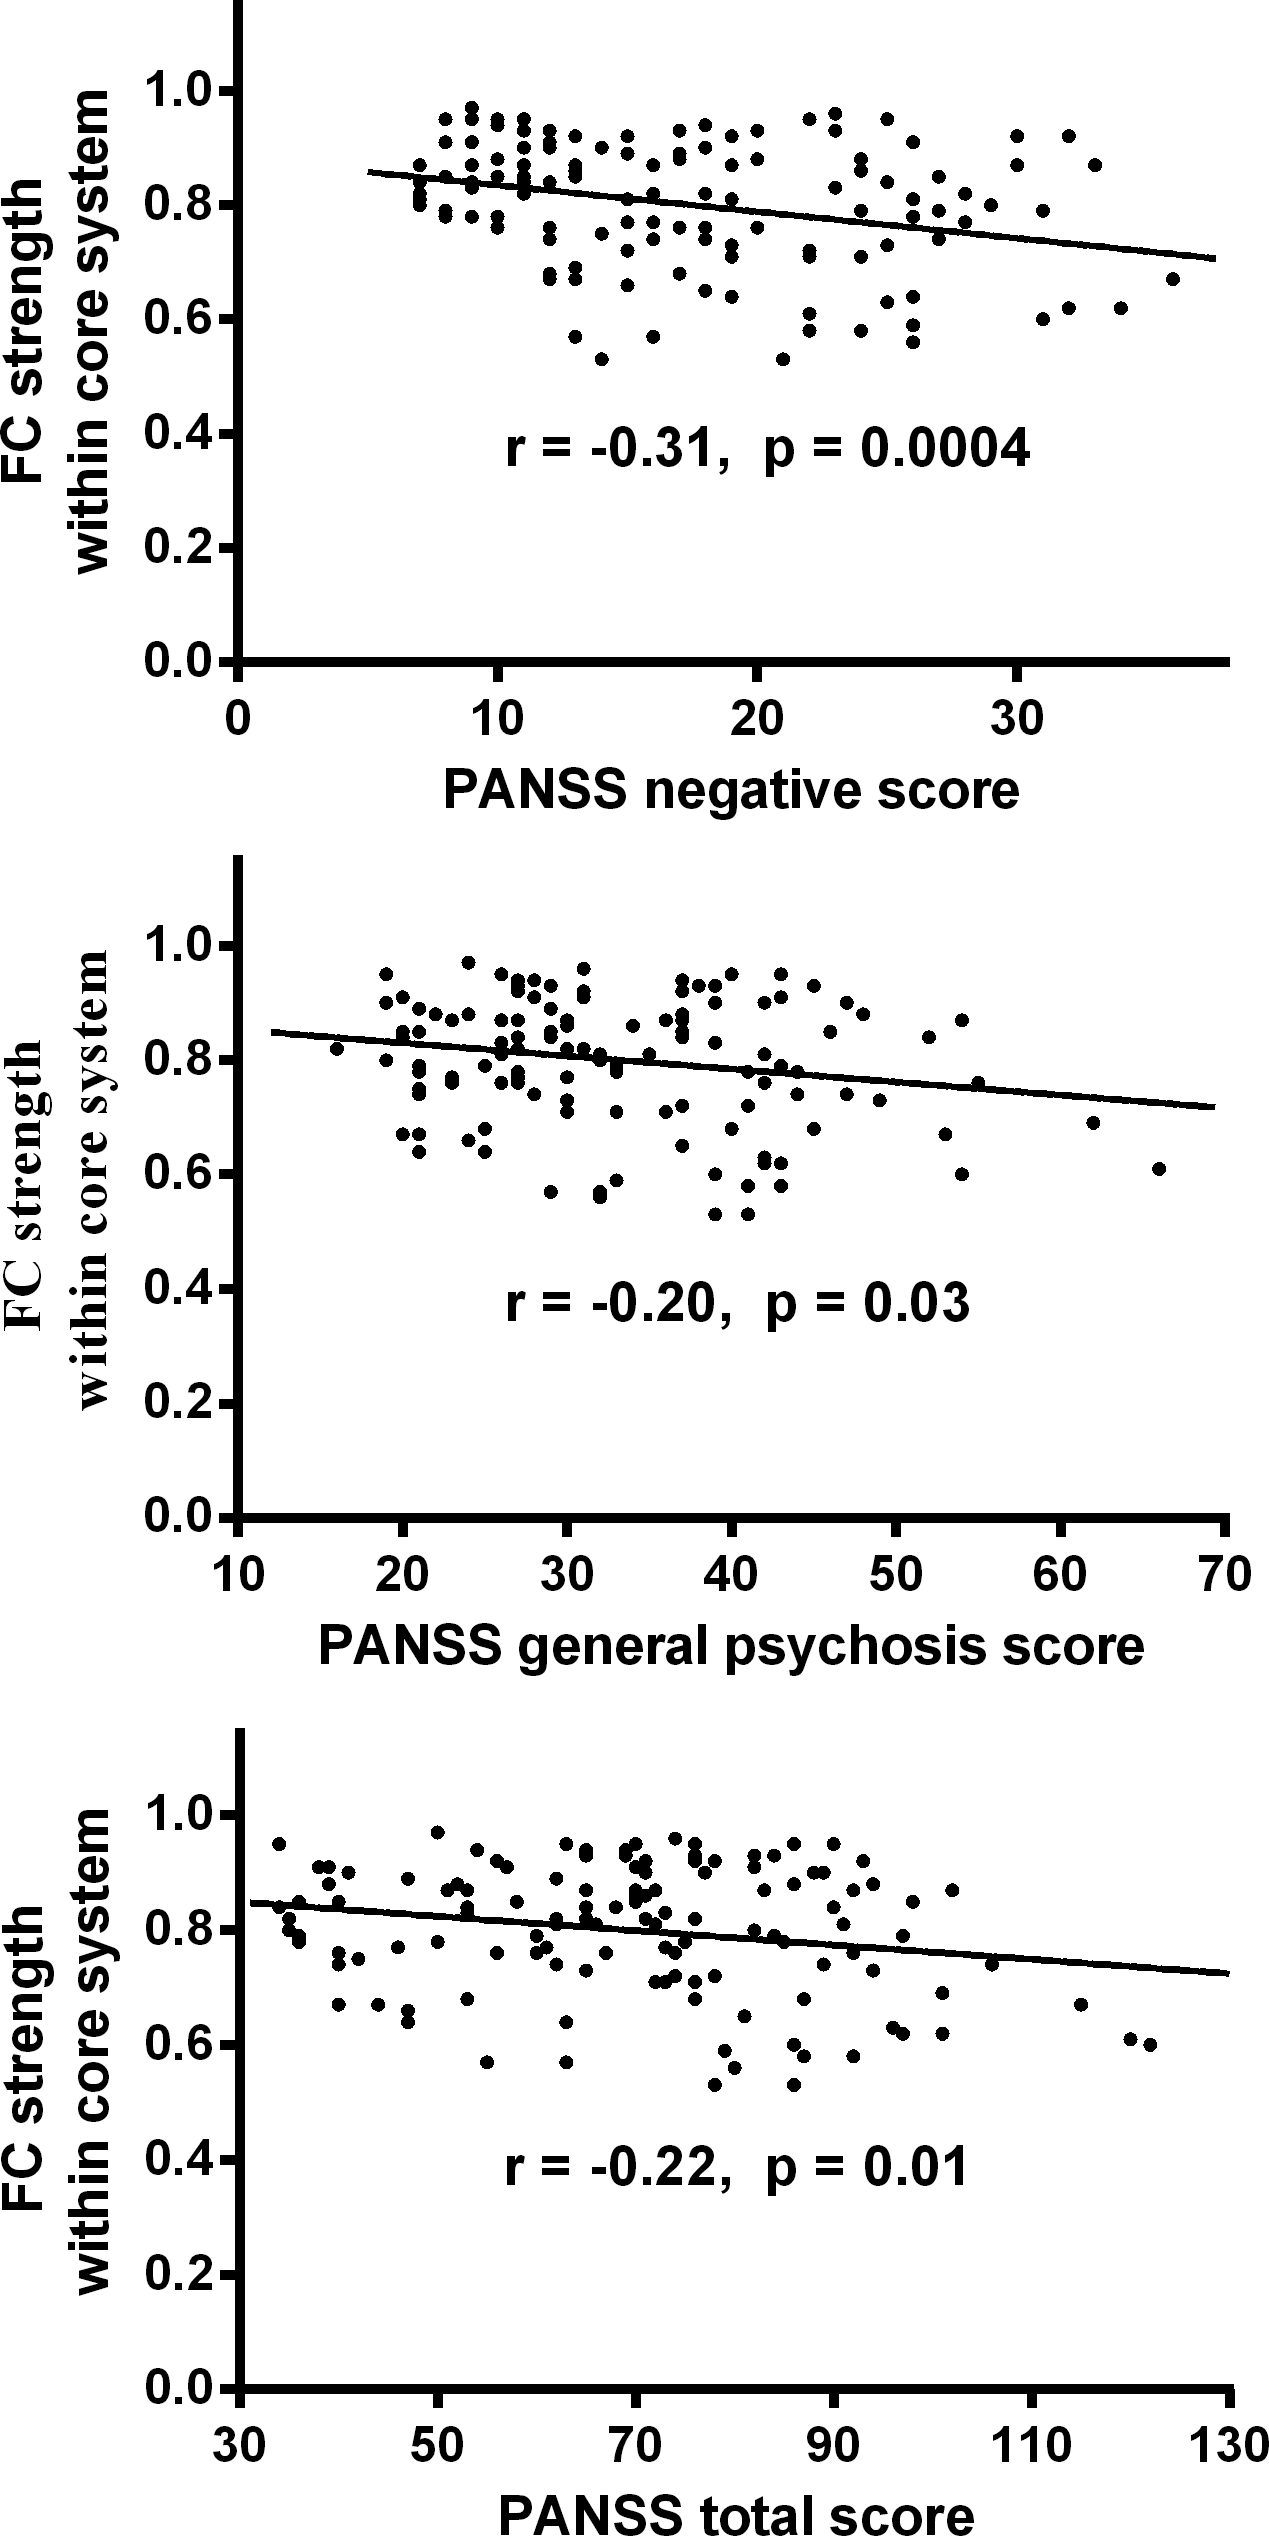
We found no significant correlations between the functional connectivities of the DMN subsystems and age, illness duration, or medication dose (all p values > 0.05). There were no significant differences in DMN connectivity between males and females in the patient or the control groups, or between patients with or without a family history of psychosis. The connectivity strength within the core subsystem was negatively correlated with PANSS negative symptoms (r = −0.31, p = 0.0004), PANSS general psychosis (r = −0.20, p = 0.03) and PANSS total scores (r = −0.22, p = 0.01) (Fig. 4).
Relationship of connectivity strength with clinical symptoms in all patients with schizophrenia.

Results from the validation sample
In the validation dataset, the FES group showed reduced functional connectivity within the MTL subsystem (pIPL-PHC and pIPL-Rsp connectivity) and between the MTL and dMPFC subsystems (dMPFC-pIPL, dMPFC-Rsp, and dMPFC-PHC connectivity) (online Supplementary Figure S2A). The RES group showed significantly reduced functional connectivity compared to controls between pIPL-Rsp, pIPL-aMPFC, and TPJ-HF (online Supplementary Figure S2B). There was no significant difference between FES and RES.
As with the primary sample, MTL connectivity with the core system (MTL-core) was reduced in the two groups of patients with schizophrenia (FES and RES groups, online Supplementary Figure S3) in the validation sample. No differences were found between the FES and RES patient groups. There was no significant difference in connectivity strength within the MTL subsystem or in connectivity between the MTL and dMPFC subsystems (MTL-dMPFC) in the validation sample.
The age of illness onset was negatively correlated with the connectivity strength of the dMPFC subsystem (r = −0.19, p = 0.02, online Supplementary Figure S4). Moreover, the illness duration was positively correlated with the connectivity strength within the MTL subsystem (r = 0.22, p = 0.007, online Supplementary Figure S4), with dMPFC-MTL connectivity (r = 0.21, p = 0.008, online Supplementary Figure S4), and with core-MTL connectivity (r = 0.17, p = 0.04, online Supplementary Figure S4). We found no significant correlations between functional connectivities of the DMN subsystems and PANSS scales in the validation sample (all p values > 0.05).
Discussion
In this study, we used resting-state fMRI to examine DMN abnormalities in schizophrenia. We found that reduced functional connectivity in the MTL subsystem of the DMN manifests similarly in patients with FES or RES. Thus, these findings suggest that dysfunctional MTL connectivity does not vary significantly across different stages of the illness. However, these results are limited by the cross-sectional design of the study, employing between-group analyses. As validated in a second, independent sample, abnormal functional connectivity between the core and the MTL subsystems of the DMN seems to persist from illness onset to the chronic stage, representing a stable neural feature of schizophrenia. Moreover, lower connectivity strength within the core subsystem was associated with more severe clinical symptoms in schizophrenia.
Reduced functional connectivity of the DMN in schizophrenia
Consistent results across the primary and validation samples showed reduced MTL-core connectivity in both patient groups (i.e. FES and RES), indicating that MTL-core connectivity represents a trait-like deficit. Deficits within the core and the MTL subsystems of the DMN were demonstrated in previous studies (Bluhm et al., Reference Bluhm, Miller, Lanius, Osuch, Boksman, Neufeld and Williamson2007; Fan et al., Reference Fan, Tan, Wang, Yang, Fan, Xiang and Zuo2019; Garrity et al., Reference Garrity, Pearlson, McKiernan, Lloyd, Kiehl and Calhoun2007; Whitfield-Gabrieli et al., Reference Whitfield-Gabrieli, Thermenos, Milanovic, Tsuang, Faraone, McCarley and Seidman2009; Yang et al., Reference Yang, Zhang, Li, Wang, Wang, Wang and Chan2019), and our results are consistent with these findings. Examining the anatomical and functional connectivity within the DMN in healthy volunteers, Greicius and colleagues identified some structural fiber pathways of the DMN, including PCC projections to the MPFC and bilateral MTL (Greicius, Supekar, Menon, & Dougherty, Reference Greicius, Supekar, Menon and Dougherty2009). Interestingly, the fiber tracts in the DMN, such as those connecting the PCC with the bilateral MTL (Kobayashi & Amaral, Reference Kobayashi and Amaral2003) and the PCC with the MPFC (Parvizi, Van Hoesen, Buckwalter, & Damasio, Reference Parvizi, Van Hoesen, Buckwalter and Damasio2006), are also detectable for homologous regions in macaque monkeys. In addition, the functional connectivity between the PCC and the medial temporal cortex is decreased in patients with mesial temporal-lobe epilepsy, suggesting that decreased MTL connectivity might be a consequence of MTL pathology (Liao et al., Reference Liao, Zhang, Pan, Mantini, Ding, Duan and Chen2011).
We observed decreased connectivity strength of the MTL subsystem in both schizophrenia patient groups (i.e. FES and RES) in the primary dataset. Consistent with our previous study of DMN subsystems in FES (Fan et al., Reference Fan, Tan, Wang, Yang, Fan, Xiang and Zuo2019) and Yang's study of chronic schizophrenia (Yang et al., Reference Yang, Zhang, Li, Wang, Wang, Wang and Chan2019), the current study showed comparable reduced connectivity strength of the MTL in first-episode and chronic schizophrenia. The MTL subsystem in the DMN has been implicated in autobiographical memory and future thought, enabling individuals to retrieve prior information to integrate into a mental scene (Andrews-Hanna et al., Reference Andrews-Hanna, Reidler, Sepulcre, Poulin and Buckner2010; Andrews-Hanna et al., Reference Andrews-Hanna, Saxe and Yarkoni2014). Patients with schizophrenia showed impaired autobiographical memory (Berna, Potheegadoo, Alle, Coutelle, & Danion, Reference Berna, Potheegadoo, Alle, Coutelle and Danion2017; Ricarte, Ros, Latorre, & Watkins, Reference Ricarte, Ros, Latorre and Watkins2017), personal episodic memories (Alexiadou et al., Reference Alexiadou, Bozikas, Kosmidis, Parlapani, Kiosseoglou and Fokas2018), and self-relevant thoughts and emotion in prospection (Painter & Kring, Reference Painter and Kring2016; Raffard, Esposito, Boulenger, & Van der Linden, Reference Raffard, Esposito, Boulenger and Van der Linden2013; Yang et al., Reference Yang, Zhang, Li, Wang, Wang, Wang and Chan2019). Previous studies also suggested that patients with schizophrenia have difficulties projecting into their future (Painter & Kring, Reference Painter and Kring2016; Raffard et al., Reference Raffard, Esposito, Boulenger and Van der Linden2013). Moreover, the vMPFC node in the MTL subsystem plays a significant role in emotion management (Fan et al., Reference Fan, Tan, Yang, Tan, Zhao, Chen and Zuo2013) and integration of elements of future episodes during prospection (Benoit, Szpunar, & Schacter, Reference Benoit, Szpunar and Schacter2014). With seed-based RSFC analysis, an earlier study reported altered functional connectivity of the key nodes of the MTL subsystem, with hypo-connectivity of the vMPFC correlated with impairment in prospection in patients with schizophrenia (Yang et al., Reference Yang, Zhang, Li, Wang, Wang, Wang and Chan2019). Along with our study, these findings suggest that abnormalities of the MTL subsystem of the DMN may underlie the deficits in autobiographical, self-related memory or future self-thought in schizophrenia.
Furthermore, consistent with the hypothesis of decreased cortical dopamine release in schizophrenia, previous studies have reported decreased dopaminergic innervation in the dorsomedial prefrontal cortex, medial temporal cortex, and hippocampus (Akil et al., Reference Akil, Pierri, Whitehead, Edgar, Mohila, Sampson and Lewis1999; Benes & Todtenkopf, Reference Benes and Todtenkopf1999). Dopaminergic deficits in these regions, including within the core subsystem and the MTL subsystem of the DMN, were demonstrated in subjects with schizophrenia and at high risk for psychosis in previous studies (Allen et al., Reference Allen, Moore, Corcoran, Gilleen, Kozhuharova, Reichenberg and Malaspina2019; Bluhm et al., Reference Bluhm, Miller, Lanius, Osuch, Boksman, Neufeld and Williamson2007; Fan et al., Reference Fan, Tan, Wang, Yang, Fan, Xiang and Zuo2019; Garrity et al., Reference Garrity, Pearlson, McKiernan, Lloyd, Kiehl and Calhoun2007; Whitfield-Gabrieli et al., Reference Whitfield-Gabrieli, Thermenos, Milanovic, Tsuang, Faraone, McCarley and Seidman2009; Yang et al., Reference Yang, Zhang, Li, Wang, Wang, Wang and Chan2019). The connectivity in the same regions was found abnormal in different stages of schizophrenia (i.e. FES and RES) in our study. Therefore, we speculate that abnormal connectivity within the MTL subsystem and between core−MTL subsystems might be related to the decreased dopamine release in different stages of schizophrenia. This alteration could therefore be considered as a potential neuroimaging biomarker for early diagnosis of schizophrenia.
We noted that the connectivity strength within the MTL and between MTL-dMPFC was reduced in the primary sample, but not in the validation sample. This difference might be related to the demographics or disease state in the samples. In fact, mean age and medication differed between the primary and validation datasets, possibly inducing different results. The RES group in the primary sample was older and used higher dosages of medication compared to the same group in the secondary sample. Moreover, the FES group, in contrast to RES, showed a trending reduction (p < 0.1) in connectivity strength within the MTL subsystem and between the MTL and dMPFC subsystems (online Supplementary Figure S3). Therefore, this deficit may pertain mainly to the early stage of the disease.
We observed no significant differences in the connectivity strength of the core or dMPFC subsystems and core-dMPFC between the two patient groups in either the primary or the validation sample. In healthy subjects, the dMPFC subsystem is preferentially active when participants consider their present mental states (Andrews-Hanna et al., Reference Andrews-Hanna, Reidler, Sepulcre, Poulin and Buckner2010). The two hubs, the aMPFC and PCC, are active during evaluation of self-relevant, affective decisions (Andrews-Hanna et al., Reference Andrews-Hanna, Reidler, Sepulcre, Poulin and Buckner2010). Abnormalities in functional connectivity, activity, metabolism, and gray matter volume in the PCC were identified in schizophrenia in previous studies (Bluhm et al., Reference Bluhm, Miller, Lanius, Osuch, Boksman, Neufeld and Williamson2007; Calabrese et al., Reference Calabrese, Wang, Harms, Ratnanather, Barch, Cloninger and Csernansky2008; Garrity et al., Reference Garrity, Pearlson, McKiernan, Lloyd, Kiehl and Calhoun2007; Shimizu et al., Reference Shimizu, Hashimoto, Ochi, Fukami, Fujisaki, Koike and Iyo2007; Whitfield-Gabrieli et al., Reference Whitfield-Gabrieli, Thermenos, Milanovic, Tsuang, Faraone, McCarley and Seidman2009). Moreover, previous reports showed aberrant increased MPFC-PCC connectivity during rest and working memory tasks in 13 patients with schizophrenia (Whitfield-Gabrieli et al., Reference Whitfield-Gabrieli, Thermenos, Milanovic, Tsuang, Faraone, McCarley and Seidman2009), and reduced MPFC-PCC functional connectivity during rest in 17 patients with schizophrenia (Bluhm et al., Reference Bluhm, Miller, Lanius, Osuch, Boksman, Neufeld and Williamson2007). However, with a larger sample, the present study showed no significant differences in MPFC-PCC connectivity between patients and controls during resting state. This discrepancy may reflect differences in sample size or methods of imaging data acquisition and analysis.
Clinical correlations with the connectivity of the DMN subsystems
DMN connectivity was not related to age, sex, medication, or family history of psychotic illnesses. However, the dMPFC-MTL and core-MTL connectivity strength were positively correlated with the duration of illness in the validation but not the primary sample. This discrepancy may likewise reflect the clinical heterogeneity of patients from the two datasets, including differences in illness duration. The primary sample of schizophrenia patients included a larger proportion of RES subjects compared to the validation sample; the mean age of the RES group was also higher in the primary sample. Consequently, the mean illness duration for patients with RES was 23 years in the primary dataset and 6 years in the validation dataset. We speculate that the association between the duration of the disease and the MTL connectivity may manifest mostly in the relatively early stages, in contrast to the long-term disease.
Future considerations
The current study has several limitations that need to be considered and addressed in future work. Firstly, the behavioral performance in autobiographical memory should be examined to understand the functional implications of the current findings and to specifically explore the role of MTL connectivity in memory impairments in schizophrenia. Secondly, the current study was designed as cross-sectional, and longitudinal studies are required to investigate if the connectivity features are stable across different stages of the illness. Accordingly, our team is currently implementing a longitudinal 5-year follow-up study to that end. Thirdly, mean age and medications differed between the primary and validation samples, potentially influencing the results in the two cohorts. Even though we considered age and medication as covariates in the statistical analysis, a residual effect of age and medication may still exist. This issue requires a better-designed dataset in the future. Further, although we did not observe a significant correlation between medication dose and DMN connectivity metrics, longitudinal studies of drug-naïve patients are needed to thoroughly evaluate the effects of medications on the functional connectivity of the DMN.
Conclusion
The current results confirm the presence of deficits in the medial temporal-lobe subsystem of default network in different stages of schizophrenia. These findings suggest the importance of medial temporal cortical dysfunction as a potential neuroimaging feature useful for early diagnosis of schizophrenia.
Supplementary material
The supplementary material for this article can be found at https://doi.org/10.1017/S003329172000416X
Data access and responsibility
The principal investigator, Yunlong Tan, has access to all of the data collected in the study and takes responsibility for the integrity of the data and the accuracy of data analysis. In this study, the authors used resting-state functional MRI data of schizophrenia patients and healthy controls from two sites (Beijing and Zhumadian Cohort). The authors have provided the data analyzed in the current study through GitHub (https://github.com/fanfengmei/HLG-ZMD-Schizophrenia-DMN).
Acknowledgements
The study was supported by the National Natural Science Foundation of China (Nos. 81761128021, 81401115, 31671145), the Beijing Municipal Administration of Hospitals’ Youth Program (QML20172001), and the Beijing Municipal Administration of Hospitals Clinical Medicine Development Special Fund (XMLX201513, XMLX201609). Funders played no role in the data analysis or interpretation, or in the decision to publish the findings.
Conflict of interest
All the authors have no conflicts of interest to declare.