


Introduction
One of the most widespread claims of Bolivian historiography states that, at least during the last quarter of the nineteenth century, Bolivian governments continuously applied ‘free-trade policies and generated a wide opening of the national market to foreign products without any tariff or customs restriction’.Footnote 1 Moreover, according to this traditional view, the general liberalisation of trade and the consolidation of liberal policies had negative consequences on particular products which had a central role in the economic evolution of certain regions. Thus, the negative impact of trade policy on products such as wheat from Cochabamba or Potosí, or sugar and rice from Santa Cruz, might have caused those regions’ economic stagnation.Footnote 2
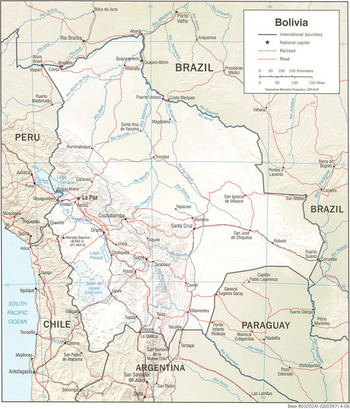
The literature has also suggested that the persistence of free-trade policies (among other elements) fuelled the economic disintegration between the markets of the east and the west of the country from the late nineteenth century to the early 1950s (see Map 1). For instance, according to Sandoval et al., ‘the factors which determined the closure of Bolivian Andean markets to products from Santa Cruz were: a) the construction of railway lines between the Bolivian Andean regions and the Pacific Ocean, b) free-trade policies and, c) the limits of the internal market’.Footnote 3
Despite its widespread acceptance, this view presents some problems. For instance, some of the usual assumptions about the links between liberal policies and economic stagnation do not stand up to scrutiny.Footnote 4 Likewise, to the best of my knowledge, no quantitative evidence has been presented to support the idea of tariff liberalisation. This lack of quantitative evidence is not irrelevant, since Coatsworth and Williamson have shown that the average tariffs of several Latin American countries were among the highest in the world from the 1820s to the late 1920s.Footnote 5 Furthermore, guided by the assumption that the average tariff ratio is the most representative protection indicator for those years, these authors have suggested that Latin America was the most protectionist region in the world during this period.Footnote 6
This article aims to fill the gap of quantitative evidence on the evolution of Bolivian tariffs. Thanks to a detailed reconstruction of Bolivian public revenues and a careful analysis of Bolivian foreign trade statistics, this article offers for the first time an estimate of the Bolivian average tariff ratio from 1895 to 1935. Contrary to the traditional view, the new evidence suggests that the level of Bolivian tariffs was not low by international standards.
However, this article also stresses that the high level of tariffs did not necessarily allow the protection of different products that represented the main economic activity of certain Bolivian regions. This idea is based on previous contributions which have revised Coatsworth and Williamson's original hypothesis. First of all, it starts from Rubio's idea that the protectionist implications of Latin American high tariffs must not be taken for granted during the belle époque (1890–1912).Footnote 7 Second, it takes into account the fact that nominal tariffs are not always a fair protection indicator,Footnote 8 particularly in those contexts where transport costs and the external exchange rate are relevant.Footnote 9 In this regard, during the first globalisation, transport costs could be more important than tariffs in the determination of trade volumes.Footnote 10 Finally, it also considers Nenci and Pietrobelli's finding that there was not any statistically significant relationship between tariff changes and import growth in Latin America from 1900 to the early 1960s.Footnote 11
Taking into account these ideas, this article suggests that the initial fragility of the Bolivian state-building process and the defeat in the War of the Pacific (1879) determined the signing of different treaties with neighbouring countries which had two negative consequences: first, the prevalence of a dual system of tariffs which undermined the autonomy and effectiveness of Bolivian tariff policy, and second, the increase in the competitiveness of several imports which competed directly with local producers. Whereas these trade agreements were modified around 1905, the article shows that, even with these changes, Bolivian tariff policy was not always able to overcome the effects of both the country's geographical diversity and the uneven pattern of railway construction, on domestic transport costs. Therefore, although Bolivian tariff policy was never as passive as traditionally assumed, its protectionist effect was sometimes constrained by institutional and geographical restrictions, and was unbalanced from a regional perspective.
Bolivian Foreign Trade Statistics
Bolivian foreign trade statistics for the nineteenth century are extremely scarce, being limited to some fragmented data in the yearly reports from the Ministry of Finance.Footnote 12 The availability of data increases after 1895, the year when the publication of official trade statistics started.Footnote 13 However, this data was still restricted to aggregate figures, and it was only in 1912 that the national customs office published a complete statistical compilation of import and export data.Footnote 14
Owing to these restrictions, my estimate of the Bolivian average tariff ratio starts in 1895. The estimate has been elaborated as the quotient between total import duties collected by the Bolivian central government and the value of imports displayed in Bolivian official trade statistics.Footnote 15 This methodology is the most common in this kind of work and the estimates presented here match those figures which were occasionally provided by the yearly reports from the Ministry of Finance or by the reports from the national customs office.Footnote 16
My estimate relies exclusively on import duties collected by the central government due to the lack of additional information. This may generate some downward bias in the average tariff ratio estimates because, during most of the period under study, Bolivian imports had to pay both national and municipal taxes.Footnote 17 The relevance of the latter can be inferred from a report of the national customs office which deplored the ability of the most important municipalities of the country to establish independent customs offices and tariffs, which ended up modifying the national tariff policy.Footnote 18 Thus, the misreporting of municipal tariffs could affect my estimate particularly from 1895 to the early 1910s, a period when the relative importance of municipal taxes in Bolivian public finances was substantial.Footnote 19
Likewise, the use of Bolivian official trade statistics may generate some bias since Bolivian imports were registered using official values until 1918.Footnote 20 The use of official values and their differences with the market value of Bolivian imports was a matter of concern for Bolivian authorities during this period. In 1903, for instance, the government observed that ‘the real and effective amount of Bolivian imports is twice as high as the figures displayed by official values’.Footnote 21 Whereas the importance of this problem was substantially reduced by the update of official values enacted by the Código de Avalúos de 1905 (Valuation Code of 1905), it reappeared between 1914 and 1918, when the national customs office stressed again the substantial underestimation of import flows derived from the use of official values. Thus, on the basis of the information provided by the Bolivian customs office, the League of Nations pointed out that the market value of Bolivian imports was higher than their official value by 50 per cent in 1917, 100 per cent in 1918 and 79 per cent in 1919.Footnote 22 Therefore, my estimates of the average tariff ratio is seriously biased upwards during the early 1900s or the late 1910s.
The implication of the last bias, however, is partially mitigated by the downward bias resulting from the exclusion of municipal tariffs from the estimates. In addition, whereas both sources of potential biases must be kept in mind when examining my estimates of the Bolivian average tariff ratio, they do not alter the main conclusions of the article.
On the other hand, the Bolivian average tariff ratio is affected by the fact that most Bolivian tariffs set by the central government were specific, rather than ad valorem.Footnote 23 As a consequence, abrupt changes in prices change ‘import values in the denominator, but not the legislated duty in the numerator, thus producing big equivalent ad valorem or percentage rate changes’ in the average tariff ratio.Footnote 24 Anyway, this effect is only captured by my estimates from 1919 onwards, since this was the first year when Bolivian imports were valued at market prices.
Finally, when tariffs mainly consist of specific duties, their protection effects could be mitigated or enhanced by external exchange rate movements.Footnote 25 The analysis of this variable is important in the Bolivian case for two reasons. On the one hand, according to Bolivian historiography, the Bolivian currency debasement from 1829 to 1870 allowed traditional colonial markets to be protected against overseas competition. Following this literature, money debasement would have been a more efficient protectionist tool than tariffs.Footnote 26 On the other hand, because of the drop in international silver prices, the Bolivian currency depreciated vis-à-vis the pound sterling during the last quarter of the nineteenth century, which may have affected, through unknown biases, the protectionist effects of tariff policy. This depreciation stopped during the first third of the twentieth century.Footnote 27 Therefore, whereas measuring protection exclusively on the basis of the average tariff ratio may be problematic during the nineteenth century, the ratio could be interpreted as a fair indicator of the evolution of overall protectionism in Bolivia during the first third of the twentieth century.
The Bolivian Average Tariff Ratio
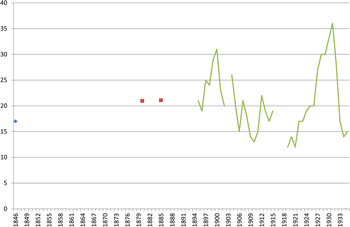
Figure 1 presents a yearly series of the Bolivian average tariff ratio since 1895, together with a few point estimates for previous years. The estimate for 1846 was obtained using import taxes from Huber and the value of total imports presented by Dalence.Footnote 28 , Footnote 29 The average tariff rate for 1880 was calculated on the basis of the information provided by the 1882 yearly report of the Ministry of Finance, and refers exclusively to those imports coming from Europe, the United States and Peru that were introduced in the country through the Aduanas del Norte (Northern customs).Footnote 30 The average tariff for 1885 refers instead to the Rendimiento Aduanero General (general tariff returns).Footnote 31
The Bolivian Average Tariff Ratio, 1846–1935(%)

The graph shows that the average tariff rates of 1846 (16.56 per cent), 1880 (20.97 per cent) and 1885 (21.09 per cent) were not very different from those reached in the following decades (23.71 per cent in 1895–99; 20.95 per cent during the 1900s; 17.47 per cent during the 1910s; and 21.46 per cent during the 1920s). Thus, whereas the restricted quantitative evidence discards any possible generalisation of Bolivian tariff policy before 1895, the three-point estimates may help to recall that Bolivian tariff policy during the second half of the nineteenth century was not as liberal as generally assumed. In effect, during the early 1860s the government enacted a new tariff policy which reduced tariff rates; during the early 1870s liberalisation continued through the elimination of the silver monopsony, which was replaced by the establishment of a tax on exports.Footnote 32 , Footnote 33 However, a backlash in this policy took place in the case of imports in 1878, when the government introduced both specific and ad valorem taxes which, at least in the case of cotton and other textiles, were higher than those established by the former legislation.Footnote 34 This turning point would explain the relatively high values of the Bolivian average tariff ratio in 1880 and 1885.
According to the graph, and despite the existence of some fluctuations, the Bolivian tariff ratio seems to have been kept relatively high by the successive tariff changes that took place from 1895 to 1913.Footnote 35 This persistence would mainly be the result of the relative importance of import taxes which, on average, accounted for more than half of the Bolivian central government's total revenues.
After the decrease in the rate during the First World War, the Bolivian average tariff tended to increase. The rise resulted from the updating of Bolivian tariff rates in 1920, 1922, 1923 and 1927, which accompanied the new valuation of Bolivian imports at market prices.Footnote 36 This post-war increase can be explained by different factors. First, it might have been caused by the Bolivian government's reaction to the generalised increase in protectionism across the world.Footnote 37 It might also have been a response to the growing pressure from the local elites of the centre and east of the country, who asked for protectionist measures.Footnote 38
However, this tariff increase was also clearly linked with the substantial growth in Bolivian external debt that took place in the 1920s.Footnote 39 Indeed, the arrival of the Stifel-Nicolaus loan of US$ 29 million in 1922 involved as compensation a fiscal reform which, among other measures, increased import taxes that were explicitly ‘pledged to the service of refunding the loan’.Footnote 40 Later on, the Bolivian central government acquired two new loans from Dillon, Read and Company for US$ 14 million (1927) and US$ 27 million (1928). Both credits increased external debt payments up to one-third of total public expenditures. Since the Bolivian government agreed not to alter export taxes, this new fiscal pressure had to be addressed through the only reliable short-term alternative, namely import taxes.Footnote 41
During the Great Depression, the Bolivian average tariff ratio became highly unstable. Since tariffs did not suffer major legal modifications until the late 1930s, the change in the ratio could be explained by changes in import prices, both deflation and inflation, changes in the composition of imports and the economic instability derived from the Chaco War (1932–35).Footnote 42 Meanwhile, the use of multiple exchange rates gained increasing relevance, which would significantly reduce the centrality of tariffs in the configuration of Bolivian trade policy from the late 1930s onwards.Footnote 43
From a comparative point of view, my estimates are similar to the equivalent figures of some of the most developed economies of Latin America and the United States (which is usually described as a closed economy); likewise, my estimates are higher than the ratios of Asian countries, Western Europe and Scandinavia.Footnote 44 Thus, in contrast with the traditional claims of Bolivian historiography, the new evidence suggests that Bolivian tariffs were not low by international standards.Footnote 45 This does not necessarily indicate that the Bolivian government was applying a deliberate protectionist policy, given that the evolution of tariffs was strongly correlated with the Bolivian government's fiscal needs. But, intentionally or not, Bolivian producers might have benefited from a high level of protection.
Protection During the Late Nineteenth Century
Before analysing the potential impact of tariffs and trade policy during the late nineteenth century, it is critical to take into account some of the structural determinants which conditioned the evolution of the Bolivian economy since independence. The country became independent in 1825 and the first task of the new state was to secure its national borders against neighbouring countries, an objective which became very difficult. For instance, the borders with Chile, Brazil and Paraguay were not consolidated until the Bolivian defeats in the War of the Pacific (1879), the Acre War (1903) and the Chaco War (1932–35), respectively. Second, it was necessary to reach some internal stability in order to restrict the use of violence and allow the functioning of the state.Footnote 46 However, if the number of constitutions and their modifications are accepted as a valid measure of stability, Bolivia was one of the most unstable countries in the region.Footnote 47 In addition, the economy largely stagnated during the first decades after independence and economic resurgence had to wait until the late 1850s, when some external shocks and the arrival of new investments to Potosí allowed increasing silver exports.Footnote 48
These restrictions are critical to understanding the relative stagnation of the Bolivian central government's revenues from independence to the mid-nineteenth century.Footnote 49 This stagnation was largely the result of the government's extreme dependence on the indigenous head tax (contribución indígena), which in turn, may be explained by the low commercial development and difficulties in consolidating foreign trade taxes as a secure and reliable source of revenues.Footnote 50 Fiscal scarcity was such that the government had no option but to use monetary policy as a fiscal instrument in which currency debasement (1829) worked as a shadow tax on mining.Footnote 51 Furthermore, whereas these fiscal shortages eased during the late 1860s thanks to the recovery of silver exports and the consolidation of foreign trade taxes as the most important revenue source, the fragility of Bolivian public finances was still substantial throughout this period.Footnote 52
Furthermore, whereas Bolivia had sovereign access to the Pacific Ocean from independence until 1879, it always had difficulties to exploit fully this advantage. For instance, in spite of having its own ports, a significant share of Bolivian trade was moved through the Peruvian port of Arica.Footnote 53 Moreover, at least until the 1850s, population density in the coastal Department of the Litoral was lower than one inhabitant per square kilometre.Footnote 54 Likewise, during the 1860s and 1870s the Bolivian central government had considerable difficulties in consolidating its sovereignty over this territory. The treaty of 1866 with Chile (see below) and the frequent cases in which foreign capitalists operating in the area did not recognise Bolivia's jurisdiction stand out as the clearest examples of this situation.Footnote 55
The Bolivian government's fiscal vulnerability and its difficulties in imposing its sovereignty on the coast must be kept in mind in order to understand why Bolivia signed different treaties with neighbouring countries. The first was signed with Peru in 1865. Besides the elimination of trade taxes between both countries, it stated that all foreign products which were destined for Bolivia had to pay taxes in Arica according to Peruvian legislation on tariffs. Moreover, in order to prevent arbitrage, the treaty also established that tariffs at the Bolivian port of Cobija could not be lower than the Peruvian ones. In return, Peruvian authorities committed to give an annual subsidy of Bolivian$ 450,000 to Bolivia, an amount which represented between 15 and 20 per cent of the Bolivian government's revenues.Footnote 56 , Footnote 57
The second treaty was signed with Chile in 1866 to solve a border controversy.Footnote 58 The treaty officially recognised a new border line at parallel 24° but also stated that all the benefits from guano exploitation, as well as export taxes from mining production located along the coast and between parallels 23° and 25°, had to be shared between the Bolivian and Chilean governments. Moreover, Bolivian authorities accepted that mining production located between parallels 24° and 25°, as well as all imports from Chile, had to be free of taxes at the port of Mejillones.Footnote 59 These concessions undermined Bolivia's sovereignty but prevented a violent clash with Chile.
This process continued thereafter through the signing of new treaties with both Peru (1870) and Chile (1874).Footnote 60 During the late 1870s, however, the Bolivian government changed its commercial relationship with Peru and signed a new treaty (1878). Whereas the new agreement maintained the previous virtual free trade between both countries in most cases, it imposed a tax of 50 cents per gallon for all Peruvian exports of alcoholic beverages into Bolivia and accepted the Bolivian right to tax its imports. In return, Bolivia committed not to apply lower tariffs than the Peruvian ones, as well as to pay an ad valorem tax of 5 per cent for transit rights. This situation persisted once Bolivia lost its coastal department, thanks to the signing of a new treaty (1880) which eliminated the ad valorem tax of 5 per cent for transit rights while maintaining free trade for almost all products. In the case of Chile, no major modifications took place and Chilean exports maintained their free-trade prerogatives in Bolivia through the signing of the ceasefire of 1884 and its complementary protocol of 1885.Footnote 61
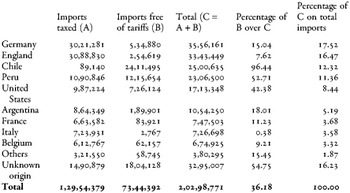
The new treaties with Peru as well as the enactment in 1878 of the first Bolivian tariff code represented a step forward towards tariff independence.Footnote 62 For instance, thanks to these changes import taxes were consolidated as the most important revenue source of the Bolivian central government and the average tariff ratio increased to 20 per cent. Meanwhile, however, the persistence of free-trade agreements with Peru and Chile determined that a significant share of Bolivian imports was still free of taxes. In 1905, for instance, tax-free imports coming from Peru and Chile accounted for 18 per cent of total Bolivian imports (Table 1).Footnote 63
Origins of Imports and Tax Pressure, 1905 ($Bs.)

Sources: Author's own work based on Ministerio de Hacienda e Industria, Memoria presentada a la legislatura de 1906 (La Paz: Ministerio de Hacienda e Industria) p. 52.
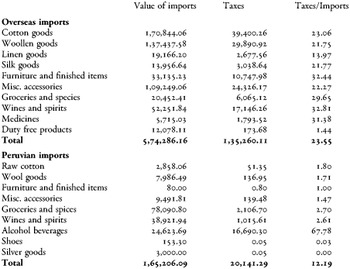
Hence, during the last quarter of the nineteenth century and the first years of the twentieth century, most Bolivian tariff revenues originated from the trade flows between Bolivia and non-neighbouring countries. Indeed, although it has not been possible to find information from all customs offices, Table 2 shows that most import taxes in 1880 came from overseas imports which, furthermore, were mainly constituted by manufactures. The table also suggests a dual system in which the same product or the same group of products, such as woollen goods, might face a different fiscal burden depending on its origin.
Overseas and Peruvian Imports by the Northern Customs and Import Taxes, 1880 ($Bs.)

Sources: Author's own work based on Ministerio de Hacienda, ‘Resumen general de los artículos ultramarinos y peruanos internados a Bolivia durante el año de 1880 – por las aduanas del norte’, in Memoria del Ministerio de Hacienda correspondiente a 1882 presentada al Honorable Congreso Nacional (La Paz: Ministerio de Hacienda), unnumbered page.
Thus, Bolivian official records recognised that, because of both the War of the Pacific and the absence of uniform trade agreements, there was not a unified Bolivian system of tariffs, but several systems in which tariff rates of neighbouring countries often prevailed.Footnote 64 Bolivian authorities complained, for instance, that because of the virtual free-trade agreement with Chile, sugar beet imports from Europe were introduced into Bolivia as Chilean products and did not pay taxes.Footnote 65 Likewise, since all Bolivian imports which were moved through Arica, Chilean territory after the War of the Pacific, had to pay the Chilean import taxes, the potential for trade arbitrage increased on those products for which the Chilean tariffs were lower than the Bolivian ones.Footnote 66
Therefore, if we define tariff autonomy as the freedom to set tariff levels independently from other states’ military and political power, the existence of these treaties with neighbouring countries clearly suggests that, in the case of Bolivia, political independence did not grant tariff autonomy.Footnote 67 , Footnote 68 Indeed, for Bolivia these treaties were the equivalent of a virtually free-trade agreement with Peru and Chile, which radically affected the potential protective effect of tariffs.Footnote 69 Thus, beyond the existence of a high average tariff ratio, Bolivia did not enjoy true autonomy on tariff policy, as the Bolivian authorities recognised:
It is not possible to establish a tariff which defines the government's policy due to our pacts with neighbouring countries […] the fact that tariffs in Arica are determined by the Chilean tariff destroys completely our tariff sovereignty, which, truly speaking, has been totally lost.Footnote 70
The prevalence of free-trade agreements with Peru and Chile also affected the prices of imports relative to local production, a relationship which was further modified by the railway connection between the western areas of the country and the Pacific Ocean.Footnote 71 Indeed, beyond its effects on exports, railways increased the competitiveness of imports and reduced the natural protection which Bolivian producers had enjoyed since independence.Footnote 72 Therefore, free-trade agreements and the expansion of railways may have ended up displacing the domestic production which had traditionally supplied the urban and mining markets in the western areas of the country.Footnote 73
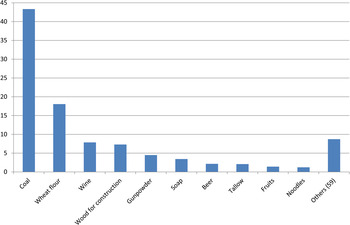
The availability of data on Chilean and Peruvian exports to Bolivia c.1900 allows the identification of the Bolivian sectors that could be threatened by these free-trade agreements. On the one hand, Figure 2 shows that more than two-thirds of Bolivian imports from Chile consisted of coal, wheat flour and wine. Whereas coal was unavailable in Bolivia, wheat flour and wine imports might have affected Bolivian producers. This is particularly plausible in the case of wheat flour. Indeed, Chilean historiography has traditionally identified three different periods of Chilean wheat production: from the late colonial period to 1850 when production came from traditional mills and exports were negligible; from 1850 to 1880 when production and exports soared thanks to the introduction of modern mills; and, from 1880 to the early twentieth century when production stagnated and exports decreased continuously.Footnote 74 However, new research has found that, despite this decrease, yields per hectare increased continuously and remained similar to those of the most important producer countries.Footnote 75 By contrast, a classic study focused on Cochabamba has stressed the absence of a systematic effort to improve wheat or agrarian production during this period.Footnote 76 Thus, the higher quality of Chilean wheat production as well as trade agreements may explain the increase of wheat flour imports from 713.1 metric tons in the early 1860s to 2,095.5 in 1902.Footnote 77 , Footnote 78 , Footnote 79
Composition of Chilean Exports to Bolivia, 1897 (% Over Total Value Traded)

Likewise, Table 3 shows that more than two-thirds of Bolivian imports from Peru were composed of five products. One of the most important was sugar, a product which achieved a significant importance in Peru during the late colonial period and started to be exported both to Chile and the United Kingdom after the independence crisis. Initially, these exports came from traditional trapiches. However, sugar production and exports soared in the 1870s thanks to technological innovations. Whereas the War of the Pacific stopped this process, it recovered in the 1890s, once again due to technological change.Footnote 80 By contrast, sugar production in Bolivia did not exhibit any significant technological change from independence to the first half of the twentieth century.Footnote 81
Peruvian Exports to Bolivia, 1900–05 (% Over Total Value Traded and Quantity Exported)

Sources: Author's own work based on Superintendencia General de Aduanas, Estadística general de aduanas del año 1900. Exportación. cabotaje; Estadística del comercio especial del Perú en el año 1902; Estadística del comercio especial del Perú en el año 1905 (Lima: Imprenta del Estado). Note: If not specified otherwise, quantities are expressed in kilograms.
Table 3 also shows that competition from Peruvian free-tax imports was not restricted to sugar or alcoholic beverages, but involved other traditional sectors of the Bolivian economy such as tocuyos (coarse cotton textile products used by the indigenous population) or rice.Footnote 82 Moreover, these imports were fairly stable over time. Hence, not surprisingly, some Bolivian authorities complained that free-trade agreements, together with the railway connection, had negatively affected the production of sugar in Santa Cruz, that of cotton and wine in Mizque (in the centre of the Department of Cochabamba) and that of rice in Zongo (close to La Paz).Footnote 83
Summing up, Bolivian trade policy might have affected some Bolivian regions because of railway construction and trade agreements with Chile and Peru, rather than because of a general liberalisation of tariffs.Footnote 84
Protection During the First Third of the Twentieth Century
Bolivia is a highly diverse country from a geographical point of view (see Map 1). Thus, whereas the sharp reduction in international ocean freight that took place from the 1850s to the First World War certainly affected the evolution of Bolivian trade, the reduction of internal transport costs could have been of greater importance.Footnote 85 For instance, the use of traditional transport facilities from the rubber producing areas (eastern lowlands of the country) to sea ports on the eve of the twentieth century represented 95 per cent of the cost to move one ton of rubber from Bolivia to New York, either by the Atlantic or the Pacific route. Similarly, traditional transport facilities absorbed 93 per cent of the cost of moving one ton of mineral from Tupiza to Hamburg through Buenos Aires.Footnote 86 Not surprisingly, the railways’ impact on transport costs was significant. For instance, by 1900, whereas the cost of moving one quintal of tin between Oruro and Antofagasta by mule was around 10 pence, it was just around 2 pence by railway.Footnote 87
Map of Bolivia

An alternative way to illustrate this is by analysing the price of moving rubber from Cachuela Esperanza, in the north-east of the country, to the port of Antofagasta (Table 4). The calculations show that the cost of moving 100 kilograms of rubber per kilometre on the eve of the twentieth century was several times cheaper on the Oruro-Antofagasta section of the route (where the railway was operating) than in the rest, where rubber was transported by river or using animal traction. Second, since the journey from Cachuela Esperanza to Oruro represented 84 per cent of the total transport cost, figures in the table also illustrate the substantial costs involved in the transit of products from the eastern lowlands to the high mountains of the west.Footnote 88 According to a contemporary observer, the significance of this cost restricted the development of several economic activities in the east, such as cattle grazing, and only ‘precious commodities’ or ‘indispensable luxuries’ such as rubber or chocolate were sufficiently valuable to make those costs affordable.Footnote 89 Geographical restrictions and the lack of modern transport facilities also constrained the transit of products from the west to the east of the country. For instance, salt was acquired in the west at less than 1 cent gold per pound but it cost 30 cents gold per pound in Trinidad.Footnote 90
Transport Costs for 100 Kilograms of Rubber, c. 1900

Sources: Author's own work based on Oficina Nacional de Inmigración, Estadística y Propaganda Geográfica, Sinopsis estadística y geográfica de la República de Bolivia. Tomo II (Taller Tipo Litográfico Gamarra: La Paz, 1903), pp. 281–2.
Notes: Transport costs were originally expressed in bolivianos. These were converted to US dollars using an exchange rate of Bs. 2.5 per US dollar. Distances from Cachuela Esperanza to Santa Cruz and from Santa Cruz to Cochabamba are linear distances. Distances from Cochabamba to Oruro and from Oruro to Antofagasta are railway distances, which were obtained from Jesús Sanz Fernández (ed.), Historia de los ferrocarriles de Iberoamérica (1837–1995) (Centro de Publicaciones. Ministerio de Fomento: Madrid, 1998).
During the early twentieth century, this imbalance in domestic transport costs persisted: in 1913 the railway line between La Paz and Arica was opened. In 1917, the largest western cities (La Paz, Oruro and Potosí) became fully integrated into the railway network due to the construction of several branch lines.Footnote 91 In 1925, thanks to the completion of the Atocha-Villazón line and its connection with the Argentine railway system, minerals from the south-west of the country could be sent by train to Buenos Aires.
Meanwhile, the local elites from the centre and east of the country lobbied against what they defined as a railway regionalism biased towards the interests of the west.Footnote 92 Their most important demand was railway expansion towards the east, which had uneven results: whereas the railway line between Oruro and Cochabamba was completed in 1917, the connection between Potosí and Sucre was not finished until the late 1930s, and the railway line between Cochabamba and Santa Cruz was never finished. Therefore, despite the increasing pressure from local elites, railway expansion mainly reduced the level of domestic transport costs in the western areas of the country.
By claiming the persistence of free-trade policies, Bolivian historiography implicitly assumes that the Bolivian government did not do anything to counteract the effect of improved transport. This assumption, however, fails to recognise some important modifications in Bolivian trade and tariff policies on the eve of the twentieth century. These changes are related to the end of the Federal War (1898–99) and the victory of the Liberals, whose control of the Bolivian government (1899–1920) determined the consolidation of new political and economic elites.Footnote 93
One key feature of these administrations was the systematic effort to strengthen the Bolivian central government. For instance, education, the police and the money supply were centralised during this period.Footnote 94 This centralisation process was in part a response to the threat to national unity from regional struggles that were widespread on the eve of the twentieth century, and the risk of the so-called polonización of the country – the carving up of Bolivia by neighbouring countries. But it was also due to an increasingly coherent economic strategy based on the notion that a stronger central government was necessary in order to reduce foreign trade transaction costs. Indeed, like their predecessors the Conservatives (1881–98), the Liberals identified foreign trade as the engine of economic development, and, as in the rest of Latin America, railway construction was seen as a critical step in order to fulfil those economic opportunities opened up by the world economy.Footnote 95 , Footnote 96 But, given that state subsidies were critical for railway construction and that trade taxes were the government's most important source of revenue, the expansion of railways was also restricted by foreign trade, thus generating a non-development trap.Footnote 97
The Liberals were more successful than the Conservatives at railway construction (see above) because of their ability to break down this non-development trap. One of the sources of this success was the systematic effort to solve border disputes with neighbouring countries – Paraguay being the exception. This effort included a pragmatic approach to the signing of peace treaties with Brazil (1903) and Chile (1904). Indeed, the Bolivian government accepted the territorial losses derived from the War of the Pacific and the Acre War, in exchange for monetary compensation that could be invested in railway construction. Furthermore, these treaties and the one signed with Peru in 1905 (see below), included the regulation of transit rights, an achievement which reduced Bolivian foreign trade transaction costs.Footnote 98 The treaties also enabled the achievement of tariff autonomy (see below) and, consequently, an increase in government revenues through customs revenues.Footnote 99 Overall, these changes help explain the higher economic growth rates during the Liberal era.Footnote 100
The pragmatic approach was not necessarily hegemonic among the Bolivian political class, but it was regarded as a necessary concession to foster foreign trade and, therefore, economic development.Footnote 101 Furthermore, whereas the 1904 treaty has been heavily criticised, it must be analysed in its own context. Indeed, once Chile signed the Ancón Treaty with Peru (1883), it gained more flexibility in bringing about a favourable agreement with Bolivia. This was achieved through the ceasefire of 1884, which imposed a heavy economic burden on Bolivia and negatively affected Bolivian foreign trade.Footnote 102 Moreover, despite an important opening during the negotiations of 1895, Chile dramatically changed its attitude to Bolivia after the solution of its border disputes with Argentina on the eve of the twentieth century. Given this new geopolitical context, the tactical use of railway construction and trade concessions by Chilean authorities, and the heavy burden imposed by the 1884 ceasefire, Bolivian authorities had little option but to accept the 1904 treaty.Footnote 103 , Footnote 104 The treaty determined the Chilean obligation to construct a railway line between Arica and La Paz, cash payments for railway construction in Bolivia, the free transit of Bolivian trade flows through the Chilean territory, and each country's ability to impose import taxes on those products coming from the other country.
One year later, Bolivia signed a new trade and customs agreement with Peru. This established the free transit of products throughout the Mollendo–La Paz route as well as the possibility of imposing taxes on bilateral trade flows. Rather than a Peruvian concession in exchange for territory (as in the Chilean case), this change reflected the constant competition to attract foreign trade flows among the ports at the South Pacific Ocean.Footnote 105 Indeed, by signing the new agreement, Peruvian concessions matched those enjoyed by Bolivian foreign trade in Chilean ports.Footnote 106
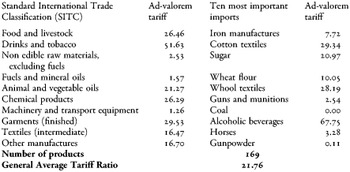
Therefore, the Liberals were successful in reducing foreign trade transaction costs and the achievement of tariff autonomy. Thus, the 1905 tariff code explicitly called for new tariff measures aimed at consolidating a new and more rational tariff structure. The estimate of the ad valorem tariff of different groups of imports suggests that this claim was not just a rhetorical claim. Table 5 uses the information provided by the first detailed report made by the national custom office in 1912 and organises it according to the Standard International Trade Classification (SITC) (left column). The exercise shows that whereas beverages and tobacco were highly taxed, machinery and transport equipment were not. Likewise, the fiscal pressure on food, animals and chemical products was several times higher than that on raw materials and fuels, and finished garments were taxed more heavily than intermediate textiles. A look at the ad valorem tax of the first ten imports (right column) confirms the low tax pressure on key input products such as coal or gunpowder, or on products that could not be domestically produced or were not available in the country, such as iron manufactures or horses. Likewise, the exercise suggests that the ad valorem tariff on sugar, finished textiles and alcoholic beverages was rather high. Therefore, looking at either general groups or at individual items, Table 5 suggests the existence of a cascading tariff structure in which capital goods (such as machinery and transport equipment) were taxed less than raw materials or intermediate goods which, in turn, were taxed less than finished goods.Footnote 107
Ad valorem Tariffs by Import Groups, 1912 (%)

Sources: Author's own work based on Dirección General de Aduanas, Comercio especial de Bolivia año 1912 (La Paz: Dirección General de Aduanas).
Notes: The first column is an adaptation of the Bolivian data to the Standard International Trade Classification (SITC, Rev. 3). The first six items of the column correspond to the first six sections (0–5) of the SITC classification; the seventh item corresponds to section 7; the eighth item corresponds to section 6 of the SITC classification, after excluding chapter 65; the ninth item, corresponds to chapter 65 of the SITC classifications; the last item corresponds to sections 8 and 9 of the SITC classification.
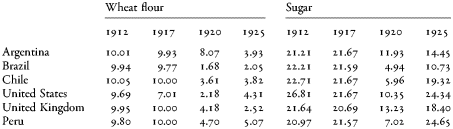
The different evolution of wheat flour and sugar tariffs confirms the existence of a new context. Indeed, whereas the ad valorem tariff on wheat flour imports decreased from around 10 per cent to around 4 per cent between the early 1910s and 1925, sugar remained stable at around 20 per cent, with the exception of 1920, due to the slow adaptation of the tariff to price changes (Table 6). Moreover, the absence of significant differences among the tariff rates applied to products coming from different countries also shows the elimination of the previous trade advantages enjoyed by the neighbouring economies. Hence, during the first third of the twentieth century, the evolution of tariffs on products that had previously been competing with domestic production was not as uniform and consistent as has usually been assumed.
Ad valorem Tariffs for Bolivian Wheat Flour and Sugar Imports by Country of Origin, 1912–25 (%)

Sources: Author's own work based on Dirección General de Aduanas, Comercio especial de Bolivia (La Paz: Dirección General de Aduanas, 1912–25).
Given this tariff policy heterogeneity, the protective impact of Bolivian trade policy might also be expected to be different among products. Nevertheless, the probability of success of protectionist measures was clearly lower as far as products of low productivity and/or high domestic transports costs were concerned, as well as different products which represented the main economic activity of some Bolivian regions.
This idea can be illustrated by analysing the retail price of sugar. Table 7 indicates that the retail price of sugar in the eastern departmental capitals (Santa Cruz, Trinidad and Cobija), was approximately twice as high as in the western departmental capitals (La Paz, Oruro and Potosí) during the 1940s and early 1950s, a period when sugar imports had been liberalised (Law of 21 November 1940).Footnote 108 The magnitude and persistence of these price differences reflect that, during this period, sugar from Santa Cruz was mainly sold in nearby markets, while imports constituted most of sugar consumption in the western areas of the country.Footnote 109 Likewise, the higher price of sugar in Santa Cruz than in the western markets, where sugar prices would be the sum of foreign production costs and transport charges, shows the low competitiveness of national production. Thus, according to this evidence, tariffs would have been able to protect the Santa Cruz sugar industry only if tariff rates had been high enough to double the price of imports as well as to compensate the transport cost between the East and West of the country.
Annual Average Retail Price (Bs$ per kg.) and Index Price (La Paz = 100) of Sugar in Bolivian Capital Cities, 1942–63)

Sources: Author's own work based on Dirección Nacional de Estadística y Censos. Anuario Estadísticas Financieras y Costo de Vida (La Paz: Dirección Nacional de Estadística y Censos, 1942–63).
Price differences between Santa Cruz and the western departmental capitals disappeared in 1963. This reflects the consolidation of the sugar industry in Santa Cruz after the 1952 Revolution.Footnote 110 However, this phenomenon was the result not only of increasing tariff protectionism, but of a wider strategy which allowed: first, reduced transport costs thanks to the construction of the main road between Cochabamba and Santa Cruz; second, the modernisation of the industry on the basis of soft credits from the state and international aid; third, taking advantage of the higher supply of labour generated by the agrarian reform of 1952.Footnote 111
Conclusions
In contrast with previous assumptions of Bolivian historiography, and in line with recent research on other Latin American countries, this article has argued that Bolivian tariff policy was somewhat active during the late nineteenth and early twentieth centuries. Moreover, it has shown that the average level of Bolivian tariffs from 1895 to 1935 was fairly similar to that of the most developed countries of Latin America and, therefore, relatively high from a world perspective.
Nevertheless, this article has also demonstrated that, despite high average levels, tariff policy was unable to protect certain products, which represented the most relevant economic activities of several Bolivian regions. First of all, the initial fragility of the Bolivian state-building process and the defeat in the War of the Pacific may help explain the signing of different treaties with neighbouring countries which had two main negative consequences: a reduction in the autonomy of Bolivian tariff policy and the elimination of tariffs for some products which competed directly with local producers. Second, driven by political changes, these treaties were eliminated around 1905 and Bolivia recovered full tariff autonomy. These changes enabled the consolidation of a cascading tariff structure. Despite these improvements and, given the evolution of transport facilities in the country, the prevailing geographical constraints and the low productivity of several sectors of the Bolivian economy, the protectionist effects of tariffs were unbalanced from a regional perspective. Therefore, rather than assuming a general liberalisation of tariffs driven by new ideologies, this article identifies specific institutional and geographical restrictions which might have determined the negative effects of Bolivian trade policy on certain regions.
The article also offers two contributions to the regional historiography. On the one hand, it shows that, during the nineteenth century, the lack of tariff autonomy was not exclusive to Asian countries and could be the result of political and economic pressure from neighbouring countries.Footnote 112 On the other hand, the article offers a new case-study which questions the idea of a laissez-faire, laissez-passer state in Latin America during the export-led growth period. However, it also stresses that the effective protection of tariffs is far from obvious. Thus, more research is still needed in order to identify the protectionist effects by economic sector or region.