INTRODUCTION
There is renewed interest in using forage legumes in sustainable ruminant production systems. In temperate regions, white clover (Trifolium repens L.) is the predominant species used for grazing, whereas red clover (Trifolium pratense L.) and alfalfa (also known as lucerne, Medicago sativa L.) are cultivated mainly for cutting and silage making. These forage legumes represent a major protein source for ruminants in Europe and are a major constituent of low-input farming systems, including organic agriculture. This is due mainly to the biological nitrogen fixation (BNF) ability of legumes and their high nutritional value. As a result, legumes make a substantial contribution to reducing input costs, particularly of mineral nitrogen (N) fertilizer and protein-rich concentrate feeds at the farm level. These benefits and further potentials of legume-based livestock farming have been extensively reviewed (Rochon et al. Reference Rochon, Doyle, Greef, Hopkins, Molle, Sitzia, Scholefield and Smith2004; Peyraud et al. Reference Peyraud, Le Gall and Lüscher2009).
Although legumes have a high nutritional value, the protein of temperate forage legumes is characterized by rapid and extensive degradation in the rumen. Consequently, ruminal degradation rates of dietary protein influence the N-use efficiency by ruminants (Broderick Reference Broderick1995). A large body of evidence in the literature suggests that both rumen micro-organisms and plant proteases may contribute to the inefficient N utilization by ruminants (Kingston-Smith et al. Reference Kingston-Smith, Bollard, Armstead, Thomas and Theodorou2003). In general, ruminal N losses are the result of an imbalance between carbohydrate and protein supply; this increases the risk of N losses and thus poses a threat to the environment (Tamminga Reference Tamminga1996).
There is currently increasing interest in forage legume species that undergo reduced proteolysis during ensiling and reduced protein degradation in the rumen. In this context, legume species containing secondary plant compounds, which reduce the protein degradability, are of particular relevance. The protein of tannin-containing species, such as birdsfoot trefoil (Lotus corniculatus L.), show lower ruminal degradability compared to the tannin-free alfalfa (Broderick & Albrecht Reference Broderick and Albrecht1997; Julier et al. Reference Julier, Guines, Emile and Huyghe2003). In contrast, red clover has only low levels of condensed tannins (Jackson et al. Reference Jackson, McNabb, Barry, Foo and Peters1996; Grabber Reference Grabber2009), but the protein degradation rate of red clover is also less than that of alfalfa. The improved protein utilization of red clover silage by lactating dairy cows compared to alfalfa silage is generally attributed to the polyphenol oxidase (PPO) activity in red clover (Broderick et al. Reference Broderick, Walgenbach and Maignan2001, Reference Broderick, Albrecht, Owens and Smith2004). PPOs are enzymes that catalyse both hydroxylation of monophenols to o-diphenols and oxidation of o-diphenols to o-quinones in the presence of molecular oxygen (Matheis & Whitaker Reference Matheis and Whitaker1984). These PPO-generated quinones are powerful oxidants and strong electrophiles that undergo different reaction pathways, forming brown secondary products. The o-quinones can react with themselves or with the nucleophilic sites of proteins or amino acids (Bittner Reference Bittner2006; Parveen et al. Reference Parveen, Threadgill, Moorby and Winters2010). It is assumed that the nucleophilic reaction of proteins with PPO-generated o-quinones is responsible for the limited proteolysis in red clover silage (Sullivan & Hatfield Reference Sullivan and Hatfield2006). In contrast, effects on N-use efficiency, such as lower N contents in milk, faeces and urine N excretion, were not observed in recent work when fresh red clover with different PPO activities was fed to dairy cows (Lee et al. Reference Lee, Theobald, Tweed, Winters and Scollan2009).
Impacts of the PPO activity (and o-quinone formation) on the protein quality of fresh red clover are still not fully understood. Seasonal variations in PPO activity in red clover leaves have been described in the context of field-based studies (Fothergill & Rees Reference Fothergill, Rees, Wachendorf, Helgadóttir and Parente2005; Winters et al. Reference Winters, Minchin, Michaelson-Yeates, Lee and Morris2008). As the browning reaction starts in fresh red clover leaves when cut or crushed and aerobic conditions are given (Lee et al. Reference Lee, Winters, Scollan, Dewhurst, Theodorou and Minchin2004), it may be supposed that varying PPO activities also affect the protein quality of oven-dried fresh red clover. However, first attempts show a rather poor relationship between specific PPO activity and the protein quality characteristics of oven-dried fresh red clover (Eickler et al. Reference Eickler, Gierus, Kleen and Taube2011), suggesting either that PPO activity alone is not the driving force for improved N-use efficiency of red clover-based diets, or that crude protein (CP) fractions are not sensitive enough to capture the influence of PPO activity, or a combination of both.
Several methods are available for estimating ruminal degradation of dietary CP. One possibility represents the CP fractionation as applied in the Cornell Net Carbohydrate and Protein System (CNCPS). This system classifies the CP into three fractions according to their degradation rates in the rumen; by definition, CP fraction A represents the non-protein nitrogen (NPN), CP fraction B is the potentially degradable true protein and CP fraction C is the protein unavailable for ruminants containing protein associated with lignin, tannin–protein complexes and Maillard products (from a chemical reaction between an amino acid and a reducing sugar). CP fraction B is further divided into the three sub-fractions, B1, B2 and B3, based on their decreasing rate of ruminal degradation (Sniffen et al. Reference Sniffen, O'Connor, Van Soest, Fox and Russell1992; Licitra et al. Reference Licitra, Hernandez and Van Soest1996). However, in most of the studies conducted, the CP fractionation of legume and grass–clover stands was determined at specified harvest dates during the growing season (Seguin et al. Reference Seguin, Mustafa and Sheaffer2002; Kleen et al. Reference Kleen, Taube and Gierus2011). Seasonal variations in the proportion of the main CP fractions (NPN, potentially degradable true protein and undegradable protein) of total CP of forage legumes have not been investigated extensively. In order to improve the N utilization of legume-based rations in ruminant livestock farming, there is a requirement to obtain data showing the extent of fundamental changes in protein composition during the growth period for different forage legumes. The focus of the present study, therefore, was to quantify the main CP fractions during the spring growth and summer–autumn regrowth period of five different forage legume species in mixed cropping and, in the case of red clover, in pure cropping as well. Moreover, it was of particular interest whether the changes in CP fractions of pure red clover could be related to the variation of the PPO activity, stage of maturity or leaf weight ratio.
MATERIALS AND METHODS
Field experiment 1
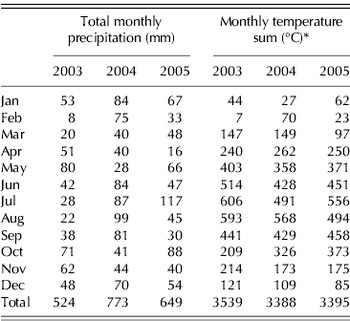
Grazing-type alfalfa (cvar Ameristand), birdsfoot trefoil (cvar Rocco), kura clover (Trifolium ambiguum M.B. cvar Endura), red clover (cvar Pirat) and white clover (cvar Klondike) were grown in binary mixtures with perennial ryegrass (Lolium perenne L. cvar Fennema) at the experimental farm Lindhof of the Christian-Albrechts-University Kiel, northern Germany (54°27′N, 9°57′E, 21 m asl). In autumn of 2002, 2003 and 2004, plots of 3 × 10 m were established on different study sites within the experimental farm in a randomized block design with three replications. The seeding rates were 8, 8, 8, 16, 4 and 15 kg/ha for birdsfoot trefoil, kura clover, red clover, alfalfa, white clover and perennial ryegrass, respectively. Prior to sowing, the seeds of birdsfoot trefoil and alfalfa were inoculated with appropriate rhizobial strains. The seed of kura clover was delivered already inoculated with a rhizobial strain. The experimental site is characterized by a temperate maritime climate with an annual cumulative precipitation of 774 mm and an annual mean temperature of 8·7 °C (1980–2003). Meteorological data during the experimental period are shown in Table 1. Soil texture is a sandy loam/loamy sand.
Total monthly precipitation and temperature sum at the experimental site Lindhof during the study period (data were measured at the nearby meteorological station Kiel-Holtenau)

* Minimum daily temperature in the temperature sum calculation was set at >0 °C (Jan values were multiplied by 0·5, Feb values were multiplied by 0·75 and the values of the following months were multiplied by 1·0).
In each year, sampling was conducted during the spring growth (from April to the end of June) and summer–autumn (from the end of August to the mid of October) regrowth periods of the first full harvest year. At each sampling date, plant material in two 0·25 m2 squares was clipped approximately biweekly, at a stubble height of c. 50 mm, between the onset of growth and the time for achieving/exceeding maximum crop yield. In 2004, the plots were harvested weekly. After harvesting, the herbage samples of grass–legume mixtures were separated into legumes, grasses and weeds. Only the legumes were used for the quality analysis. Due to exceptional drought conditions in 2003, only two replications were available for the alfalfa. After the last sampling date of the spring growth period, a uniform cut was taken and a further cut on 5 August.
Field experiment 2
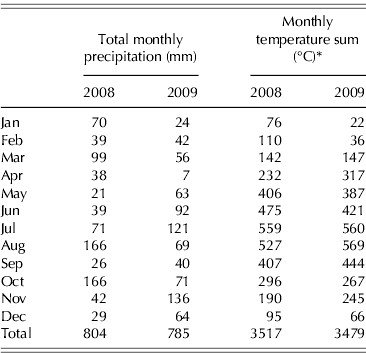
A second field experiment was set up in June 2007 at Hohenlieth, c. 25 km northwest of Kiel, northern Germany (54°24′N, 9°52′E, 19 m asl). Pure stands of two red clover cultivars (Greif and Pirat) were tested in a randomized block design with three replications over two consecutive growing seasons (2008: first full harvest year; 2009: second full harvest year). The plot size was 10·5 m2 (1·5 × 7·0 m). Separate plots were established for the spring growth and summer regrowth periods. The climate conditions of the Hohenlieth site are temperate maritime with an annual precipitation sum of 804 mm (1970–2009) and an annual average temperature of 8·9 °C (1980–2009). Total monthly precipitation and temperature sum during the experimental period are listed in Table 2. Soil texture is a sandy loam and the soil type is a brown soil.
Total monthly precipitation and temperature sum at the experimental site Hohenlieth during the study period (temperature data were measured at the nearby meteorological station Kiel-Holtenau and precipitation data were measured at the experimental station itself)
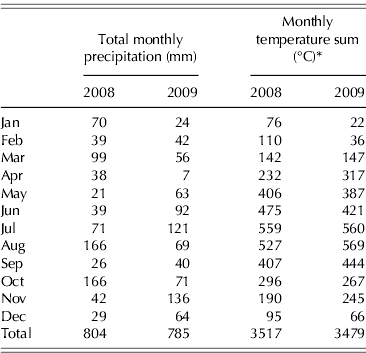
* Minimum daily temperature in the temperature sum calculation was set at >0 °C (Jan values were multiplied by 0·5, Feb values were multiplied by 0·75 and the values of the following months were multiplied by 1·0).
Sampling was carried out biweekly during the spring growth and summer regrowth period as described for field experiment 1. The sampling started on 15 April in both years. In order to achieve uniform conditions at the start of regrowth, all plots were cut after the last sampling date of the spring growth period.
Chemical analysis
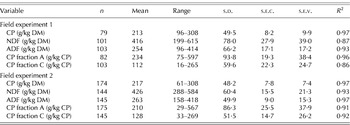
In both experiments, all herbage samples were dried at 58 °C for 48 h and milled to pass through a 1 mm screen (Cyclotec 1093 sample mill, Fa. Foss Tecator, Rellingen, Germany). Subsequently, all samples were scanned in duplicate with a NIR-Systems 5000 monochromator (Perstorp Analytical Inc., Silver Spring, MD, USA) over a wavelength range of 1100–2500 nm in 2 nm intervals. The software NIRS 2 (Infrasoft International®, ISI, Port Mathilda, PA, USA) was used for scanning, mathematical processing, calibration, validation and statistical analysis of the spectra data. Statistical characteristics of the NIRS calibration and validation for the different quality variables of both experiments are presented in Table 3.
Statistical characteristics of the NIRS-calibration and -validation for the investigated quality variables in field experiment 1 and 2

n: number of samples; s.d.: standard deviation; s.e.c.: standard error of calibration; s.e.v.: standard error of validation; R 2: coefficient of determination of calibration; CP: crude protein; NDF: neutral-detergent fibre; ADF: acid-detergent fibre.
The reference laboratory measurements of the selected samples were carried out using the following methods. The N content was measured according to the Dumas combustion method using an elemental analyser vario MAX CN (Fa. Elementar Analysensysteme GmbH, Hanau, Germany) and converted to CP by multiplying the N content in each herbage sample by 6·25. The CP fractions of the CNCPS (Sniffen et al. Reference Sniffen, O'Connor, Van Soest, Fox and Russell1992) were analysed according to the recommendations of Licitra et al. (Reference Licitra, Hernandez and Van Soest1996) with modifications. CP fraction A was measured by filtering the true protein with tungstic acid as the precipitating agent through Whatman 541 filter paper. Afterwards, CP fraction A was calculated as the difference between total N and the N content of the residue. As the sub-fractions of CP fraction B (B1, B2 and B3) were not measured in the present study, CP fraction B was computed by subtracting the sum of CP fraction A and C from total N. Additional samples in filter bags were sequentially analysed for neutral-detergent fibre (NDF) without amylase or sodium sulphite and acid-detergent fibre (ADF) by the method of Van Soest et al. (Reference Van Soest, Robertson and Lewis1991) using a semi-automated equipment (ANKOM220 Fiber Analyzer, Macedon, NY, USA). Subsequently, the N contents of the ADF residues in the filter bags were measured to determine acid-detergent insoluble nitrogen (ADIN). The content of non-structural carbohydrates (NSC) was calculated using the following equation (Van Soest et al. Reference Van Soest, Robertson and Lewis1991):
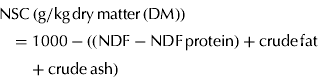 $${\rm NSC}\,({\rm g/kg}\,{\rm dry}\,{\rm matter}\,{\rm (DM)}) = 1000-(({\rm NDF} - {\rm NDF}\,{\rm protein)} + {\rm crude}\,{\rm fat} + {\rm crude}\,{\rm ash})$$
BNF was computed for alfalfa, red clover and white clover in the grass–clover mixtures and for red clover in pure stands, with simple equations (Carlsson & Huss-Danell Reference Carlsson and Huss-Danell2003).
Additionally, at each sampling date in field experiment 2, the leaf weight ratio (LWR; leaf dry weight per plant dry weight at 58 °C) was determined. The phenological development stage (Fagerberg Reference Fagerberg1988) was expressed as mean stage by count (MSC). The specific PPO activity of fresh red clover leaves was measured according to Escribano et al. (Reference Escribano, Cabanes, Chazarra and García-Carmona1997) with modifications (Eickler et al. Reference Eickler, Gierus, Kleen and Taube2011). Briefly, a sample of c. 8 g of frozen leaf material was milled and homogenized using liquid N2. For extraction, 6 ml extraction buffer containing 0·1 m sodium hydrogen phosphate buffer (pH 7·3) and proteinase inhibitors with a final concentration of 0·001 m was added to 1·5 g homogenized leaf material. The PPO activity was measured photometrically at 400 nm for 12 min using 2 mm caffeic acid as substrate. The reaction medium (pH 6·8) contained 0·05 m sodium hydrogen phosphate buffer and 0·69 mm sodium dodecyl sulphate. Protein content of the extracts was analysed by a Bradford protein assay (Bio-Rad, Munich, Germany) at 595 nm. Finally, the PPO activity was expressed in terms of the unit of enzyme (U) on a protein and DM basis (U/μg protein/g DM) and was defined as the amount of enzyme that produces an increase in absorbance of 0·001 per minute.
Calculations and statistical analysis
In order to compare the CP fractions among forage legumes, the area under the curve (AUC) was computed for the CP fractions in field experiment 1 with the trapezoid formula (Reinhardt & Soeder Reference Reinhardt and Soeder2001). Interpolation was used to reach uniform and therefore comparable growth periods among study years. The obtained AUC values were evaluated with an analysis of variance (ANOVA) based on a general mixed model using the software package SAS 9.1, where legume species and years were included as fixed factors. Due to a shorter sampling period during the summer–autumn regrowth (42 days) compared to the spring growth period (57 days), the ANOVA was conducted separately for each growth period. Means from treatments with a significant F-value were compared with Student's t-test using pre-defined contrasts and, to avoid random significances, probabilities were adjusted by the Bonferroni–Holm procedure (Holm Reference Holm1979). The significance level was declared at P < 0·05.
Taking each legume species and growth period separately, multiple regression analysis with forward selection was carried out to examine the influence of temperature sum, precipitation sum, global radiation sum, N yield and NSC content on the variation of CP fractions A and C during the spring growth and summer–autumn regrowth period. In field experiment 2, the influence of MSC, LWR and specific PPO activity were also tested. The significance level for entry of the variable into the model was set at P < 0·05. Before regression analysis, the data were averaged over the field replications. In the case of non-linear functions, the independent variables were transformed (e.g. log transformation, −1/x transformation, quadratic transformation) to obtain linear functions. The highest coefficient of determination (R 2) was the criterion for the chosen function. All regression analysis was carried out with the analyst application in SAS. Root mean square error (RMSE) and adjusted R 2 were given for each regression equation.
RESULTS
Field experiment 1
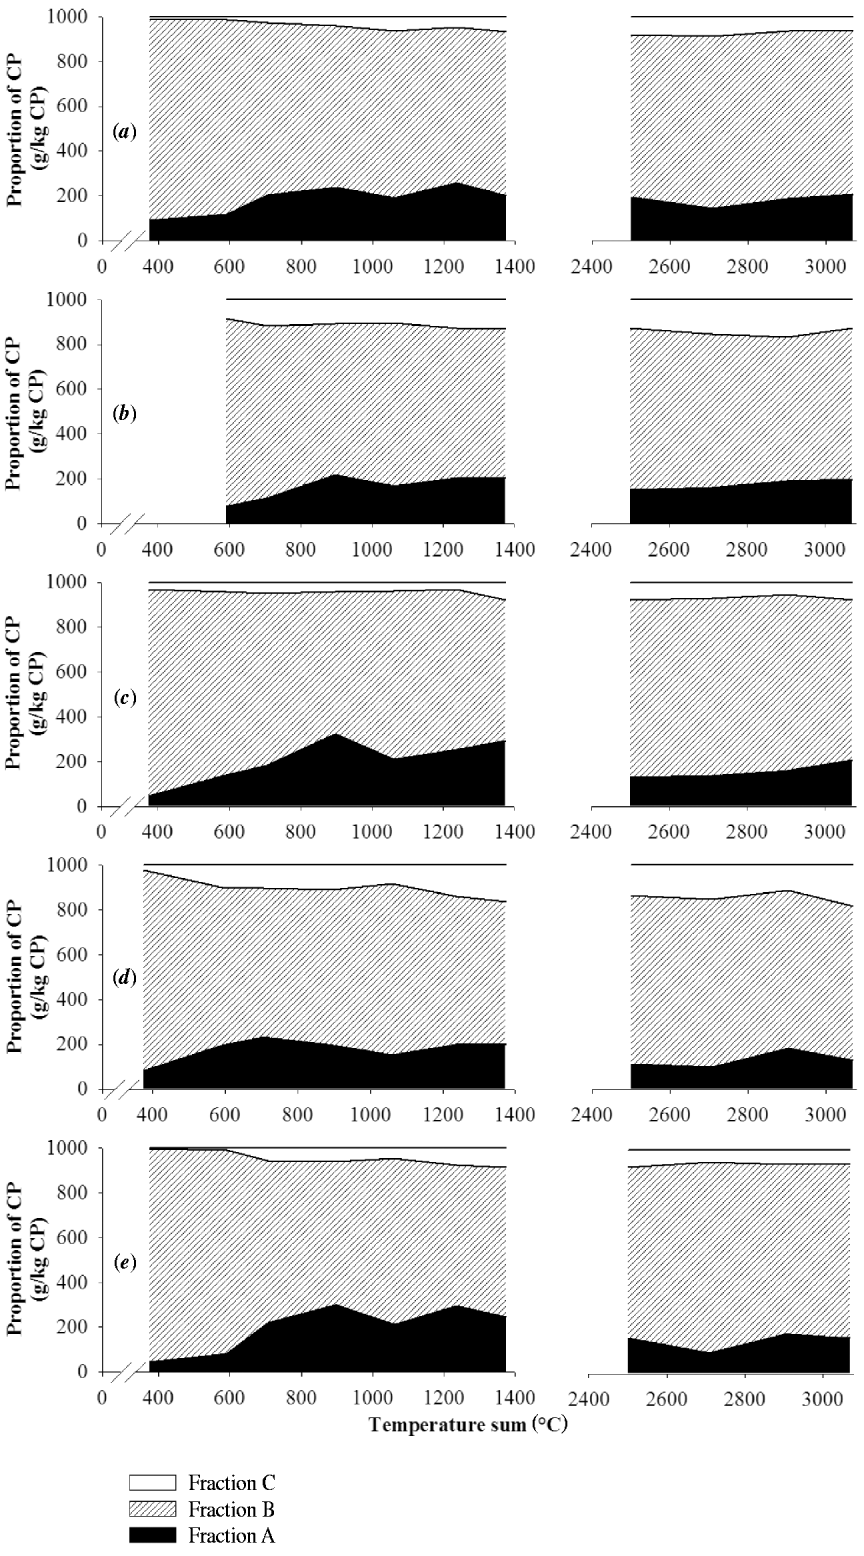
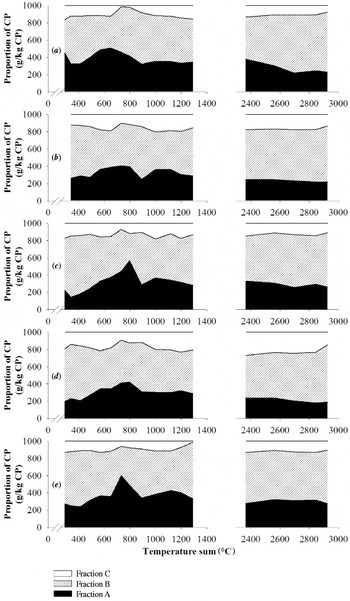
The changes in CP fractions during the spring growth and summer–autumn regrowth period of alfalfa, birdsfoot trefoil, kura clover, red clover and white clover are illustrated in Figs 1–3. In all study years (2003–05), the proportion of CP fraction A in CP increased during the spring growth period. However, some variations could be observed among the sampling dates within the growth periods, particularly in the spring growth period in 2004 during which the proportion of CP fraction A ranged from 144 to 602 g/kg CP. In contrast, in the summer–autumn regrowth periods of 2004 and 2005, CP fraction A decreased with advancing maturity. CP fraction B contributed the largest proportion of the CP, except at some sampling dates in the spring growth period of 2004. In general, advancing maturity increased the proportion of fraction C in CP. However, in 2004 there were high fluctuations and, particularly in the summer–autumn regrowth period 2004, a decrease in CP fraction C was observed. The proportion of CP fraction C increased with increasing ADF contents, whereas the NSC content decreased, regardless of growth period and legume species. In general, these correlations were stronger in the summer–autumn regrowth than in the spring growth period.
Changes in CP fractions of alfalfa (a), birdsfoot trefoil (b), kura clover (c), red clover (d) and white clover (e) from mixed cropping during the spring growth (left side) and summer–autumn regrowth period (right side) in 2003.
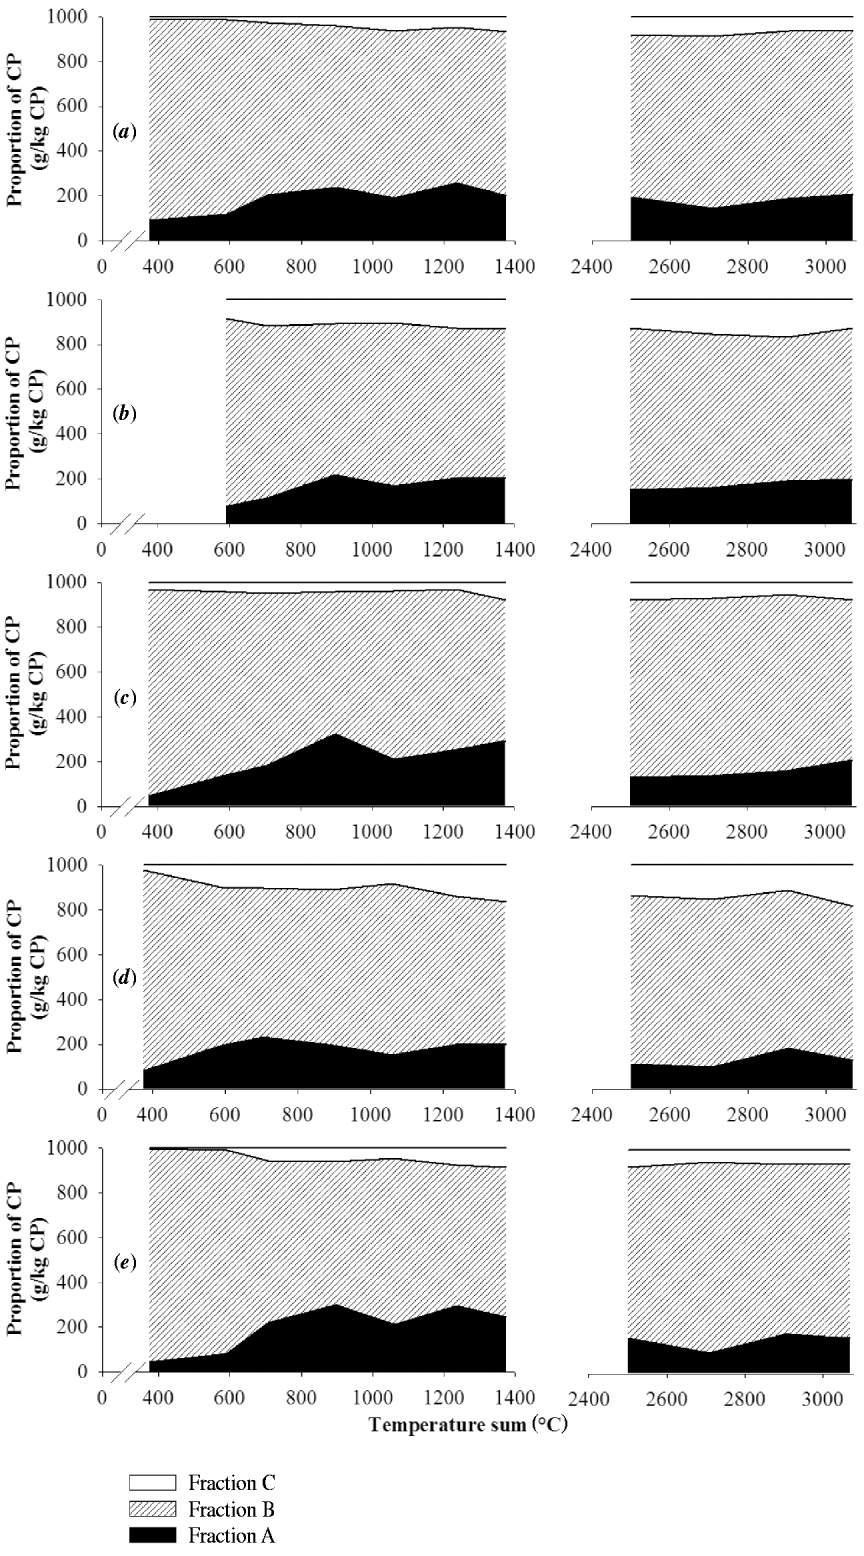
Changes in CP fractions of alfalfa (a), birdsfoot trefoil (b), kura clover (c), red clover (d) and white clover (e) from mixed cropping during the spring growth (left side) and summer–autumn regrowth period (right side) in 2004.

Changes in CP fractions of alfalfa (a), birdsfoot trefoil (b), kura clover (c), red clover (d) and white clover (e) from mixed cropping during the spring growth (left side) and summer–autumn regrowth period (right side) in 2005.

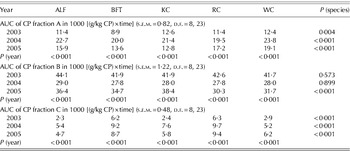
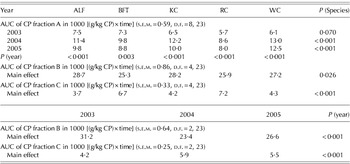
The ANOVA of the AUC values showed an interaction of legume species × year for all CP fractions in the spring growth (Table 4) and for CP fraction A in the summer–autumn regrowth period (Table 5). For CP fraction B and C in the summer–autumn regrowth period, differences among legume species and years were observed as main effects (Table 5). However, the factor year was the most important source of variation for the AUC of the CP fractions, except for CP fraction C in the summer–autumn regrowth period. Comparisons between years showed that the AUC of CP fraction A was the highest in 2004, the AUC of CP fraction B was the highest in 2003, and the AUC of CP fraction C was the lowest in 2003, regardless of legume species and growth period (Tables 4 and 5).
AUC of the CP fractions in the spring growth period as affected by legume species and experimental year

ALF: alfalfa; BFT: birdsfoot trefoil; KC: kura clover; RC: red clover; WC: white clover; s.e.m.: standard error of means; d.f.: degrees of freedom (numerator, denominator); P: probability.
AUC of the CP fractions in the summer–autumn regrowth period as affected by legume species and experimental year

ALF: alfalfa; BFT: birdsfoot trefoil; KC: kura clover; RC: red clover; WC: white clover; s.e.m.: standard error of means; d.f.: degrees of freedom (numerator, denominator); P: probability.
The influence of legume species on the AUC of the CP fractions was inconsistent. In the spring growth period of 2003, the lowest AUC of CP fraction A was found in birdsfoot trefoil, but in 2004 it was for red clover and in 2005 for kura clover. Regarding summer–autumn regrowth periods, differences among legume species were found in 2004 and 2005. Red clover was the only forage legume species for which the AUC of CP fraction A was lowest in the summer–autumn regrowth period in 2004 and 2005 (Table 5). Analyses of CP fraction B in the summer–autumn regrowth period showed that the AUC of alfalfa was higher than that of birdsfoot trefoil, irrespective of year. In contrast, in the spring growth period, these legume species did not differ. In each growth period and in each year, the highest AUC of CP fraction C was observed in both red clover and birdsfoot trefoil.
With the exception of alfalfa in the summer–autumn regrowth period, the proportion of CP fraction A was positively correlated with the BNF. For each legume the correlation between BNF and CP fraction A was much stronger for the spring growth period (alfalfa: R 2 = 0·35, P = 0·001; red clover: R 2 = 0·67, P < 0·001; white clover: R 2 = 0·17; P = 0·024).
Multiple regression equations for the prediction of CP fraction A during the spring and summer–autumn regrowth period of the different forage legume species are shown in Tables 6 and 7. In the spring growth period, N yield, NSC content and temperature sum explained 0·76 of the variation of CP fraction A of alfalfa over all years (Table 6). The N yield was the main predictor for CP fraction A in the spring growth period, except for birdsfoot trefoil and white clover. In the case of birdsfoot trefoil, the content of NSC alone explained 0·50 of the variation of CP fraction A, whereas both N yield and NSC content accounted for 0·86 of the variation of red clover during the spring growth period. The lowest coefficient of determination of 0·33 was observed for white clover including precipitation sum and N yield in the model. A positive linear relationship between CP fraction A and N yield was found for alfalfa (R 2 = 0·58, P < 0·001), birdsfoot trefoil (R 2 = 0·33; P = 0·003), kura clover (R 2 = 0·52, P < 0·001) and red clover (R 2 = 0·74, P < 0·001).
Multiple linear regressions (y=a+b 1x1+b 2x2+b 3x3) between influencing factors and CP fraction A (g/kg CP) for the legumes from mixed cropping in the spring growth period

* Superscripts indicate the type of transformation to obtain linear functions.
ALF: alfalfa; BFT: birdsfoot trefoil; KC: kura clover; RC: red clover; WC: white clover; NY: N yield; NSC: non-structural carbohydrates (assumed fat content: 30·0 g/kg DM); TS: temperature sum; PS: precipitation sum; P: probability; R 2: coefficient of determination; RMSE: root mean square error.
Multiple linear regressions (y = a+bx) between influencing factors and CP fraction A (g/kg CP) for the legumes from mixed cropping in the summer–autumn regrowth period

ALF: alfalfa; BFT: birdsfoot trefoil; KC: kura clover; RC: red clover; WC: white clover; NSC: non-structural carbohydrates (assumed fat content: 30·0 g/kg DM); P: probability; R 2: coefficient of determination; RMSE: root mean square error.
With the exception of red clover, the NSC content alone was the best predictor for CP fraction A in the summer–autumn regrowth period (Table 7). For red clover, no variable was found that fulfilled the criterion for entry into the model, i.e. P < 0·05. In general, increasing NSC contents decreased the proportion of CP fraction A. The relationship was linear for birdsfoot trefoil (R 2 = 0·49; P = 0·004) and for kura clover (R 2 = 0·61; P = 0·001).
The content of NSC was also included in all regression equations for CP fraction C, except for birdsfoot trefoil in the summer–autumn regrowth period, where none of the tested variables fulfilled the criterion for entry into the model (Tables 8 and 9). In each case, there was a negative relationship between CP fraction C and NSC content. The model of red clover in the spring growth period included the variables NSC content, global radiation sum, N yield and precipitation sum explaining 0·89 of the variation of CP fraction C (Table 8). In contrast, in the summer–autumn regrowth period, NSC content alone accounted 0·84 of the variation of CP fraction C of red clover (Table 9).
Multiple linear regressions (y=a+b 1x1+b 2x2+b 3x3+b 4x4) between influencing factors and CP fraction C (g/kg CP) for the legumes from mixed cropping in the spring growth period

* Superscripts indicate the type of transformation to obtain linear functions.
ALF: alfalfa; BFT: birdsfoot trefoil; KC: kura clover; RC: red clover; WC: white clover; NY: N yield; NSC: non-structural carbohydrates (assumed fat content: 30·0 g/kg DM); TS: temperature sum; PS: precipitation sum; GR: global radiation sum; P: probability; R 2: coefficient of determination; RMSE: root mean square error.
Multiple linear regressions (y=a+b 1x1+b 2x2) between several influencing factors and CP fraction C (g/kg CP) for the legumes from mixed cropping in the summer–autumn regrowth period

* Superscripts indicate the type of transformation to obtain linear functions.
ALF: alfalfa; BFT: birdsfoot trefoil; KC: kura clover; RC: red clover; WC: white clover; NY: N yield; NSC: non-structural carbohydrates (assumed fat content: 30·0 g/kg DM); PS: precipitation sum; P: probability; R 2: coefficient of determination; RMSE: root mean square error.
Field experiment 2
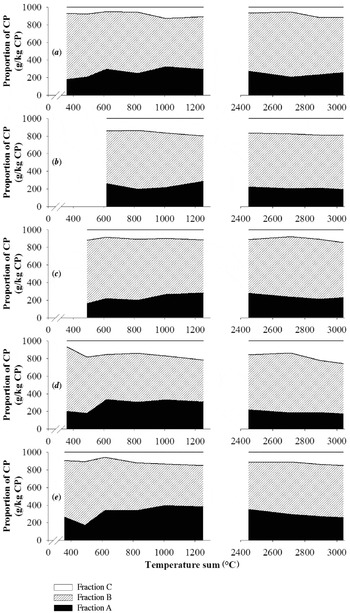
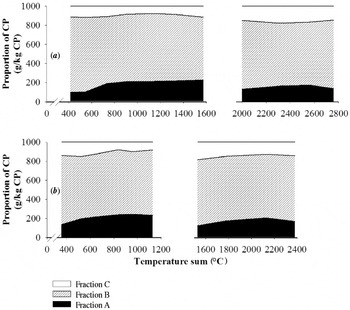
Figure 4 shows the changes in CP fractions during the spring growth and summer regrowth periods of pure red clover in the first and second full harvest year, expressed as averages for both cultivars. The proportion of CP fraction A increased with advancing maturity, irrespective of growth period and full harvest year. In 2009, the content of CP fraction A was generally higher compared to 2008, regardless of growth period. At the end of the summer regrowth periods of both years, CP fraction A decreased again. The proportion of CP fraction B varied between 651 and 789 g/kg CP and had at each sampling date the highest proportion of the CP among the CP fractions. In the summer regrowth periods of both years, the proportion of CP fraction C ranged from 125 to 189 g/kg CP and was higher than the observed values in the spring growth period (76–152 g/kg CP). With the exception of the summer regrowth period in 2008, there was a trend towards decreasing proportions of CP fraction C during each growth period (Fig. 4). The proportion of CP fraction C was negatively correlated with the ADF content, which was contrary to the observations in field experiment 1. In the spring growth period, CP fraction C decreased quadratically with increasing ADF content (R 2 = 0·39; P = 0·001). However, a negative linear relationship was identified for the summer regrowth period (R 2 = 0·17; P = 0·065), but poorly related. In the spring growth period there was a poor positive correlation between ADF and NSC content (R 2 = 0·30; P = 0·002), whereas this correlation was not found for the summer regrowth period (R 2 = 0·02; P = 0·280).
Changes in CP fractions of pure red clover during the spring growth (left side) and summer regrowth period (right side) in 2008 (a) and 2009 (b).

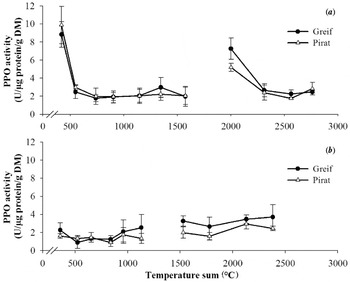
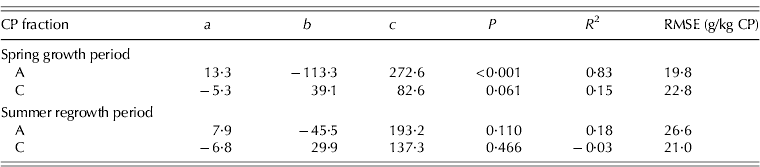
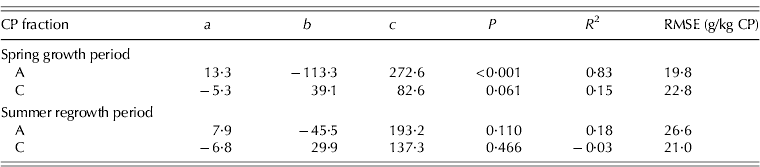
The seasonal changes in specific PPO activity in leaves of two red clover cultivars are illustrated in Fig. 5. There were remarkable differences between the first and second full harvest years. Both growth periods within year demonstrated similarities in specific PPO activity fluctuations. In 2008, advancing maturity led to a decrease in specific PPO activity, whereas in 2009 no differences could be observed among the sampling dates within one growth period. In both years and for both red clover cultivars, it was only in the summer regrowth periods that there was an effect on the specific PPO activity. The relationships between specific PPO activity to LWR and both CP fractions A and C can be described in the form of quadratic functions (Table 10). There was a decrease of CP fraction A when specific PPO activity increased and an increase of CP fraction C with increasing specific PPO activity. However, a strong correlation was only observed between CP fraction A and specific PPO activity in the spring growth period (Table 10).
Variation in specific PPO activity in leaves of two red clover cultivars cropped in pure stands during the spring growth and summer regrowth period in 2008 (a) and 2009 (b). Error bars indicate standard deviation of the mean.

Quadratic regressions (y = ax 2+bx+c) between specific PPO activity (U/μg protein/g DM) in relation to LWR and CP fractions A and C (g/kg CP) in the spring growth and summer regrowth period of pure red clover
P: probability; R 2: coefficient of determination; RMSE: root mean square error.
The correlation between CP fraction A and the calculated BNF was positive during both growth periods of pure red clover. For the spring growth period, a strong quadratic relationship was identified (R 2 = 0·79, P < 0·001), whereas in the summer regrowth period the relationship was linear (R 2 = 0·49; P = 0·002).
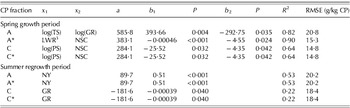
Across all sampling dates of each growth period, multiple regression analysis between CP fraction A of pure red clover and the same independent variables as in field experiment 1 showed that the temperature sum and global radiation sum explained 0·82 of the variation in the spring growth period (Table 11). In addition, including MSC, LWR and specific PPO activity in the model resulted in a coefficient of determination of 0·90, whereas the LWR was the main variable accounting for the variation of CP fraction A. The proportion of CP fraction A increased during the spring growth period when LWR decreased. There was a strong quadratic relationship between CP fraction A and LWR (R 2 = 0·89, P < 0·001), which was much closer than the positive correlation between CP fraction A and MSC (R 2 = 0·52, P < 0·001). For the summer regrowth period, a moderate negative linear relationship (R 2 = 0·36; P = 0·008) was identified. Furthermore, LWR was strongly negatively correlated with the N yield (spring growth: R 2 = 0·90, P < 0·001; summer regrowth: R 2 = 0·78, P < 0·001). In the summer regrowth period, the N yield alone was the best predictor for CP fraction A, irrespective of the variables included in the regression analysis, however, explaining 0·53 of the variation. The precipitation sum and the NSC content demonstrated the best fit for CP fraction C in the spring growth period, whereas the predictive value of the global radiation sum only was 0·22 in the summer regrowth period, regardless of the variables included in the model (Table 11). Increasing NSC contents resulted in moderately decreased proportions of CP fraction C in the spring growth period (R 2 = 0·57, P < 0·001). In contrast, this correlation was absent for the summer regrowth period.
Multiple linear regressions (y=a+b 1x1+b 2x2) between influencing factors and CP fractions A and C (g/kg CP) in the spring growth and summer regrowth period of pure red clover

* MSC, LWR and specific PPO activity in relation to LWR were additionally considered as independent variables; TS: temperature sum; GR: global radiation sum; LWR: leaf weight ratio; NSC: non-structural carbohydrates (assumed fat content: 30·0 g/kg DM); PS: precipitation sum; NY: N yield; P: probability; R 2: coefficient of determination; RMSE: root mean square error.
DISCUSSION
The nutritional value of forage crops is influenced by numerous factors. In addition to the species-dependent variation (Seguin et al. Reference Seguin, Mustafa and Sheaffer2002), environmental factors and stage of maturity also have a strong effect on the forage quality (Buxton Reference Buxton1996). However, there are only a few sources of data that describe the influence of environmental conditions during the growing season and the plant maturation process on the CP fractions of forage legumes. Seasonal environmental conditions substantially affect plant growth and development and thereby many plant physiological processes. Currently, there is much research focusing on the consequences of climate change on agricultural systems (Eitzinger et al. Reference Eitzinger, Orlandini, Stefanski and Naylor2010). Thus, the importance of investigation of alterations in nutritive value of crops also increases. As the sub-fractions of CP fraction B were not determined in the present study, the following discussion focuses on the proportions of CP fraction A and C in total CP.
The impacts of the stage of maturity on the CP fractions are inconsistent (Hoffman et al. Reference Hoffman, Sievert, Shaver, Welch and Combs1993; Elizalde et al. Reference Elizalde, Merchen and Faulkner1999). In both cropping systems of the present study, advancing maturity increased the proportion of CP fraction A, except for the legumes from mixed cropping in the summer–autumn regrowth period 2004 and 2005 (Figs 1–4). The increase of CP fraction A during the growth period may be a consequence of the so-called ‘system-growth’, which according to Linser et al. (Reference Linser, Lach and Titze1968) characterizes the vegetative phase of crops. During this period the consumption of assimilates by self-replication or real growth is of paramount importance. Metabolites are accumulated only after the vegetative phase, resulting in an increase of products such as carbohydrates or reserve proteins, as Linser et al. (Reference Linser, Lach and Titze1968) demonstrated on the basis of pure protein quantifications for wheat and radish. However, the LWR was more relevant for the variation of CP fraction A of pure red clover in the spring growth period than the stage of maturity (Table 11). In general, leaf-rich red clover plants contained the lowest proportions of CP fraction A. This suggests that the N compounds found within leaf tissue are crucial for the proportion of CP fraction A in the CP. As the proteolytic activity increases with alfalfa leaf age (Nieri et al. Reference Nieri, Canino, Versace and Alpi1998), it is not necessarily surprising that CP fraction A of pure red clover was negatively correlated with the LWR. Presumably, the NPN compounds in young red clover leaves are immediately converted into proteins so that these compounds were not included by measuring CP fraction A.
The decrease of CP fraction A at the end of each growing period in the present study was probably a result of the source–sink relationships in forage legumes. After flowering, the remobilization of the stored N in the vegetative plant parts takes place (Hirel et al. Reference Hirel, Le Gouis, Ney and Gallais2007) and, consequently, the proportion of CP fraction A decreases. As the proportion of CP fraction A in forage legumes decreases much lower after flowering, as has been reported for whole-crop maize (Gierus et al. Reference Gierus, Herrmann, Kruse, Kleen and Taube2006) and common vetch (Caballero et al. Reference Caballero, Alzueta, Oritz, Rodríguez, Barro and Rebolé2001), forage legumes obviously develop much lower sink strength during the seed-pod stage compared to non-legumes and grain legumes.
Due to the positive correlation between BNF and legume DM yield (Heichel & Henjum Reference Heichel and Henjum1991; Carlsson & Huss-Danell Reference Carlsson and Huss-Danell2003), it seems likely that the N metabolism may explain the variation of CP fraction A during the growth period of legumes. The primary products containing fixed-N in temperate forage legumes are the acid amides asparagine and glutamine, which are synthesized in and exported from the root nodules to the shoot via the xylem stream. However, asparagine is the predominant acid amide in effective legume root nodules. In contrast, the amounts of glutamine are low (Vance Reference Vance, Dilworth, James, Sprent and Newton2008). This is reflected in the NPN composition of forage legumes. Among NPN compounds in fresh alfalfa herbage, asparagine represents, at 0·24–0·38, the main NPN compound, whereas glutamine has a proportion of only 0·10–0·20 (Van Soest Reference Van Soest1994). As a result, the variation of CP fraction A in forage legumes during the growth period is probably directly related to the BNF capacity of legumes. Consequently, all factors determining BNF, such as the level of inorganic soil N, soil acidity, environmental conditions, defoliation system or competition with the associated grasses (Ledgard & Steele Reference Ledgard and Steele1992; Schubert Reference Schubert1995; Carlsson & Huss-Danell Reference Carlsson and Huss-Danell2003) may affect the export of fixed-N to the host plant and thereby the accumulation of NPN compounds. This assumption was confirmed by the positive correlation between CP fraction A and the calculated BNF of alfalfa, red clover and white clover from mixed cropping and also in the case of pure red clover, with the exception of alfalfa in the summer–autumn regrowth period. Fluctuations of CP fraction A within one growth period are probably a consequence of environmental constraints, as environmental stresses (e.g. water stress, supply of mineral N and soil acidity), which often inhibit the BNF (Schubert Reference Schubert1995). However, the results of the multiple regression analysis showed that the N yield is a more suitable predictor of CP fraction A than the calculated BNF. The N yield accounted for a high proportion of the variation of CP fraction A when it was included into the model, irrespective of the cropping system (Tables 6 and 11).
In contrast to the pure red clover stands, there were some considerable differences among growth periods and years regarding the variation of CP fraction A of the legumes from mixed cropping (Figs 1–4). One reason for these outcomes might be the cropping system and, in the case of the binary mixtures as shown in field experiment 1, the composition of the sward. The behaviour of species in pure stands is usually different from those in mixed cropping (Ellenberg Reference Ellenberg1953). Previous investigations have demonstrated that interspecific competition may increase the CP content of red clover in a grass–clover mixture in comparison with pure stands (Opitz von Boberfeld & Biskupek Reference Opitz von Boberfeld and Biskupek1995); those authors explained this finding in terms of higher N uptake by the grasses leading to lower nitrate content in the soil, so that the BNF of red clover was higher in the binary mixtures than in pure stands. However, the findings of the present study from both cropping systems differ from the observations of Opitz von Boberfeld & Biskupek (Reference Opitz von Boberfeld and Biskupek1995). In the present study, the CP contents of red clover grown in pure stands and grass–clover mixtures were rather similar (pure stands: 91–277 g/kg DM; mixture: 122–306 g/kg DM). The specific site and year conditions of these experiments produced these effects. Nevertheless, it seems likely that interspecific competition was of minor importance for the observed differences in CP fraction A between the two cropping systems.
Another important aspect to be considered in this context is the N transfer from legumes to associated non-legumes in legume–grass mixtures (Burity et al. Reference Burity, Ta, Faris and Coulman1989; Heichel & Henjum Reference Heichel and Henjum1991). High amounts of transferred N increase growth and competitiveness of the associated grasses, resulting in a decrease in the legume production and BNF (Ledgard & Steele Reference Ledgard and Steele1992; Kleen et al. Reference Kleen, Taube and Gierus2011). Jørgensen et al. (Reference Jørgensen, Jensen and Schjoerring1999) observed in the first full harvest year that N transfer was 18–19 kg N/ha from white clover to perennial ryegrass, which was lower than in the second full harvest year. As the legume–grass swards in the present study were used in the first full harvest only, it can be assumed that the N transfer in field experiment 1 was not very high, with less influence on the BNF, and therefore, on the CP composition, particularly the proportion of CP fraction A.
The NSC content was in the mixed cropping systems of the present study the main factor accounting for the variation in CP fraction C, as shown by multiple regression analysis (Tables 8 and 9). Although the changes of CP fraction C with advancing maturity differed between pure legume swards and mixed cropping of legumes, the proportion of CP fraction C was negatively correlated with the NSC content in both of the cropping systems, except for pure red clover in the summer regrowth period. Coblentz et al. (Reference Coblentz, Fritz, Bolsen, Cochran and Fu1997) also found a strong negative correlation between total NSC and ADIN in heat-damaged alfalfa hay at high moisture contents. CP fraction C includes heat-damaged proteins (Sniffen et al. Reference Sniffen, O'Connor, Van Soest, Fox and Russell1992; Licitra et al. Reference Licitra, Hernandez and Van Soest1996) so that the Maillard reaction may be one reason for the negative correlation between CP fraction C and NSC in the present study. As ADF residue is used to measure the proportion of CP fraction C in feedstuffs (Licitra et al. Reference Licitra, Hernandez and Van Soest1996), it seems likely, therefore, that the proportion of CP fraction C increases with increasing ADF content by a simultaneous decrease of NSC. For all legume species from grass–clover mixtures in the summer–autumn growth period, a strong positive correlation was observed between CP fraction C and ADF content, and a strong negative correlation was found between ADF and NSC content. However, there were partly contrasting and poor correlations in the case of the pure red clover stands. Consequently, this assumption is not always true, and in particular it depends on the cropping system of legumes. Previous investigations demonstrated that the ADF content is inappropriate for the prediction of CP fraction C due to the poor relationship between CP fraction C and ADF content (Machacek & Kononoff Reference Machacek and Kononoff2009), confirming only the observations for the pure red clover stands.
The AUC computation of the CP fractions facilitated an assessment of the differences in the amount of CP fraction A, B and C between legume species and year, which may be produced within one growth period. In general, high AUC for CP fraction A suggests that, in terms of ruminant nutrition, the feeding of such forage legumes may lead to inefficient N utilization because CP fraction A is rapidly available in the rumen. One simple strategy for improving the N-use efficiency by ruminants can be to increase the contents of soluble carbohydrates in forages, such as delaying the cutting time from the morning to the evening, particularly during the autumn growth period, as confirmed for alfalfa hay by Andueza et al. (Reference Andueza, Delgado and Muñoz2012).
The AUC of CP fraction B clearly shows that the main CP fraction of forage legumes is CP fraction B, irrespective of legume species, season and cropping system. Seguin et al. (Reference Seguin, Mustafa and Sheaffer2002) found lower proportions of CP fraction B in alfalfa than in red clover and kura clover. In the present study, the range of the proportion of CP fraction B within the study year and growth period was similar for these legume species. Only in the spring growth period of 2005 did the CP fraction B of red clover have a lower AUC, compared with alfalfa and kura clover (Table 4). For CP fraction C, the highest AUC was observed for birdsfoot trefoil and red clover, irrespective of growth period and year. This may be related to the condensed tannins in birdsfoot trefoil and the PPO-generated o-quinones in red clover. In contrast, Grabber (Reference Grabber2009) did not observe differences in the proportion of CP fraction C among alfalfa, red clover and birdsfoot trefoil, which may be related to the drying process of the samples. Defoliation system (cutting or grazing) of red clover and birdsfoot trefoil cropped in binary mixtures with perennial ryegrass can also result in increased proportions of CP fraction C in CP (Kleen et al. Reference Kleen, Taube and Gierus2011).
The PPO effects on post-harvest protection of protein in red clover are facilitated through a sufficient level of damage of plant tissue, which is achieved through conditioning or wilting of fresh herbage. Although no post-harvest cell damage treatments were conducted in the present study, such as roll conditioning or maceration, to stimulate the browning reaction in red clover leaves (Grabber Reference Grabber2008), the prerequisites for initiating the browning reaction were probably also given after cutting. Harvesting of herbage by cutting can cause some cell damage resulting in conditions which permit the browning reaction. Nevertheless, it is likely that in the case of clipped forage samples, smaller effects on post-harvest protein protection could be expected compared to heavily damaged forages. As oven-dried red clover herbage had higher proportions of CP fractions C in CP than alfalfa (Tables 4 and 5); however, there was probably a large enough extent of cell damage and thereby also enough reaction time for the conversion of o-diphenols into protein-binding o-quinones generated by PPO until the enzymatic activity and the substrates of the PPO are stopped during the drying process. This fact has already been discussed by Eickler et al. (Reference Eickler, Gierus, Kleen and Taube2011). Despite these facts, the specific PPO activity seems to be of minor importance for the proportion of CP fraction A and C in oven-dried fresh red clover. Firstly, the correlation between CP fraction A and specific PPO activity in relation to LWR in the spring growth period of pure red clover showed that a high PPO activity above a level of about 2·0 U/μg protein/g DM did not lead to further decrease in CP fraction A, although the specific PPO activity in relation to LWR showed a comparatively wide range (0·2–6·7 U/μg protein/g DM). Secondly, the results of the multiple regression analysis (Table 11) revealed that the PPO activity is less relevant for the variation of CP fraction A during the growth period of pure red clover in the present study. Furthermore, in the study of Eickler et al. (Reference Eickler, Gierus, Kleen and Taube2011) the negative relationship between CP fraction A and PPO activity was not strong in either defoliation system.
A systematic relationship between CP fraction C and specific PPO activity related to LWR was also absent in the present study, so that the specific PPO activity is less relevant for the variation of CP fraction C. This is in accordance with the results from the multiple regression analysis (Table 11) and Eickler et al. (Reference Eickler, Gierus, Kleen and Taube2011). Despite these facts, in addition to the specific PPO activity, there must be a further attribute in red clover that is different than in other forage legumes, as the AUC evaluation for the legume species in mixed cropping revealed higher contents of CP fraction C for red clover compared to alfalfa, kura and white clover (Tables 4 and 5). One possibility might be the content of CP fraction B3. There are indications in the literature that red clover has higher contents of CP fraction B3 compared to alfalfa (Coblentz et al. Reference Coblentz, Fritz, Fick, Cochran and Shirley1998; Grabber Reference Grabber2009). As CP fraction B3 is less degradable in the rumen compared to the CP fractions B1 and B2 (Sniffen et al. Reference Sniffen, O'Connor, Van Soest, Fox and Russell1992), bypass protein comprises large amounts of CP fraction B3. Therefore, improved N utilization efficiency in red clover-based nutrition trials may be related to a larger proportion of CP fraction B3 in CP of red clover rather than its PPO activity.
Overall, the present study gives a deeper insight into the changes in CP fractions during the growth period of forage legume species in mixed and pure cropping, which may be used to optimize the management of forage legumes. The CP fractions seem to provide common parameters for grassland scientists, who focus on plant breeding targeting the nutritive value linked to physiological processes in plants, and for animal nutritionists, who wish to improve protein quality in forage-based diets using CP fractions at specified harvest dates.
In conclusion, the proportion of the CP fractions of forage legume species varies during the growth period with substantial differences between species, growth periods and study years, regardless of mixed or pure cropping. There is a trend towards lower contents of CP fraction A in the summer–autumn compared to the spring growth period. However, the extent to which feeding of forage legumes during the summer and autumn months may lead to a better N-use efficiency by ruminants can only be evaluated when further forage quality characteristics are considered (e.g. content of soluble carbohydrates). The N yield and NSC content seem to be of greater importance for the variation of the CP fractions during the growth period of forage legumes than environmental factors. Although, from the point of view of ruminant nutrition, red clover and birdsfoot trefoil showed advantages for the CP fractions A and C in comparison with the other legume species, these findings are not clearly related to secondary plant compounds in the present study, at least for red clover. Importantly for varietal evaluation, the forage quality of cultivars and species grown in pure stands cannot be compared with or used successfully to predict the forage quality of the cultivar or species growing in binary or other mixed swards as has been long known (e.g. Bebawi & Naylor Reference Bebawi and Naylor1981). In general, the chemical CP fractionation provides, in addition to the classical characteristics such as energy or fibre content, further information to achieve a better evaluation of the quality of forage legume species. Moreover, the present study provides valuable data for the modelling of the CP fractions, which should be the aim of continuing investigations.
This study was financially supported by the H. Wilhelm Schaumann Stiftung. The authors acknowledge Dr Mario Hasler for statistical advice.