I. INTRODUCTION
A major challenge in system engineering is to find novel applications and concepts for different measurement scenarios and detecting tasks [Reference Schrattenecker, Schuster, Scheiblhofer, Reinthaler, Ennsbrunner and Stelzer1]. In addition, these concepts should push the limits of present available systems in technical aspects such as accuracy, flexibility, reliability, and in economical demands, for instance, low-cost solutions, low maintenance requirements, and environmental friendliness. In the field of radar technology, the increasing frequency range of the systems available [Reference Jahn, Aufinger and Stelzer2] fulfilling most of these demands feasible. As a result, novel approaches have emerged, such as highly integrated sensor systems [Reference Fischer, Tong, Hamidipour, Maurer and Stelzer3], reflectometers for three-dimensional holographic imaging [Reference Ghasr, Case and Zoughi4], through-the-wall detection of life signs [Reference Ascione, Buonanno, D'Urso, Angrisani and Schiano Lo Moriello5], low-cost radio frequency identification tag characterization [Reference Catarinucci, Donno, Colella, Ricciato and Tarricone6], and novel high-precision measurement systems [Reference Feger, Pfeffer, Scheiblhofer, Schmid, Lang and Stelzer7] – to name but a few. Especially in welding applications, the presently available sensors are based on mechanical effects as, for instance, in tactile sensors [Reference Byoung-Oh, Yang-Bae and Sang-Bonh8, Reference Suwanratchatamanee, Saegusa, Matsumoto and Hashimoto9] or optical effects, for instance, in laser sensors and camera-supported systems [Reference Li, Li, Wang, Xu and Tan10, Reference Zhang, Ye, Yang and Jiao11]. Furthermore, X-ray [Reference Chen12] or ultrasonic-based sensors [Reference Schuster, Doctor and Bond13] are used for welding control. A drawback of optical sensors is that they can be affected by the environmental influences associated with welding processes, such as fume, dust, pollution, diffused light, and extreme temperatures. Moreover, tactile sensors need mechanical contact to the workpiece, which is often impossible. Consequently, they are only used offline, which increases processing time, because every weld requires two passes (first pass, measurement; second pass, welding). Further, the accuracy achievable by tactile sensors depends on the hysteresis of the preloaded spring. Thus, it is often difficult to assess the absolute accuracy of the available measurement systems in real-world applications. Under the existing industrial conditions, radar-based systems operate reliably, which makes them well suited to control and measurement applications.
In this work, we use a radar system to gauge the position of the welding material. Some investigations of radar-based measurements for seam tracking have already been done by Matthes, Kohler, and later by Kush [Reference Matthes and Kohler14–Reference Kusch, Wallig and Bürkner16]. They used a co-polarized, continuously moving continuous-wave radar approach. Due to this fact, they faced some problems when dealing with abrupt changes in the geometry. We focus on local polarimetric effects which are introduced by discontinuities in the welding material (e.g. an edge or a step). They can be measured by using a cross-polarized antenna configuration. Since these effects are strongly locally bounded to the discontinuities, higher accuracy can be achieved by using a cross-polarized approach for position estimation (PoE) compared with a co-polarized one. We have already demonstrated the functionality of the basic principle and that radar sensors work reliably during a welding process in [Reference Schrattenecker, Schuster, Scheiblhofer, Reinthaler, Ennsbrunner and Stelzer1]. There, the basic measurement scenario and the signal processing focused on the most common welding geometry, namely a lap joint is presented. In this paper, we concentrate on the V-butt joint and the T-joint, which are – alongside the lap joint – the most prevalent material arrangements in practical welding applications. Local polarimetric effects introduced by the shapes of the welding materials are used for PoE. These effects can be detected using a cross-polarized radar configuration, an approach often used for target classification tasks [Reference Nakamura, Yamaguchi and Yamada17]. Cross-range resolution is achieved using the synthetic aperture radar (SAR) principle [Reference Soumekh18, Reference Cumming and Wong19]. The PoE capability of the V-butt joint and the T-joint is shown by measurements in an industrial environment. In addition to the new welding joints, we present an optimization of the method that is accomplished by geometrical arrangement. Additionally, this optimization requires an extension in the signal processing considerations which is explained in detail.
This paper is organized as follows. First, the problem at hand is introduced. In particular, the reference configurations for simulations and measurements are presented. Further, the welding geometries are explained, followed by a description of the hardware prototypes used in the real-world measurements. In the next step, the PoE for the different geometries is addressed. The simulations are then verified by measurements taken with the prototypes presented before. The measurements are taken on a welding test stand in an industrial environment and in the laboratory. Before the measured data can be used for PoE, a data preparation signal processing work-flow is performed. This work flow is introduced in the following part of this paper. Finally, a geometrical optimization of the measurement scenario in terms of PoE accuracy is carried out. The theoretical outcomes are verified by Monte Carlo (MC) simulations and measurements. These measurements are performed by a self-developed, highly flexible frequency-modulated continuous-wave (FMCW) radar prototype, described in [Reference Schmid, Fischer, Feger and Stelzer20, Reference Fischer, Tong, Hamidipour, Maurer and Stelzer21].
II. PROBLEM FORMULATION
A sketch of the simulation and measurement scenario is shown in Fig. 1. The variable
 ${{\bf r}_A}$
stands for the actual position of the antenna system, x
K
denotes the position of the step, d is the thickness of the plate, and u
x
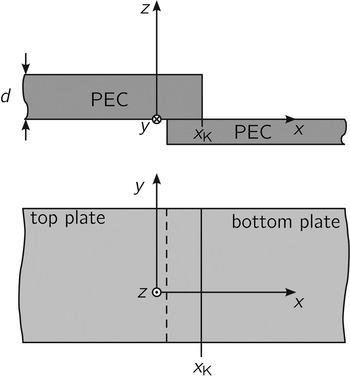
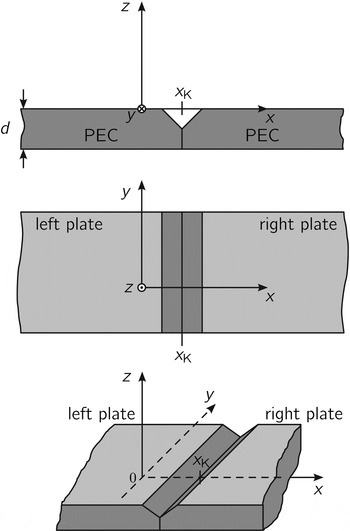
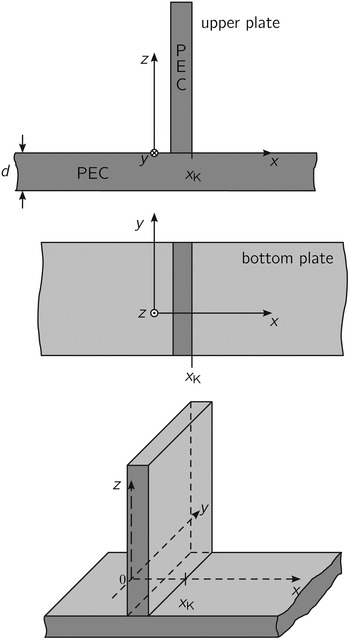
denotes the position along the synthetic aperture. The antenna system consists of two linearly polarized, pyramidal horn antennas that are orientated such that they cover orthogonal polarization planes. Range resolution is obtained by means of the FMCW principle [Reference Stove22], and cross-range resolution is achieved by moving the antenna system in the x-direction along an equidistant grid. As target geometries, a lap joint, a V-butt joint, or a T-joint is used. Basic arrangements of these joint types are shown in Figs 2–4, respectively. For the simulations the welding joints are assumed to be perfect electrical conductor (PEC). The lap joint is formed by a top and a bottom plate, where typical thicknesses can range from a few millimeters up to several centimeters.
Schematic diagram of the simulation and measurement scenario. As a target a lap joint, V-butt joint, or a T-joint is used.

Side and top view of a typical lap joint formed by a top and a bottom plate.

Geometry of a typical V-butt joint in top, side, and isometric view. The left and the right plate form the geometrical arrangement.

Geometry of a typical T-joint in top, side, and isometric view.

V-butt joints investigated in this paper have thicknesses of several millimeters. The geometry consists of two plates which are forced together mechanically. On the side where the plates meet, they have machined flat surfaces. The V-butt joint used has chamber-bevels with an angle of about 45°. This means, that a corner reflector with a total angle of 90° is formed within the geometry.
For the T-joint shown in Fig. 4, the two target plates (upper and bottom plate) form a T-like shape. In industrial scenarios, the T-joint is often accessible from only one side. This is introduced as an additional limitation to the T-joint target measurement scenario described in Section VI.
For all target types, it is assumed that the footprints of the antennas are small compared with the dimensions of the plates of the targets. Hence, it can be assumed that only the main edge or corner is illuminated by the system. As described in [Reference Schrattenecker, Schuster, Scheiblhofer, Reinthaler, Ennsbrunner and Stelzer1], only cross-polarized scattering effects of the targets are used for PoE. All geometries (lap joint, V-butt joint, and T-joint) introduce local polarimetric effects that occur at spatial discontinuities such as edges, wedges, or corner reflectors [Reference Michaeli23]. Since the polarization effect within corner reflectors is well pronounced, they are often used for polarimetric system calibration [Reference Wiesbeck and Kahny24, Reference Knott25].
III. 77 GHZ HARDWARE PROTOTYPES
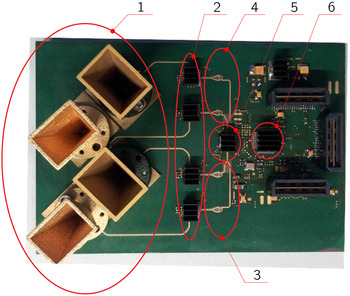
To obtain real-world measurement results various FMCW radar prototypes were employed. Figure 5 shows one prototype frontend (FE). For the sake of self-containment, the basic parts of the FE are recapitulated here (a detailed description can be found in [Reference Schrattenecker, Schuster, Scheiblhofer, Reinthaler, Ennsbrunner and Stelzer1]). A 77 GHz voltage-controlled oscillator (VCO #5), stabilized in a phase-locked loop (PLL) #6 generates the radio frequency signals. Four transceiver (TRX) chips #2 are driven by the VCO outputs using the feeding networks #3, #4. These TRX chips drive four horn antennas #1, which are fed by a single-ended version of the waveguide transition [Reference Tong and Stelzer26]. The horn antennas achieve a gain of about 20 dBi and provide a linearly polarized field. To conduct polarimetric measurements, the antennas are arranged to cover orthogonal polarization planes. Figure 6 shows a second radar prototype based on a 77 GHz FMCW radar TRX monolithic microwave integrated circuit (MMIC) with a waveguide transition. As an antenna, a standard gain WR12 horn antenna is used. The transition features a 77 GHz TRX with a 4 GHz local oscillator (LO) input and output. The LO signal is multiplied by a factor of 18 for operation in the 77 GHz band. This prototype allows maximum flexibility in the measurement setups. A detailed description of the radar can be found in [Reference Schmid, Fischer, Feger and Stelzer20, Reference Fischer, Tong, Hamidipour, Maurer and Stelzer21]. To form a complete radar unit a baseband board (BB) is used in addition to the FEs. The BB contains the analog-to-digital converters for digitizing the intermediate frequency signals and is used to activate and deactivate the FE, program the parameters of the synthesizer for the frequency ramp, trigger the start of the frequency ramp, and provide the power supply. Additionally, the BB provides a USB communication interface to a host PC.
Photograph of the FMCW prototype FE used for measurements at the welding test stand.

Photograph of a complete 77 GHz radar TRX module with a WR12 transition on top of the packaged MMIC.

IV. SIGNAL MODEL CALCULATION AND SIGNAL PREPARATION
This section presents the signal model that formed the basis of our investigations. Additionally, the measurement data preparation by means of range compression is described.
A) Signal model
From the integral equation (IE) simulation, a two-dimensional (2D) numerical signal model of the target's co- and cross-polarized scattering behavior is obtained (depending on the linear FMCW frequency sweep and the position along the synthetic aperture). Since only cross-polarized scattering effects are used for the PoE, the derivation focuses on them. Calculating the scattering behavior of the target numerically with an IE approach is computationally demanding. Without sacrificing accuracy, the signal model can be compressed to one dimension (1D), by a range compression technique as described in Section IV.B to reduce computation time and memory effort. This compression is applied efficiently in the simulation by calculating the signal model at the center frequency f c of the linear frequency sweep of the FMCW radar only, which minimizes calculation time. The resulting signal model is
 $$s[m] = A\;W[m,\;{x_{\rm K}}]{e^{ - {\rm j}2{k_c}R[m] - j{\phi _{refl}}}}$$
with k c = 2πf c / c. The complex modulation function W[m, x K ] combines the antenna gain of the receive (RX) and transmit antennas and the target's scattering behavior. The variable A > 0 represents the amplitude of the RX signal (depending mainly on path loss, transmit power, and the internal mixer gain), R[m] is the range between the antenna and the target. This target range depends on the current position of the antenna system with m = 0, 1, …, M x − 1 being the discrete position index. The propagation velocity of the electromagnetic wave is denoted by c. Furthermore, −π ≤ ϕ refl < π describes, for instance, an unknown reflection phase depending on the reflection properties of the target, and an additional phase due to the unequal phase shift of the different antennas, etc. As long as the narrowband assumption B ≪ f 0 is fulfilled, the resulting model is sufficiently accurate to describe the scattering behavior of the target. This means that calculating s[m] at the center frequency only is possible, and it is assumed to be independent of the chirp's starting frequency.
B) Range compression and advanced range compression
In literature many different SAR signal processing algorithms are available [Reference Soumekh18, Reference Cumming and Wong19]. Nevertheless, for our specific application we had to come up with an approach which is processable in real time, even on a standard desktop computer. Before the position of the weld can be estimated, the measured data must be preprocessed; more specifically, the 2D-measured data sets x(u
x
, k
r) are reduced to 1D. In the basic form, as described in [Reference Schrattenecker, Schuster, Scheiblhofer, Reinthaler, Ennsbrunner and Stelzer1], x(u
x
, k
r) is Fourier-transformed and scaled to range. Then |x(u
x
, R)| is calculated and summed up over all positions u
x
. The range bin containing the maximum of the sum corresponds to
 ${\hat R_{max}}$
, which indicates the dominant reflection of the target. The variable k
r
= 2πf / c describes the wave number corresponding to a linear frequency chirp performed by the FMCW radar, where f is the actual chirp frequency.
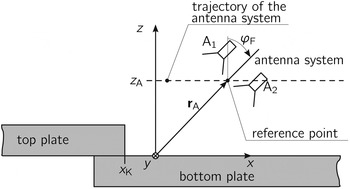
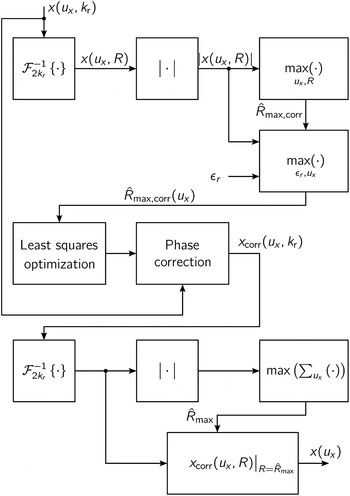
When the antenna system faces the step of the lap joint or the T-joint, the previously described range compression does not achieve the desired accuracy. This is due to energy-blurring effects of the SAR principle. Figure 7 serves as a reference and shows the example of a lap joint where the antenna system faces the step of the lap joint. Next, a more advanced range compression procedure is introduced. The approach can be described best with the help of the block diagram in Fig. 8.
Schematic diagram of the simulation and measurement scenario with the antenna system facing the step with the facing angle φ F .

Schematic block diagram of the range compression: the antenna system is facing the step of the lap joint or the T-joint.

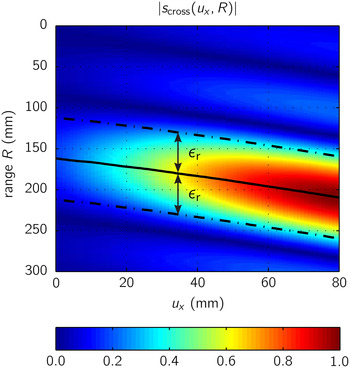
In the first step, the sampled data are Fourier-transformed and scaled to range. Again, the absolute value is calculated and the data point corresponding to the dominant reflection is determined. The corresponding range values of these maxima are stored. This search is performed in region ±ε
r
in the range direction R, and the center of the search area depends on the previously found maximum. These search areas are depicted by the dashed lines and the estimated ranges are highlighted by the solid line in Fig. 9. The result is a region in which the maxima are calculated. This course of action is important, because of disturbances such as multi-path or other reflections at different ranges. This yields the range of the dominant reflection depending on the position of the synthetic aperture
 ${\hat R_{max,\;corr}}({u_x})$
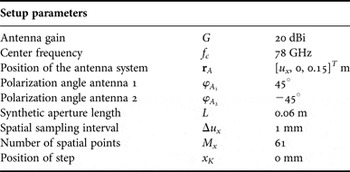
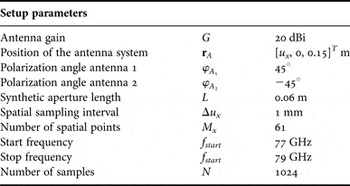
. This information is then used to calculate the phase shift (also known as range migration) according to the SAR parameters and the resulting ranges. A least squares approach is used to estimate the shift. The blurring effect is then compensated by correcting the phase shift, and the range-corrected data are subsequently Fourier-transformed. As a result, the maxima of the reflections are again concentrated at a single range bin. Range compression by calculating the Fourier transform and evaluating the signal at the dominant reflection only can then be performed to compress the data to 1D. In Figs 9 and 10 the results for the different range compression methods are plotted. The simulations are based on the parameters listed in Table 1, where a facing angle of 45° was chosen for the antenna system. For the simulation, a lap joint with a top plate thickness of d = 10 mm was chosen. Figure 9 illustrates the absolute value of the data's range profile. The signal energy is blurred over several range bins. The search region ε
r
of the maxima at the different aperture positions is indicated. Hence, the simple range compression as described in the previous section cannot be used. In Fig. 10, the range profile after correcting for range migration is shown. In this case, the signal can be calculated at a single bin to compress it within range. For all measurements with facing angles φ
F
except 0°, this advanced range compression is used. The compressed data are then used for further parameter estimation.
Absolute value of the range profile of a lap joint where the antenna system is facing the step at an angle of 45°. The dashed lines depict the search areas and the solid line the estimated ranges.

Absolute value of the range profile of a lap joint after correction for range migration. The antenna system faces the step at an angle of 45°.

Simulation parameters.

V. BASIC IDEA OF CONCEPT IMPROVEMENTS
For the PoE the PoE algorithm
 $${\hat m_0} = \mathop {{\rm arg}\;{\rm max}}\limits_{{m_0} \in \left[ { - {M_{off}},\;{M_{off}}} \right]} \displaystyle{{{{\left \vert {\sum\nolimits_{m = 0}^{{M_x} - 1} {{{\overline s} ^*}[m + {M_{off}} - {m_0}]x[m]}} \right \vert} ^2}} \over {\sum\nolimits_{m = 0}^{{M_x} - 1} {{{\left \vert {\overline s [m + {M_{off}} - {m_0}]} \right \vert} ^2}}}}, $$
as derived in [Reference Schrattenecker, Schuster, Scheiblhofer, Reinthaler, Ennsbrunner and Stelzer1] is used. For the calculation, it is assumed that all parameters except the position of the weld are known. This assumption is fulfilled in most welding applications because e.g., the thickness of the plates directly influences the welding current and thus must be known during the welding process. In (2), M
off
denotes additional signal parts of the signal model along the synthetic aperture. Since the position of the materials is assumed to be unknown, these parts ensure that the complete measured data are covered by the simulation model. This means a wider data range in u
x
is chosen for the simulation model than for the measurement. Hence, the length of
 ${s_{{u_x}}}$
is 2M
off
+ M
x
and the length of
 ${x_{{u_x}}}$
is M
x
. The variable m
0 is the actual shift between the signal model and the measured data x[m]. The signal model is
 $s[m] = \tilde A{\kern 1pt} \overline s [m]$
with a linear parameter
 $\tilde A = A{\kern 1pt} {e^{\;j{\phi _{refl}}}}$
. Further,
 $\hat \cdot $
indicates that
 ${\hat m_0}$
is an estimated parameter. It was shown in [Reference Schrattenecker, Schuster, Scheiblhofer, Reinthaler, Ennsbrunner and Stelzer1] that cross-polarized PoE works well for different types of welding targets and that the variance is acceptably small, but can be decreased further by optimizing the measurement scenario.
The variance of the PoE [Reference Schrattenecker, Schuster, Scheiblhofer, Reinthaler, Ennsbrunner and Stelzer1] achievable by the PoE algorithm (2) is approximately bounded by
 $${\rm var}\left\{ {{{\hat x}_K}} \right\} \ge \displaystyle{1 \over {2{M_x}\;{\rm SNR}\;\overline {B_{{\rm PoE}}^2}}}. $$
The achievable variance of the PoE is lowered in the case of increasing
 $\overline {B_{{\rm PoE}}^2} $
which can be interpreted as a mean square bandwidth related to [Reference Kay27, p. 55], the number of spatial points M
x
and the signal-to-noise ratio (SNR). If the number of spatial points increases, also the measurement time, as well as, the signal processing demands increase. The SNR depends on the radiated power, the hardware used and the back-scattered power. The mean-square bandwidth is influenced by different parameters e.g. the reflection characteristic of the target and the used antennas. By changing the illumination angle of the antenna system, the reflection characteristics of the target and consequently the SNR and the mean square bandwidth can be changed. The main objective is now to find an optimum facing angle φ
F
to decrease the variance of the PoE algorithm. For the considerations presented here, Fig. 7 serves as a reference. Simulations were performed for various angles φ
F
based on the setup parameters in Section I. The results were validated by MC simulations and measurements, and can be found in Section VI.A.
Additionally, it has to be noted that, due to the target's shape, positioning the antenna system to face towards the target makes sense only when dealing with a lap joint or a T-joint.
VI. MEASUREMENT RESULTS
To verify the signal model and the estimation algorithm described in Section V for the different joint geometries, we performed measurements using the prototype hardware both in a measurement chamber and at a welding robot during the welding process. Additionally, measurement results for multi-step scenarios were investigated in [Reference Schrattenecker, Schuster, Scheiblhofer, Reinthaler, Ennsbrunner and Stelzer1].
A) V-butt joint target
The measurements of the V-butt joints were taken at a welding robot test stand using the polarimetric FE shown in Fig. 5. The measurement setup was based on the parameters in Section II. We chose the facing angle φ F = 0°, so the standard range compression method could be used. As a measurement target, a V-butt joint with 45° chamber-bevel on each side was used. This resulted in a total angle of 90° of the corner-like shape in the V-butt joint, as shown in Fig. 3.
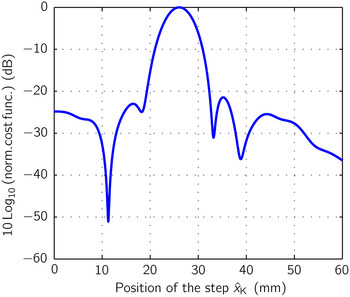
In Fig. 11, the range profile resulting from the measurement is plotted. The reflected energy was scattered across the aperture positions due to the particular wide geometry of a V-butt joint. The resulting data are symmetric around the corresponding position of the V-butt joint. This fact is based on the geometrical symmetry of the target. Due to its corner-like shape, the V-butt joint has a significant polarimetric scattering behavior [Reference Knott25]. Figure 12 shows the range-compressed measurement data x cross (u x ) and the corresponding signal model s cross (u x ). It can be seen that both, the real and the imaginary part of the measurement data and the model are in good agreement. Figure 13 illustrates the plot of the cost function of the PoE in a logarithmic scale. The maximum of the cost function is distinct and corresponds to the position of the joint. The estimated position was validated by the commercial available welding laser sensor MEL M2-iLAN-2 from MEL Mikroelektronik GmBH, which provides a cross-range resolution of 0.01 mm. Both the good agreement between signal model and the measurement data and the resulting cost function indicate that the polarimetric approach and the underlying measurement hardware and the signal processing algorithm are well suited for PoE of the V-butt joint.
Range profile of the measurement data of the V-butt joint.

Range-compressed measurement data x cross (u x ) and signal model s cross (u x ) for a V-butt joint. They are in good agreement.

Cost function resulting from the position estimation (PoE) of the V-butt joint with the same measurement data as used for Fig. 12.

B) T-joint targets
The measurement setup is shown in the photograph in Fig. 14. In real-world measurements, it is often impossible to illuminate the T-joint from different sides with the radar sensor. Hence, this restriction was also added for the measurements discussed here. The antenna system faced the T-joint at an angle φ F = 45°, which gave a more realistic measurement scenario for practical applications. Measurements were again taken at our project partner's welding robot test stand, and the basic measurement parameters were those listed in Table 2. The only differences in the measurement setup were a synthetic aperture of L = 0.05 m and a distance of z A = 0.125 m because of mechanical arrangements at the measurement test stand. The antenna system is also moved toward the T-joint for the sake of mechanical simplicity, as indicated in Fig. 14.
Photograph of the measurement arrangement of the T-joint. The radar prototype is mounted on the welding robot, and the antenna system is focused in the direction of the T-Joint.

Measurement parameters.

Since φ F was not equal to zero, the range compression described in Section IV.B was used before the PoE algorithm estimated the position of the T-joint.
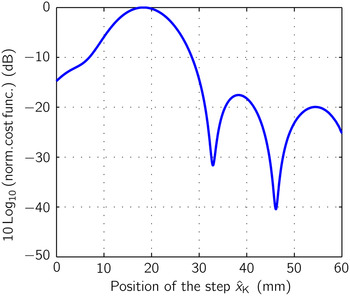
In Fig. 15, the real and the imaginary parts of the range-compressed data and the signal model are shown. It can be seen that the measurement and model are in good agreement. For the sake of completeness, Fig. 16 plots the cost function resulting from the PoE of the T-joint. Again, the maximum indicates the estimated position, which was validated with the laser sensor. Compared with the other cost functions (Fig. 13 or in [Reference Schrattenecker, Schuster, Scheiblhofer, Reinthaler, Ennsbrunner and Stelzer1]), the width of the peak in Fig. 16 is higher, which implies greater variance in the PoE. This is the result of positioning the antennas such that they face the target, rather than choosing the optimal angle. This effect will be investigated in detail in the next section. Nevertheless, it is shown here that the polarimetric PoE concept is also suitable for the PoE of different welding arrangements, as long as the target introduces polarimetric effects, which is caused by nearly every practical relevant target configuration for welding applications.
Measured data x cross (u x ) and signal model s cross (u x ) of a T-joint. The measurements were taken with the FMCW prototype introduced in Section III. The setup parameters are given in Section II.

Cost function resulting from the position estimation (PoE) of the T-joint based on the same measurement data as used for Fig. 13.

1) STATISTICAL VALIDATION
For the performed considerations, the Cramer–Rao lower bound (CRLB) was calculated for various facing angles φ F as described in Section V and depicted in Fig. 7. As a target, a lap joint with a thickness of 10 mm was used. The simulations and measurements are introduced to show the principle of the optimization approach and to validate the theoretical bounds.
For the measurements, the TRX MMIC-based radar system shown in Fig. 6 was used. The complete measurement setup (depicted in photograph shown in Fig. 17) provides high flexibility. The measurements were performed in a laboratory environment. Two radar prototypes were mounted in a ±45° polarization configuration in front of the linear axis. In accordance with [Reference Schmid, Fischer, Feger and Stelzer20], a sweep from 74.5 to 76.5 GHz was chosen because the radar module provides the maximum output power in this frequency range. In the measurements, the facing angle φ F of the antenna system was varied from 0° to 20°. Each reported measurement at each position of the SAR and each angle was based on 500 individual trials.
Photo of the measurement arrangement for verifying the improvements in the variance of the position estimation (PoE). The MMIC-based radar prototype depicted in Fig. 6 was used.

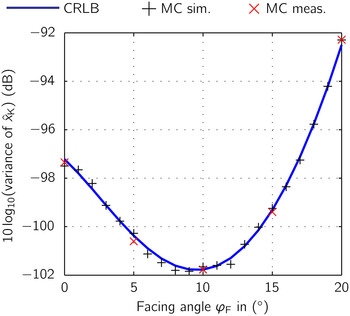
Figure 18 shows the resulting CRLB. For φ F between 0° and 10°, the achievable variance decreases significantly. When the angle φ F increases from 10° to 20°, the variance also increases. For the setup used, the optimum facing angle was about 10°, as this resulted in the minimal variance of the PoE. The CRLB outcomes were verified by MC simulations with 1000 trials. All results, the CRLB, the MC simulation and the measurements are in good agreement. Comparing the start value of φ F = 0° with the optimum angle φ F = 10°, the achievable variance can be reduced by about 5 dB, without changing any setup parameters except the facing angle.
CRLB of position estimation (PoE) for different facing angles. The CRLB was validated by MC simulations and measurements. The CRLB and the MC results are in good accordance. An improvement in the CRLB can be achieved when the antenna system faces the lap joint.

Not only the estimation variance but also the energy of the disturbing co-polarized signal parts decreases with increasing facing angle, because these parts are reflected away from the antenna system. Hence, the requirements to the antenna system in terms of polarization suppression decrease. It is shown that geometrical optimization of the concept is possible with significant accuracy improvements.
VII. CONCLUSION AND SUMMARY
Based on the results presented in this paper, it can be concluded, that the PoE by using a radar system works well with different welding joints. The measured data of the investigated joints is in good agreement with the calculated signal models. Decreasing the variance in the PoE by utilizing geometrical conditions of the welding joints shows significant improvements. Therefore, it has to be taken into account for further sensor designs especially when thinking of an industrial application.
ACKNOWLEDGEMENTS
The authors would like to thank C. Pfeffer, R. Feger, and A. Fischer from Christian Doppler Laboratory for integrated radar sensors, C. Wagner from Danube Integrated Circuit Engineering for hardware and radar chip support, and G. Reinthaler from Fronius International for measurement support.
 Jochen O. Schrattenecker was born in Wels, Austria, in 1985. He received his Dipl.-Ing. (M.Sc.) degree in Mechatronics from Johannes Kepler University, Linz, Austria in 2011, and is presently working toward the Ph.D. degree at Johannes Kepler University Linz. In 2011, he joined the Institute for Communications Engineering and RF-Systems, Johannes Kepler University Linz, as a research assistant. His research topics are radar signal processing, as well as radar system design for industrial sensors.
 Stefan Schuster was born in Linz, Austria, in 1978. He received the Dipl.-Ing. (M.Sc.) degree in Mechatronics and Dr. Techn. degree (Ph.D.) in Mechatronics from Johannes Kepler University, Linz, Austria, in 2003 and 2007, respectively. From 2007 to 2009, he was a senior researcher with the Christian Doppler Laboratory for Integrated Radar Sensors, Institute for Communications and Information Engineering (ICIE), University of Linz, Linz, Austria. Since 2009, he has been a Research Engineer in the Sensor Systems and Signal Theory Group of Voestalpine Stahl GmbH, Linz, Austria. His research interests include statistical signal processing, parameter estimation, radar signal processing, and RF-system design.
 Christian M. Schmid was born in Vienna, Austria, in 1983. He received his Dipl.-Ing. (M.Sc.) degree in Mechatronics from the Johannes Kepler University (JKU), Linz, Austria, in 2009. During his time as an M.Sc. student, he was a visiting student at Prof. Tatsuo Iotho's Microwave Electronics Laboratory, University of California, Los Angeles, in 2008. From 2009 to 2014 he was a research assistant at the Christian Doppler Laboratory for Integrated Radar Sensors, JKU, Linz. Mid-2014 he joined Infineon Technologies, where he carries on his work on millimeter-wave radar system design for automotive applications. Mr. Schmid served as IEEE Region eight Student Representative 2013–14 and presently serves IEEE Region eight Secretary 2015–16. He was recipient of a German VDI award in 2009 and of the 2012 European Conference on Antennas and Propagation (EuCAP) Best Measurement Paper Prize.
 Werner Scheiblhofer was born in Linz, Austria in 1982. He received the Dipl.-Ing. (M.Sc.) degree in Mechatronics from the Johannes Kepler University Linz, Austria, in 2009. In the same year he joined the Institute for Communications Engineering and RF-Systems, Johannes Kepler University, Linz, as a research assistant. His research topics are radar system design and concepts for industrial radar sensors.
 Helmut Ennsbrunner was born in Linz, Austria, in 1976. He received the Dipl.Ing. (M.Sc.) degree in Mechatronics and the Dr. Techn. degree (Ph.D.) in Control Engineering from Johannes Kepler University, Linz, Austria, in 2001 and 2006, respectively. Since March 2006, he has been with Fronius International GmbH, R&D Department Welding Technology, Thalheim, Austria. He is the leader of the welding technology pre-development team. His research work includes the development of sensor systems for spot and arc welding process monitoring and welding process control.
 Andreas Stelzer was born in Haslach an der Mühl, Austria, in 1968. He received his Diploma Engineer degree in Electrical Engineering from the Technical University of Vienna, Vienna, Austria, in 1994, and the Dr. Techn. degree (Ph.D.) in Mechatronics (with sub auspiciis praesidentis rei publicae hons.) from the Johannes Kepler University, Linz, Austria, in 2000. In 2003, he became an Associate Professor with the Institute for Communications Engineering and RF Systems, Johannes Kepler University. Since 2008, he has been a key researcher for the Austrian Center of Competence in Mechatronics (ACCM), where he is responsible for numerous industrial projects. Since 2007, he has been head of the Christian Doppler Laboratory for Integrated Radar Sensors, and since 2011, he is a full Professor at Johannes Kepler University, heading the Department for RF-Systems. He has authored or coauthored over 280 journal and conference papers. His research is focused on microwave sensor systems for industrial and automotive applications, RF and microwave subsystems, surface acoustic wave (SAW) sensor systems and applications, as well as digital signal processing for sensor signal evaluation. Dr. Stelzer is a member of the Austrian ÖVE. He has served as an associate editor for the IEEE MICROWAVE AND WIRELESS COMPONENTS LETTERS. He was the recipient of several awards including the 2008 IEEE Microwave Theory and Techniques Society (IEEE MTT-S), Outstanding Young Engineer Award, and the 2011 IEEE Microwave Prize. Furthermore, he was the recipient of the 2012 European Conference on Antennas and Propagation (EuCAP) Best Measurement Paper Prize, the 2012 Asia Pacific Conference on Antennas and Propagation (APCAP) Best Paper Award, the 2011 German Microwave Conference (GeMiC) Best Paper Award, as well as the EEEfCOM Innovation Award and the European Microwave Association (EuMA) Radar Prize of the European Radar Conference.