I. Introduction
A mixture distribution is the result of combining the distributions of two or more random variables. The distribution of the mixture is observable, and the underlying component distributions may be unobservable or latent. Bodington (Reference Bodington2012) showed in JWE that the relative ranks assigned by wine tasters are heterogeneous and posited that those ranks have a mixture distribution with random, common preference, and idiosyncratic preference mixture components. Cao (Reference Cao2014), also in JWE, applied a mixture model with two components to results for the 2009 California State Fair Commercial Wine Competition. Cao used a transformation of rank assignments, score simulations, and linear regression to estimate the proportion of scores that appeared to be random and the remaining proportion that appeared to reflect consensus among the wine judges.
This article seeks to build on Bodington (Reference Bodington2012) and Cao (Reference Cao2014) in several respects. Assigning relative preference ranks to wines is common and ordinal scores are also sometimes transformed into preference rankings.Footnote 1 Ranked preference and mixture models have been applied to tastings as diverse as soft drinks and salad dressings, and the literature for five applications is summarized in Section II. Next, as a foundation for applying such models to wine-tasting data and so that the results herein are replicable, the results of a blind tasting of Pinot Gris appear in Section III. Then, in Section IV, a mixture of Plackett-Luce rank preference models is derived that yields a multinomial probability mass function (PMF) for each wine in the Pinot Gris tasting. The unknown parameters in the mixture model are estimated in Section V using the expectation maximization (EM) algorithm. The additional benefits of this approach include its direct use of observed tasting data, use of information embedded in the variance of observed data, reliance on the standard EM solution, and its feasibility for the small sample sizes that are typical of wine tastings. The mixture model also yields estimates of the share of ranks that appear to be random and the probability of Type I errors.
Section V ends with a test using hypothetical tasting data that have a known result to show that the model is an accurate predictor of observed densities. Further, a Monte Carlo simulation with random rankings yields confirmatory results and shows that the probability of illusory consensus among tasters, a Type I error, is 0.20. In Section VI, the mixture model is applied to the tasting of Pinot Gris. Results show that, with likelihood ratio tests and t statistics supporting a level of confidence of over 95%, random ranking behavior accounts for approximately 30% of ranks and that there is nonrandom agreement among tasters on a common preference order. Conclusions follow in Section VII.
As noted throughout, this article applies ranking and mixture models to tasting results in which each taster determines an order of preference for the wines in a tasting. Each taster's result is a preference order vector. There are related methods for evaluating tied rankings and ordinal scores that are transformed into ranks, and the application of those methods to wine-tasting results must begin with this starting point.
II. Previous Applications of Rank and Mixture Models to Tasting Data
Ranked preference models are employed widely to express and evaluate comparisons. The models are diverse, Mallows (Reference Mallows1957) is an early article, and Marden (Reference Marden1995) is a widely referenced text. Among many applications, ranking and mixture models are employed to divide heterogeneous agent or “expert” or “judge” behavior into latent components, subpopulations, or classes of agents that express homogeneous behavior (see, e.g., Gormley and Murphy, Reference Gormley and Murphy2008; Marden, Reference Marden1995, p. 133; Mengersen et al., Reference Mengersen, Robert and Titterington2011; and Vigneau et al., Reference Vigneau, Courcoux and Semenou1999). In a few cases, ranking and mixture models have been employed to evaluate taste-related data. Those applications are described below.
First, a notional mixture model for ranked data appears in Equation (1). For a vector of observed preference ranks (x), the PMF for those ranks (f) is the sum of the probabilities (π i ) that an expert belongs to a particular latent class (i with a total of n classes) in which each π i is multiplied by the PMF for that latent class (f i with parameters θ i ). Under Equation (2), the probabilities are bounded and their sum equals unity. The π i are also known as mixing proportions, mixture weights, or component weights.
 $$f\left( {{\rm x}\vert{\rm \pi}, \; {\rm \theta}}\right) = \; \mathop \sum \nolimits_{i = 1}^n \pi_{i}\, f_{i} \left({{\rm x}\vert\; {\rm \theta}_i}\right)$$
 $$1.0 = \mathop \sum \nolimits_{i = 1}^n {\rm \pi}_i \;{\rm and} \; 0 \le \; {\rm \pi}_i \; \le 1.0$$
Critchlow (Reference Critchlow1985) analyzed the preferences of 16 mothers and 22 boys for five types of crackers (Critchlow, Reference Critchlow1985, p. 119; Linacre, Reference Linacre1992, p. 6; Marden, Reference Marden1995, p. 284). In the framework of Equation (1), Critchlow estimated parameters for two classes, both f i (x|θ i ) were Plackett-Luce models, and Critchlow solved for θ using a maximum likelihood estimator (MLE). In Placket-Luce, each unknown parameter in θ is the probability that the respective object will be selected as first or most-preferred among the choices (Marden, Reference Marden1995, pp. 119, 216; Plackett, Reference Plackett1975), and this model also is derived and discussed in Section IV below. To conclude, Critchlow found that the boys' top choice was animal crackers.
Bockenholt (Reference Bockenholt1992) analyzed the preferences of 278 male psychology students for eight different soft drinks. Within Equation (1), Bockenholt estimated parameters for a cola class (Coke Classic, Pepsi, Diet Coke, Diet Pepsi) and a non-cola class (Seven Up, Sprite, Diet Seven Up, Diet Sprite). Both f i (x|θ i ) were Pendergrass-Bradley models, and Bockenholt solved for θ using MLE. He asked tasters to compare drinks in sets of three, and Pendergrass-Bradley is a ranking model for triple comparisons (Pendergrass and Bradley, Reference Pendergrass, Bradley and Olkin1960). Bockenholt found that the students liked Coke Classic the most and Diet Seven Up the least.
Marden (Reference Marden1995), using data from Nombekla et al. (Reference Nombekla, Murphy, Gonyou and Marden1993), analyzed the preferences of six cows for animal feed that was either a control or flavored with sucrose, hydrochloride, urea, or sodium chloride. Each cow's preference for each feed was measured by how much of each feed it ate. In the framework of Equation (1), there was one class of taster, f i (x|θ 1) was the Plackett-Luce model noted above, and Marden solved for θ using MLE. Again, the Plackett-Luce model is derived and discussed in Section IV below. Marden concluded that cows preferred the sucrose-flavored feed the most.
Vigneau et al. (Reference Vigneau, Courcoux and Semenou1999) analyzed the preferences of 56 consumers of seven snacks that differed in cheese flavor and water content. Again using Equation (1), the authors estimated parameters for two latent classes of taster. Both f i (x|θ i ) were Bradley Terry Mallows (BTM) models, and Vigneau et al. solved for θ and π using an EM algorithm. In BTM, each unknown parameter is a numerical expression of relative preference, and, in some cases, BTM can be computationally burdensome (Mallows, Reference Mallows1957; Marden, Reference Marden1995, p. 117). Vigneau found that water content most differentiated the two classes of snack.
Thuesen (Reference Thuesen2007), using data from Critchlow and Fligner (Reference Critchlow and Fligner1991), evaluated 24 tasters' preferences for four types of salad dressing. In the form of Equation (1), Thuesen estimated parameters for two latent classes, both f i (x|θ i ) were BTM models, and Thuesen solved for θ and π using an EM algorithm. The BTM model was summarized above, and Thuesen explains that the results appear odd but does not diagnose and fix a flaw if there is one.
All the evaluations above employed ranking models, and those that considered more than one class of taster employed mixture models. All solved for the unknown parameters using MLE, and those that needed to estimate mixing proportions π used the EM algorithm in which MLE is a step. However, none of the evaluations above addressed an analog to the findings of Ashton (Reference Ashton2012), Cao (Reference Cao2014), Maltman (Reference Maltman2013), Soares et al. (Reference Soares, Sousa, Mateus and de Freitas2012), and others in JWE and elsewhere that some wine tasters, even judges, are just not reliable. None of the five evaluations described above take a priori information about random ranking behavior into account.Footnote 2 In each analysis above, the probability that an agent with random preferences chooses any of the choices is 1/m, where m is the number of choices. The PMF for the random class or mixture component is merely 1/m. The PMF for a latent class with random expressions of preference is thus already known; the only remaining question about that class is its mixing proportion (π r ). If tasting data do not support the existence of such a class then π r =0.
With application to wine tasting, a ranking and mixture model solved using EM is proposed here in Sections IV through V below. This model does include a random class of taster. To structure the analysis and provide a replicable example, we next present data from a tasting of Pinot Gris.
III. Blind Tasting of Pinot Gris
This tasting of Pinot Gris involved six wines and 18 tasters.Footnote 3 Each of the tasters had more than ten years' experience as a wine maker, writer, distributor, collector, or enthusiast.
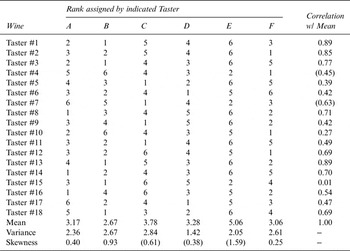
The wines were in brown bags identified only by the letters A through F. Each taster had seven glasses, one for water and the others for the wines. The six wines were poured in a flight, and then tasting began. The protocol was open, meaning that tasters could taste and re-taste in any order before assigning any ranks. Each taster ranked each wine from 1 (most preferred) to 6 (least preferred) and recorded his or her ranks on a score sheet. There was no discussion of the wines until all tasters had completed their score sheets and the results had been tabulated. Neither the tasters nor the person recording the results knew the vintner or price of any wine until all scores had been recorded; the tasting was blind. The ranks assigned by the tasters appear in Table 1.
Pinot Gris Tasting Results

Note: Rank #1 is most preferred, #6 is least.
The mean ranks in the table imply that the preference order is BFADCE. However, the results above are heterogeneous. Variances differ, some ranks skew left, some skew right, some are positively correlated with the mean, and others are the opposite. Many tasters ranked wine E last, and many ranked wine F first or second. Together, these findings imply the possibility of a mixture distribution. There may be a latent class or subpopulation of tasters who have preferences in common. There may also be classes of tasters who exhibit random and idiosyncratic ranking behavior.
IV. Mixture Model of Wine-Tasting Results
For the Pinot Gris results above, the ranks (x) assigned to the corresponding wines A, B, C, … by any one taster (t) for a wine (i) are the rank vector (x t with elements x t, i ) in Equation (3) below. If the corresponding wines are arranged according to their ranks from most- to least-preferred, the result is an order vector (y t with elements y t, j ). For example, the order vector for Taster #1 of Pinot Gris appears in Equation (4). Taster #1 likes wine B the most and wine E the least.
 $${\bi x}_t = (x_{t,1}, \; x_{t,2}, \; x_{t,3}, \; x_{t,4}, \; x_{t,5}, \; x_{t,6} )$$
 $${\bi y}_{t = 1} = (B,\; A,\; F,\; D,\; C,E)$$
For six wines, the order vector in Equation (4) has 6! or 720 permutations. Assuming just three wines with 3! permutations to make an example tractable, the order vector for one taster is one of ABC, ACB, BAC, BCA, CAB, and CBA. Assume further that the probability of ranking wine A first is 0.5, ranking B first is 0.3 and C first is 0.2. On that basis for example, the probability of the order vector CAB appears in Equation (5). As a check, the sum of the probabilities for the six potential order vectors is unity; ABC = 0.300, ACB = 0.200, BAC = 0.214, BCA = 0.086, CAB = 0.125, and CBA = 0.075. The general form appears in Equation (6), and this is the Plackett-Luce model. The probability of a particular preference order for n wines (f(y t | ρ)) is the product of the probabilities that each wine would be ranked first (ρ i for each wine i) where the ρ i have been normalized with the sum of the ρ i of the wines remaining in the taster's order vector. The first denominator and the last quotient will always equal unity. Under Equation (7), the ρ i are bounded, and their sum equals unity.
 $$f\left( {{\bi y}_t = \; CAB} \right) = 0.2/\left( {0.2 + 0.5 + 0.3} \right)\cdot \; 0.5/\left( {0.5 + 0.3} \right)\cdot 0.3/0.3 = 0.125$$
 $$f\left( {{\bi y}_t \vert{\bi \rho}}\right) = \mathop \prod \nolimits_{i = 1}^n \left( {\displaystyle{{\rho _i}\over {\mathop \sum \nolimits_{\,j\; = i}^n \; \left( {\rho_j}\right)}}\bigg\vert{\bi y}_t, {\bi \rho}}\right)$$
 $$0 \le \; \rho _i \; \le 1.0 \; {\rm and} \; 1.0 = \mathop \sum \nolimits_{i = 1}^n \rho_i $$
One purpose of this application is to rank the wines according to the tasters who have preferences in common and thus to divide the population of heterogeneous rankings into a subpopulation of those who appear to express preferences that some tasters have in common. That leaves two other subpopulations: those who exhibit random ranking behavior and those whose preferences appear to be idiosyncratic. Idiosyncratic preferences are those that vary from taster to taster; some prefer oaky Chardonnay while others prefer an austere style, some like more citrus or acid than others, some prefer more tannin in Zinfandel than others, some like more evident fruit in Pinot Noir than others, some like toast in white wines—there are many examples. Those individual preferences are neither random nor held in common. As described in Section II, the PMF for random ranking behavior is already known, and only its mixture weight is unknown. Regarding idiosyncratic preferences, to date, no method exists for statistically identifying rankings that are based on neither common preference nor random-appearing behavior. Consequently, idiosyncratic preferences must account for model error or lack of fit. Note that Bockenholt (Reference Bockenholt1992), Critchlow (Reference Critchlow1985), Marden (Reference Marden1995), Thuesen (Reference Thuesen2007), and Vigneau et al. (Reference Vigneau, Courcoux and Semenou1999) made the same assumption and did not model either random or idiosyncratic classes.
A mixture model with two latent classes of tasters, random tasters (r) and those who express similar preferences (p), appears in Equation (8). In Equation (8), the PMF for the observed order vector (f(y t )) is the weighted sum of the PMFs for the random and preference-based order vectors (f r (y t )) and (f p (y t )) with parameters θ r and θ p ), in which the mixture weights (π r and π p ) are the respective probabilities of the taster's membership in the respective latent class. In Equation (9), the mixture weights are bounded and their sum equals unity.
 $$f\left( {{\bi y}_t \vert \hat{\bi \pi}, \; \hat{\bi \theta}}\right) = \widehat{{\pi_r}} \cdot f_r \left( {{\bi y}_t \vert\widehat{{\theta _r}}}\right)\; + \; \widehat{{\pi _p}} \cdot \; f_p \left( {{\bi y}_t \vert\widehat{{\theta _p}}}\right)$$
 $$1.0 = \widehat{{\pi _r}}+ \widehat{{\pi _p}} \; {\rm and} \; 0 \le \; \widehat{{\pi_{r\; {\rm and}\; p}}} \; \le 1.0$$
Again as explained in Section II, the PMF for random ranks is known. Random tasters assign ranks as if drawing from an urn with six balls labeled #1, #2, and so on, through #6. For any wine, the probability of any rank is 1/6. For any random draw of six wines, the Plackett-Luce model yields a probability of 0.0014, and this is, of course, also 1/6!. Substituting this result and the Plackett-Luce PMF into Equation (8) yields the likelihood function (
 $${\rm {\cal L}}\left( {{\bi y}\vert \hat{\rm \pi}, \; \hat{\rm \theta}} \right)$$
) for the mixture model in Equation (10) with, using conventional notation for mixture model parameters,
 $$\hat{\rm \theta} = \hat{\rm \rho} $$
.
 $${\rm {\cal L}}\left( {{\bi y}\vert \hat {\bi \pi}, \; \hat {\bi \theta}}\right) = \mathop \prod \nolimits_{t = 1}^T \left[ {\widehat{{\pi _r}} \cdot \left( {\displaystyle{1 \over {6!}}} \right)\; + \; (1 - \widehat{{\pi _r}} )\cdot \; \mathop \prod \nolimits_{i = 1}^n \left( {\displaystyle{{\widehat{{\rho _i}}}\over {\mathop \sum \nolimits_{\,j = i}^n \left( {\widehat{{\rho _j}}}\right)}}\bigg\vert{\bi y},\hat {\bi \theta}}\right)} \right]$$
Moving forward, the Plackett-Luce model yields the probability of ending on one branch of a probability tree with n! branches. Using the same tractable three-wine example as above, the multinomial PMF for wine B appears in Equation (11). It shows how the probabilities of the six branches of the probability tree add to yield a PMF, and, as a check, the sum of the probabilities is unity. The general form appears in Equation (12), in which the probability that wine i is ranked l (
 $f_{i,l}^{\prime} \left( {i,l\vert{\bi \rho}} \right)$
) equals the sum of the Plackett-Luce probability for every possible order vector permutation (P with one permutation P
k
) multiplied by unity if a respective order vector has wine i in order l or, if not, multiplied by zero. This is merely the sum of the probabilities for the probability tree branches that have the right wine in the right place. Calculating Equation (12) for each possible rank for each wine yields the n x n matrix of probabilities in Equation (13). In Equation (13), each row is a vector expressing the multinomial PMF for a particular wine, and the sum of each row vector is unity. As an example, results for the three-wine tasting appear at the right in Equation (13).
 $$\eqalign{& For Probability \left( {ABC} \right)= {\it 0.300}, ACB= {\it 0.200}, BAC= {\it 0.214}, \cr & BCA= {\it 0.086}, CAB= {\it 0.125} \; and \; CBA= {\it 0.075}\!\!: \cr & Pr\left( {{\rm rank\; on\; B} = \; 1} \right) = 0 + 0 + 0.214 + 0.086 + 0 + 0 = 0.300 \cr & Pr\left( {{\rm rank\; on\; B} = \; 2} \right) = 0.300 + 0 + 0 + 0 + 0 + 0.075 = 0.375 \cr & Pr\left( {{\rm rank\; on\; B} = \; 3} \right) = 0 + 0.200\; + 0\; + 0\; + 0.125 + 0 = 0.325} $$
 $$\eqalign{& f_{i,l}^{\prime} \left( {i,l\vert{\bf \rho}}\right) \cr & = \mathop \sum \nolimits_{k = 1}^{n!} \left( {\left( {\mathop \prod \nolimits_{i = 1}^n \left( {\displaystyle{{\rho _i}\over {\mathop \sum \nolimits_{\,j\; = i}^n \; \left( {\rho _j}\right)}}} \right)\cdot \left\{ {\matrix{ {1.0\; if\; wine\; i\; has\; rank\; l\;} \cr {0.0\; otherwise\; \;}}} \right.} \right)\bigg\vert{\bf \rho}, \; {\rm P}_k}\right)\;}$$
 $$f^{\prime} \left( {n\vert{\bf \rho}}\right) = \; \left[ {\matrix{ {\,f_{1,1}^{\prime} \left( {1,1\vert{\bf \rho}}\right)} & \ldots & {\,f_{1,n\;}^{\prime} \left( {1,n\vert{\bf \rho}}\right)} \cr \ldots & \ldots & \ldots \cr {\,f_{n,1}^{\prime} \left( {n,1\vert{\bf \rho}}\right)} & \ldots & {\,f_{n,n}^{\prime} \left( {n,n\vert{\bf \rho}}\right)} }} \right] = \; \left[ {\matrix{ {0.500} & {0.339} & {0.161} \cr {0.300} & {0.375} & {0.325} \cr {0.200} & {0.286} & {0.514} }} \right]$$
Building on Equation (13), a mixture model expressing the density of each rank l for each individual wine i appears in Equation (14). The PMF for random ranks is 1/6, and the PMF for common preference assignments is the ith multinomial PMF from Equations (12) and (13). Equation (14) is thus a mixture PMF for each wine that is consistent with the underlying Plackett-Luce probabilities
 $\hat {\rm \rho} $
. Also, for reference, Equation (14) is employed to calculate the mixture model results shown in Figures 2, 3, and 4.
Log Likelihood as EM Iterates

Distribution of Ranks on Wine C

Distribution of Ranks on Wine B

Distribution of Ranks on Wine E

 $$f_{i,l}^{\prime} \left( {i,l\vert\widehat{{\pi _r}}, \; \hat{\bf \rho}}\right) = \widehat{{\pi _r}} \cdot \displaystyle{1 \over 6}\; + (1 - \; \widehat{{\pi _r}} )\cdot \; f_{i,l}^{\prime} \left( {i,l\vert \hat{\bf \rho}}\right)$$
V. Solving for the Unknown Parameters
The EM algorithm is a widely employed method for estimating the unknown parameters in mixture models. An often-cited initial journal reference is Dempster et al. (Reference Dempster, Laird and Rubin1977), McLachlan and Peel (Reference McLachlan and Peel2000) explains EM, and a more recent text is Mengersen et al. (Reference Mengersen, Robert and Titterington2011). In sum, EM begins with exogenous estimates of the unknown parameters and then iteratively climbs to the maximum of a likelihood function. The MATLAB code written by the author for the EM algorithm and integrated MLE employed here is available on request.
Before turning to results for the Pinot Gris tasting, the mixture model and EM solution were subjected to two tests. The first test employed hypothetical data that were selected to yield a known result. The second test employed a Monte Carlo simulation in which tasters assigned their ranks randomly. Both tests yield results that validate the mixture model and EM solution.
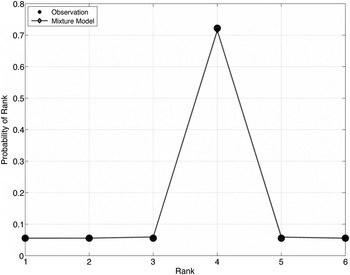
A model should solve to yield an obvious answer, when there is one, so the first test is designed to have an obvious answer. Six hypothetical tasters are assumed to have ranked the wines with (1 2 3 4 5 6), (2 3 4 5 6 1), (3 4 5 6 1 2), and so on. Although those assumed ranks are not random, together, they give each rank on each wine a random expectation. In addition to those six tasters, twelve tasters are assumed to have ranked every wine (2 1 4 3 6 5). Those tasters represent common preference rank assignments by tasters with identical preferences. By design in this simple test, the mixture weight for the random class is thus
 $\widehat{{{\rm \pi} _r}} = \displaystyle{6 \over {18}} = 0.33$
, and the mixture density from Equation (14) for each wine's common-preference rank is thus (0.33)(1/6) + (1–0.33)(1.00) = 0.72.
EM begins with exogenous estimates of the unknown parameters. For the hypothetical tasting data above, the null hypothesis starting parameters were
 $\widehat{{{\rm \pi} _r}} = 1.00$
and
 $\widehat{{{\rm \rho} _i}} = 1/6$
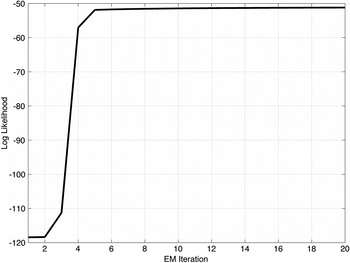
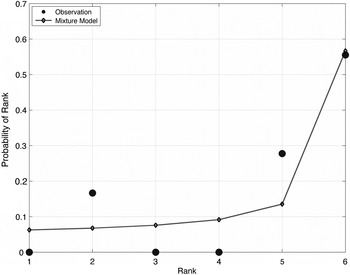
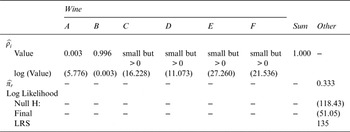
. EM results appear in Figures 1 and 2 and Table 2. Figure 1 shows that the log likelihood does increase monotonically and the EM solution does converge. Using fourth-ranked wine C as an example, Figure 2 shows that the mixture model is an accurate predictor of the observed rank densities. Beginning from null hypothesis initial conditions, Table 2 shows that the EM solution is close to the solution used to design the test data. Except for the most-preferred wine B, as they should be, the estimates of
 $\widehat{{{\rm \rho} _i}} $
are small but in proportions that establish a preference order for the Plackett-Luce PMF. Further, the
 $\widehat{{{\rm \rho} _i}} \; $
in Table 2 imply the correct common preference order (2 1 4 3 6 5 or BADCFE). The likelihood ratio statistic (LRS) is 135, and that value is significant with a chi-square of p < 0.01.Footnote
4
Simple Test Results

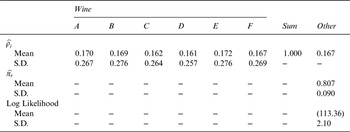
The simple test above employs hypothetical ranks. Next, the mixture model and EM solution were tested with a Monte Carlo simulation. Each taster's ranks for each wine were assigned randomly in each of 1,000 iterations. Results appear in Table 3. As they should be for random rankings, none of the
 $\widehat{{{\rm \rho} _i}} $
are significantly different from 1/6 = 0.167. However, the estimate of the random class mixture weight
 ${\rm \pi} _r $
shows that the probability of illusory common preference agreement, although rankings are actually random, a false positive and Type I error, is approximately 1.000–0.807 = 0.193. Almost 20% of random ranks appear to be based on illusory common preference.
Monte Carlo Simulation Results (1,000 iterations)

The Monte Carlo simulation results quantify a problem evident in the Judgment of Paris and many wine tastings. That problem is sample size. The Judgment involved nine French tasters (see Taber, Reference Taber2004). See also a survey of wine tastings in Hanson (Reference Hanson2013) and the sample sizes for Liquid Assets wine tastings. The Pinot Gris results above involved eighteen tasters and six wines. A simple example with just two wines demonstrates the effect of a small sample size. For two tasters, the observed result is that they agree either that one wine is better or that they differ. If the tasters agree then, the EM solution for
 ${\rm \pi} _r $
will be zero and π
p
will be unity. Even if each taster's preference was determined by the flip of a coin, the EM solution for π
p
is unity when the tasters' flips agree by chance. That is an illusion of common-preference agreement false-positive Type I error, and with only two tasters, the probability that they appear to agree is 0.500. With many coin-flipping tasters, a large sample size, the probability that they all appear to agree tends to zero. In that case, the EM solution for π
p
will also tend to zero, and Type I error vanishes. Wine-tasting sample sizes are small enough that the illusion of common preference agreement is material, and the Monte Carlo simulation quantifies the extent of that illusion. Results above show that the probability of Type I error for 18 tasters and six wines is 0.193. Additional Monte Carlo simulations show that the probability of Type I error is 0.48 for 6 tasters and 0.08 for 72 tasters. Those additional results confirm the downward and asymptotic-to-zero trend in Type I error with sample size.
The findings in Table 2 set a threshold. The hypothesis that observed results are not random must be tested against a null hypothesis defined by the Monte Carlo simulation results. This approach quantifies the possibility of illusory agreement, false-positive Type I error.
VI. Pinot Gris Results
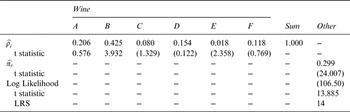
Results for the Pinot Gris tasting appear in Table 4 and Figures 3 and 4. Note that the t statistic for each parameter estimate, based on the corresponding Monte Carlo null hypothesis mean and standard deviation, also appears in Table 4.Footnote 5 The parameter estimates for the most- and least-preferred wines, B and E respectively, are significant at a level of confidence of over 95%. The estimate of the random class mixture weight π r is also significant at a level of confidence of over 95%. In addition, comparing the solution to the random Monte Carlo expectation, the LRS is 14 and significant with a chi-square of p < 0.05.
Pinot Gris Results

First, the
 $\widehat{{\rho _i}} $
in Table 4 make sense. The sum of the
 $\widehat{{\rho _i}} $
sum is unity. Wine B is most preferred according to both
 $\widehat{{\rho _B}} $
and its mean rank in Table 1. Wine E is least preferred according to both
 $\widehat{{\rho _E}} $
and its mean rank in Table 1.
More important, Table 4 yields information about the Pinot Gris tasting results that is not evident in Table 1. The preference order implied by the
 $\widehat{{\rho _i}} $
is BADFCE, and the order implied by ranks in Table 1 is BFADCE. Wines A, F, and D are in different places. This implies that the preference order based on mean ranks in Table 1 is influenced by random assignments and, for example, that wine F is thus an unreliable first or second choice. Next, the aggregate fraction of wine rankings that appear to be random,
 $\widehat{{\pi _r}} $
, in the Pinot Gris tasting is 0.299 or approximately 0.30. Cao (Reference Cao2014) found 0.60 or more for State Fair wine data and, although for an undisclosed consumer product, Cleaver and Wedel (Reference Cleaver and Wedel2001) found a random share of 0.48. Many factors may account for the differences in those results; all of them imply that random-looking expressions of preference are material. Although the fraction of random rank assignments in the Pinot Gris tasting is material, 1 –
 $\widehat{{\pi _r}} = \widehat{{\pi _p}} $
thus the results in Table 4 also show that approximately 70% of observed ranks appear to be based on nonrandom common preference assignments.
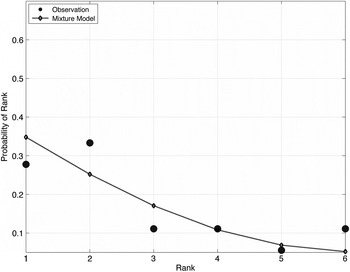
Further, Figures 3 and 4 depict the Equation (14) results for the most and least preferred wines B and E. Figure 3 shows that the mixture model fits between the high-probability first and second ranks that earned wine B the highest preference and then trends to the right and down for ranks that appear to be random or idiosyncratic. Figure 4 shows the reverse, the mixture model results track the random or idiosyncratic ranks at the left and then lift to the higher-probability but low ranks than earned wine E the lowest preference.
VII. Conclusion
Bodington (Reference Bodington2012) posited that observed wine-tasting results have a mixture distribution, and Cao (Reference Cao2014) evaluated California State Fair results using a mixture model. This article extends that work by providing a literature review of previous applications of ranking and mixture models to non–wine-tasting data and then deriving a model for application to observed wine-tasting results. The benefits of the approach include its direct use of observed tasting data, its use of information embedded in the variance of observed data, absence of bias introduced by simulation-based parameters, a multinomial PMF for each wine, reliance on the standard EM solution, feasibility for the small sample sizes typical of wine tastings, quantification of Type I error, and quantification of the share of ranks that appear to be random. An application of the mixture model to results for a blind tasting of Pinot Gris shows, with likelihood ratio tests and t statistics supporting a level of confidence of over 95%, that random ranking behavior accounts for approximately 30% of ranks and that there is nonrandom agreement among approximately 70% of tasters on a common preference order.
This article presents a model with two latent classes of taster, those who appear to have preferences in common and those tasters who appear to rank randomly. Tasters may also have idiosyncratic preferences that account for a lack of fit or unexplained variance and further analysis of those idiosyncratic preferences is work for the future. In addition, this article applied a ranking and mixture model to wine-tasting results for one tasting in which each taster determined an order of preference for the wines in the tasting. Application of ranking and mixture models to other tastings, to results with tied rankings and to ordinal scores must follow.