Introduction
The brain is comprised of complex communication among numerous networks. Several networks are involved in vision processing. The eyes rotate so that objects of visual interest project to the fovea, the portion of the retina, which contains the greatest density of photoreceptors to yield high acuity and resolution. Eye movements (described using oculomotor control) have evolved to solve the difficult task of acquiring visual information quickly and accurately while compensating for processing delays (Semmlow et al., Reference Semmlow, Yuan and Alvarez2002).
A rich body of literature, from single-cell recordings and lesion studies on nonhuman primates to human case reports to eye movement investigations and functional imaging studies, forms our present understanding of the saccade and vergence systems (Leigh & Zee, Reference Leigh and Zee2006). Saccades are conjugate tandem eyes movements. Vergence eye movements are disconjugate to allow depth perception where the eyes move in opposing directions. Recent investigations are emerging which study the subdivisions of functional connectivity of visual processing within functional magnetic resonance imaging (fMRI) studies (Calhoun et al., Reference Calhoun, Adali, McGinty, Pekar, Watson and Pearlson2001a; Dyckman et al., Reference Dyckman, Camchong, Clementz and McDowell2007).
A recent review summarizes the functional imaging studies of saccadic eye movements where a saccade directed to an intended target involves both subcortical (striatum, thalamus, superior colliculus, and cerebellar vermis) and cortical (primary visual, extrastriate, parietal cortices, as well as frontal and supplementary eye fields) structures (McDowell et al., Reference McDowell, Dyckman, Austin and Clementz2008). Several single-cell primate studies of vergence have reported cellular activity evoked by using symmetrical vergence stimuli in the primary visual cortex (Poggio, Reference Poggio1995), the posterior parietal area (Gnadt & Mays, Reference Gnadt and Mays1995; Genovesio & Ferraina, Reference Genovesio and Ferraina2004), the bilateral frontal eye fields (FEF) (Gamlin & Yoon, Reference Gamlin and Yoon2000; Akao et al., Reference Akao, Kurkin, Fukushima and Fukushima2005), the midbrain (Mays, Reference Mays1984; Cumming & Judge, Reference Cumming and Judge1986; Judge & Cumming, Reference Judge and Cumming1986), and the cerebellum, specifically the oculomotor vermis (lobules VI and VII of the declive) (Takagi et al., Reference Takagi, Tamargo and Zee2003; Nitta et al., Reference Nitta, Akao, Kurkin and Fukushima2008), the posterior interposed nucleus (Gamlin et al., Reference Gamlin, Yoon and Zhang1996; Zhang & Gamlin, Reference Zhang and Gamlin1998), and flocculus (Buttner & Waespe, Reference Buttner and Waespe1984). We recently conducted an fMRI human study comparing vergence and saccade movements and reported similar cortical locations in these networks with differentiation in the FEFs (Alvarez et al., Reference Alvarez, Alkan, Gohel, Douglas Ward and Biswal2010a).
fMRI measures metabolic changes and has been reported to be correlated to direct neuronal measurements (Attwell & Iadecola, Reference Attwell and Iadecola2002; Logothetis & Wandell, Reference Logothetis and Wandell2004). Variations in cerebral blood flow, blood volume, and the concentration of deoxyhemoglobin or blood oxygenation levels are the principle parameters that generate the blood oxygenation level-dependent (BOLD) signal acquired during fMRI studies (Bandettini et al., Reference Bandettini, Wong, Hinks, Tikofsky and Hyde1992; Kwong et al., Reference Kwong, Belliveau, Chesler, Goldberg, Weisskoff, Poncelet, Kennedy, Hoppel, Cohen and Turner1992). Most fMRI studies determine what cortical areas are active from a predetermined stimulus-induced task using a conventional general linear model (GLM) analysis.
The GLM assumes prior knowledge of the experimental task. This analysis is routinely used in fMRI studies and its strength is in its simplicity. In addition to showing which areas are involved in an experimental task, some limited inference about connectivity can be made with a GLM (Saad et al., Reference Saad, Ropella, Cox and DeYoe2001, Reference Saad, DeYoe and Ropella2003). Connectivity can be studied by computing which delays of the reference model yield maximum correlation dependent upon the region of interest (ROI), which can imply which site was activated first. Thus, the ROI whose maximum correlation occurred with the shortest delay would be assumed to be activated first and so forth.
However, understanding the complex interaction between sites of functional activity using simply delay shifts may not be insightful about the connectivity between sites. Functional connectivity can also be studied with data-driven methods (Calhoun et al., Reference Calhoun, Liu and Adali2009; Varoquaux et al., Reference Varoquaux, Sadaghiani, Pinel, Kleinschmidt, Poline and Thirion2010). Advances in data-driven image processing algorithms such as independent component analysis (ICA) are being recommended as a means to study the connectivity or organization within networks (McDowell et al., Reference McDowell, Dyckman, Austin and Clementz2008; Calhoun et al., Reference Calhoun, Liu and Adali2009). ICA is a nonlinear multivariate technique that blindly separates the source signal from the mixed data without any prior assumptions of the sources. Similar to principle component analysis (PCA), ICA attempts to maximally decorrelate the sources. However, to achieve statistical independence of sources, information greater than the second-order statistics is needed. The most popular ICA algorithms use maximum likelihood estimation, maximization of information transfer, mutual information minimization, or maximization of non-Gaussianity (Calhoun et al., Reference Calhoun, Liu and Adali2009). ICA has routinely been used to reduce artifacts, but more recently, it is being used to study the functional connectivity within the brain (Calhoun et al., Reference Calhoun, Liu and Adali2009). In applying ICA to vision research, both a study of visual perception (Calhoun et al., Reference Calhoun, Adali, McGinty, Pekar, Watson and Pearlson2001a) and another investigation of saccades (Dyckman et al., Reference Dyckman, Camchong, Clementz and McDowell2007) have reported a frontoparietal component within the visual system, along with other independent components.
The goal of the research presented here is to define task-related independent components of BOLD activation during six different oculomotor experiments (a fixation versus random eye movements tracking task and a more cognitively demanding task of random versus predictive eye movements studying both saccade and vergence responses with two types of targets). The presented stimulus in each case is a standard ON/OFF block design. There are two novel aspects to this research. First, this investigation studies subdivisions within the cortical and subcortical vergence system using a hierarchical ICA. Second, ICA of saccade and vergence task responses has not been investigated when the cerebellum was imaged.
Spatial ICA identifies various voxel groups across the brain, whereas temporal ICA can yield insight into how the underlying BOLD response varies from one ROI to another. We expect significant distinctions between temporal independent components (tIC) signals from ROIs in different spatial independent components (sIC) maps. These differences can be compared using “group-level” tIC signals. Potentially, temporal differences can distinguish higher level cognitive processes. Since previous vision research experiments have identified a frontoparietal sIC during visual perception and saccadic tasks (Calhoun et al., Reference Calhoun, Adali, McGinty, Pekar, Watson and Pearlson2001a; Dyckman et al., Reference Dyckman, Camchong, Clementz and McDowell2007), we hypothesize that a frontoparietal sIC will be present during the vergence and saccade tasks performed within this study. We also hypothesize that additional sIC maps may be derived from ICA. Understanding how visual task-related ROIs are potentially grouped within one sIC, and how others are segregated within different sIC, can enhance our knowledge of what neural resources are shared between systems, as well as what ROIs have greater commonality, or potentially more similar functional activity, within a neural system.
Materials and methods
Subjects
Sixteen volunteers (9F, 7M, and mean age 26 ± 4 years between 22 and 37 years of age) participated in this study. The inclusion criterion for all subjects was normal binocular vision assessed by the Randot Stereopsis test with a fixation disparity of better than 70 s of arc. Stereopsis is the perception of depth from two slightly different projections of the world onto the retinas of the two eyes, which stimulates vergence eye movements. Normal binocular vision was also defined as a near point of convergence less than 10 cm. Near point of convergence is the distance from the subject along midline when an object is reported as diplopic. These methods are explained in detail in another one of our studies (Alvarez et al., Reference Alvarez, Vicci, Alkan, Kim, Gohel, Barrett, Chiaravalloti and Biswal2010b). Subjects had no history of neurological injuries or dysfunctions. Fifteen of the 16 subjects were right handed. Prior to the functional scanning, eye movements were recorded to determine if the subjects understood the task and could perform these tasks with ease. If needed, subjects wore corrective refraction during the experiment. All subjects signed a written informed consent approved by the University of Medicine and Dentistry and New Jersey Institute of Technology Institution Review Boards in accordance with the Declaration of Helsinki.
Materials and apparatus
An infrared (λ = 950 nm) limbus tracking system (model 6500; Skalar Iris, Delft, The Netherlands) with ±25 deg linear range was used to record eye movements prior to the imaging session. A 12-bit digital acquisition hardware card was used (6024 E series; National Instruments, Austin, TX).
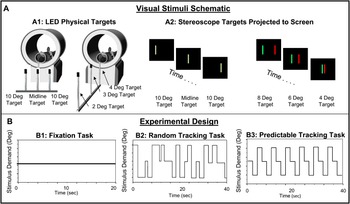
There were two types of visual stimuli used: light emitting diodes (LED) targets and a stereoscope using a projector, which are shown in Fig. 1 Plot A. Three custom nonferrous LEDs were designed to form a line stimulus, 10 cm in height by 2 mm in width to stimulate saccade or vergence movements. Subjects could view targets with the use of a mirror through the bore of the magnet. For saccadic stimulation, the middle LED was centered along the subject’s midline. Subjects would track targets that would appear in one of three locations: 1) 0 deg (midline), 2) 10 deg into the left visual field, or 3) 10 deg into the right visual field. A saccadic magnitude of 10 deg from midline was chosen because saccades less than 15 deg from midline do not evoke head motion (Ciuffreda & Tannen, Reference Ciuffreda and Tannen1995). For vergence stimulation, the three LEDs were rearranged and carefully centered along the subject’s midline, drawn schematically in Fig. 1 Plot A. There were three vergence fixation points (2, 3, and 4 degrees) to produce symmetrical vergence step stimuli. The vergence step stimulus was a 1–2 deg disparity change, which was chosen due to the physical constraints of the imaging center and in order to decrease the occurrence of saccades within the symmetrical vergence response (Coubard & Kapoula, Reference Coubard and Kapoula2008; Semmlow et al., Reference Semmlow, Chen, Pedrono and Alvarez2008; Semmlow et al., Reference Semmlow, Chen, Granger-Donetti and Alvarez2009). To stimulate a greater disparity change of 2– 4 deg, a stereoscope was needed.
Experimental design. Plot A1 shows the schematic of the custom LED targets for saccade and vergence experiments. Plot A2 shows the stereoscope with a single line used for saccade stimulation and a red and a green line viewed with red/green filter glasses to stimulate vergence movements. Three tasks were used in different block designs. One task was fixation (Plot B1) versus random eye movements (Plot B2) using LEDs (experiments 1 and 2). The second task was random tracking (Plot B2) versus predictable eye movements (Plot B3) using LEDs (experiments 3 and 4) and repeated with the stereoscope (experiments 5 and 6).

For the stereoscope, a custom Matlab (Mathworks, Waltham, MA) program was used to generate the saccade and vergence visual stimuli. Examples of the images are drawn in Fig. 1 Plot A. An Liquid Crystal Display (LCD) projector, located near the subject’s head, was utilized with a rear projection screen (Epson, Long Beach, CA) for presentation of the stimuli. A single-line stimulus was used to stimulate saccade eye movements, and two lines were used to stimulate vergence eye movements. To stimulate vergence, red/green filter glasses (Bernell, Mishawaka, IN) were worn during the experiment. The filters were carefully matched to the wavelengths of the red and green lines shown on the computer. This created an environment such that only one eye saw the green stimulus and the other saw the red stimulus. Eye movement recordings of vergence responses confirmed that the subject could perform both the saccade and vergence oculomotor tasks. The subject would fuse the two lines, which stimulated differing amounts of retinal disparity. For the random sequence, the visual target was 4 cm in height by 2 mm in width, and for the predictable sequence, the target was 8 cm in height by 2 mm in width. The change in height gave the subject a visual cue of whether a random or predictable sequence was presented.
Functional and anatomical images were collected on a 3.0 Tesla Siemens Allegra MRI magnetron with a standard head coil (Siemens, Erlangen, Germany).
Experimental design
Six oculomotor experiments were conducted, as summarized in Table 1. Three of the experiments studied saccades (experiments 1, 3, and 5), and three investigated vergence eye movements (experiments 2, 4, and 6). Two types of visual targets were used: a series of LEDs forming a line stimulus and a stereoscope, which also used a line stimulus viewed with red/green filter glasses, shown in Fig. 1A. Two cognitive tasks were utilized for this stimulus-induced experiment. The first task, utilizing only LED targets, studied a fixation gaze (Fig. 1, Plot B1) versus random eye movements (Fig. 1, Plot B2) in a standard block design (experiments 1 and 2). The second task was more cognitively demanding, using random eye movements (Fig. 1, Plot B2) versus predictable eye movements (Fig. 1, Plot B3), also within a standard block design. In this case, both LED targets (experiments 3 and 4) and the stereoscope (experiments 5 and 6) were used. For the saccade experiments, the setup of the LEDs and stereoscope were virtually the same, using a midline target and 10 deg targets either presented in the right or left visual field. For the vergence experiments, the LEDs stimulated a maximum of 2 deg change in disparity due to the physical limits of the imaging center compared to the stereoscope, which we programmed to have a maximum of 4 deg change in disparity.

The primary goal of this present study was to investigate the commonality among several different oculomotor tasks in order to determine whether the shared resources observed in our previous investigations between the vergence and saccade networks during simple (fixation versus random movements), and more cognitively demanding tasks (random versus predictable eye movements) (Alvarez et al., Reference Alvarez, Alkan, Gohel, Douglas Ward and Biswal2010a) would be grouped together into similar spatial maps. Previous investigations (summarized briefly in the discussion) using a conventional GLM combined with a voxel-wise paired t-test have explored the differences between data sets. In addition, our preceding studies showed many ROIs that were common between the vergence and saccade data sets (Alkan et al., Reference Alvarez, Alkan, Gohel, Douglas Ward and Biswal2010; Alvarez et al., Reference Alvarez, Alkan, Gohel, Douglas Ward and Biswal2010aa). Hence, this present research sought to determine if the commonality previously observed between the vergence and saccade data sets, using both a simple fixation versus an eye movement task and a more cognitively demanding task involving prediction, would be segregated into common spatial maps through ICA.
The stereoscope and LED targets stimulated different amounts of accommodation, which produced differences within vergence eye movements (Hung et al., Reference Hung, Semmlow and Ciuffreda1983; Lee et al., Reference Lee, Granger-Donetti, Chang and Alvarez2009; Kim et al., Reference Kim, Granger-Donetti, Vicci and Alvarez2010). We hypothesized that we may be able to identify differences and commonality between these vergence data sets. However, differentiation was not observed and potential reasons are described within the discussion. However, since this current study sought to identify what shared resources would be segregated into similar spatial maps, the stereoscope data were analyzed and, as will be shown, consistent separation was observed.
Subjects confirmed that they were able to comfortably view the visual stimuli during the imaging session. For all experiments, only one location was illuminated at a time. The subjects were asked to perform three types of visual tasks: fixation, random eye movements, or predictable eye movements. The instructions to the subjects were to look at whichever target was illuminated, blinking as necessary but limiting all head motion. Furthermore, an audible cue was given to signal the predictable phase, during which time the subjects were instructed to anticipate the next target.
All experiments utilized a standard block design of 3.5 cycles alternating between fixation versus random or random versus predictable eye movements. Each experiment was repeated in case motion artifacts would present a problem, though, as discussed in the Results section, no problematic motion occurred. The fixation versus random tracking experiment lasted a total of 140 s, with each phase 20 s in duration. The investigation of prediction was more cognitively demanding; hence, the duration of that experiment was longer. The random versus predictable eye movement experiment lasted a total of 280 s, with each phase 40 s in duration.
There were two types of cognitive tasks investigated: fixation versus random eye movements and random versus predictable eye movements. For fixation, the subject was asked to fixate on the midline target located at a 4 deg sustained convergence position for 20 s. This LED was the “near” target for the vergence experiments. When performing eye movements to a random target, each visual stimulus would be present for a random duration of time between 0.5 and 3.0 s. Previous research has shown that subjects were unable to anticipate the random duration of time (Alvarez et al., Reference Alvarez, Bhavsar, Semmlow, Bergen and Pedrono2005). For the saccade experiments, targets would randomly appear in one of three locations: 1) 0 deg (midline), 2) 10 deg into the left visual field, or 3) 10 deg into the right visual field; for vergence, the locations were 2, 3, or 4 deg targets when using the LEDs or 4, 6, and 8 deg targets when using the stereoscope.
The predictable saccadic stimulus would be illuminated along midline, into the right visual field (10 deg from midline), and then in the left visual field (10 deg from midline). The target would remain in each location for 2 s, as shown in Fig. 1 Plot B3. This pattern would repeat six times. For predictable vergence stimuli using LED targets, the experiment began with illumination of the “middle” target of 3 deg, then the “far” target of 2 deg, and then the “near” target of 4 deg. Each target would be illuminated for 2 s, and this pattern would repeat six times. A similar periodicity was used with the stereoscope, but the targets were 4, 6, and 8 deg for the “far,” “middle,” and “near” targets, respectively. A similar periodicity has been used in other behavioral studies to investigate the influence of prediction in vergence eye movements (Krishnan et al., Reference Krishnan, Farazian and Stark1973; Alvarez et al., Reference Alvarez, Semmlow, Yuan and Munoz2002).
Imaging acquisition parameters
The subject positioned himself/herself onto the gantry of the MRI instrumentation and was centered so that his/her head was located in the center of the coil. Each subject’s head was stabilized using foam padding, and ear plugs were provided to protect his/her ears from machine-related noise (30 dB attenuation) while still allowing communication with the subject. The frequency power deposition and field-switching rate were below the Food and Drug Adminstration (FDA) criteria.
A quick scan was obtained and used to localize high-resolution anatomical and functional scans within the magnet. Since the cerebellum was an area of interest in this study, all subjects were positioned so that images could be attained of the whole brain. All functional scans used a T2*-weighted echo planar imaging sequence. The imaging parameters were field of view (FOV) = 220 mm, 64 × 64 matrix, Time of Repetition = 2000 ms, Time of Echo = 27 ms, and flip angle = 90 deg. The whole brain was imaged in an axial configuration where 32 slices were collected and each slice was 5 mm thick. The resolution was 3.4 × 3.4 × 5 mm for all functional imaging scans. There were 70 volumes collected (140 s) for experiments 1 and 2. There were 140 volumes (280 s) for experiments 3 through 6.
Between scans, subjects were asked if they were comfortable and could perform the task. Subjects confirmed they could perform each task with ease. After all functional tasks, a high-resolution magnetization-prepared rapid gradient echo (MPRAGE) data set was collected. The MPRAGE imaging parameters were: 80 slices, FOV = 220 mm, slice thickness = 2 mm, TR = 2000 ms, TE = 4.38 ms, T1 = 900 ms, flip angle = 8 deg, and matrix = 256 × 256, which resulted in a spatial resolution of 0.9 × 0.9 × 2 mm.
ICA
ICA is a blind source separation technique, which extracts statistically independent, underlying spatial or temporal signal sources (Comon, Reference Comon1994; McKeown et al., Reference McKeown, Makeig, Brown, Jung, Kindermann, Bell and Sejnowski1998). ICA assumes the data are a linear mixture of unknown sources, which can be recovered by maximizing statistical independence of components. Although not required, the ICA algorithm for fMRI data sets can begin with a common “prewhitening” technique using PCA to reduce the dimensionality of the data set (Comon, Reference Comon1994; Hyvarinen et al., Reference Hyvarinen, Karhunen and Oja2001). PCA is a second-order statistical technique, compared to ICA, which uses higher order statistics (Calhoun et al., Reference Calhoun, Liu and Adali2009). However, unlike PCA, ICA does not give any information about the relative magnitude (i.e., percentage of variance explained) of the calculated components (Hyvarinen et al., Reference Hyvarinen, Karhunen and Oja2001).
McKeown et al., Reference McKeown, Makeig, Brown, Jung, Kindermann, Bell and Sejnowski1998 showed that ICA was capable of separating fMRI data sets into sICs which were correlated with task-related physiological changes, nontask physiological changes, and artifacts from both human or instrumentation noise. The applications of both spatial and temporal ICA to fMRI have been validated (McKeown et al., Reference McKeown, Makeig, Brown, Jung, Kindermann, Bell and Sejnowski1998; Biswal & Ulmer, Reference Biswal and Ulmer1999).
Conventional fMRI analyses utilize a GLM, which uses the same reference vector for all data sets (i.e., across all subjects). In contrast, ICA is purely a data-driven analysis. Reference vectors obtained from ICA are subject specific (due to intersubject variation such as the hemodynamic response, etc.), even if functional correlations are assumed to be similar across a group. Thus, determining a standardized method to perform a group-level analysis is not a trivial task in this case, and several methods have been employed for group-level ICA (Calhoun et al., Reference Calhoun, Adali, Pearlson and Pekar2001b; Beckmann & Smith, Reference Beckmann and Smith2004; Schmithorst & Brown, Reference Schmithorst and Brown2004; Esposito et al., Reference Esposito, Scarabino, Hyvarinen, Himberg, Formisano, Comani, Tedeschi, Goebel, Seifritz and Di Salle2005; Perlbarg et al., Reference Perlbarg, Bellec, Anton, Pelegrini-Issac, Doyon and Benali2007; Guo & Pagnoni, Reference Guo and Pagnoni2008; Sui et al., Reference Sui, Adali, Pearlson, Yang, Sponheim, White and Calhoun2010; Varoquaux et al., Reference Varoquaux, Sadaghiani, Pinel, Kleinschmidt, Poline and Thirion2010). Here, we have used a hierarchical ICA process to study the commonality and differences of independent components from specific ROIs at a group, as well as at an individual level.
Image processing methodology
Registration and motion correction
All the scans were registered to the fourth image in the data set and motion corrected before analysis using Automated Functional NeuroImaging (AFNI) (Cox, Reference Cox1996). Six parameters (three for planar translation and three for rotation) were monitored to determine if head motion was a problem, and the data sets were inspected for the presence of motion-induced artifacts. Subjects had been instructed to limit head motion, and foam padding was used to further reduce movement. The motion parameters were estimated for the time series set, and for all subjects, movement was not substantial within this study.
Talairach–Tournoux transformation and smoothing
Individual anatomical and functional brain maps were transformed into the standardized Talairach–Tournoux coordinate space (Talairach & Tournoux, Reference Talairach and Tournoux1988). Functional data were spatially low-pass filtered using a Gaussian kernel (6 mm full width half maximum) to account for interindividual anatomical variation (Schmid et al., Reference Schmid, Rees, Frith and Barnes2001; Binder et al., Reference Binder, Liebenthal, Possing, Medler and Ward2004; Lewis et al., Reference Lewis, Brefczynski, Phinney, Janik and DeYoe2005).
Hierarchical ICA process
A hierarchical ICA process has been used previously to study the spatiotemporal components of the BOLD fMRI signal evoked from an auditory task. Seifritz et al., Reference Seifritz, Esposito, Hennel, Mustovic, Neuhoff, Bilecen, Tedeschi, Scheffler and Di Salle2002 first applied spatial independent component analysis (sICA) to individuals and then applied temporal independent component analysis (tICA) to specific ROIs identified from the sICA maps in individuals. The method of analysis in this present study began with an individual subject analysis similar to that of Seifritz et al., Reference Seifritz, Esposito, Hennel, Mustovic, Neuhoff, Bilecen, Tedeschi, Scheffler and Di Salle2002 and was then extended to include a group-level tICA (not performed in the previous study).
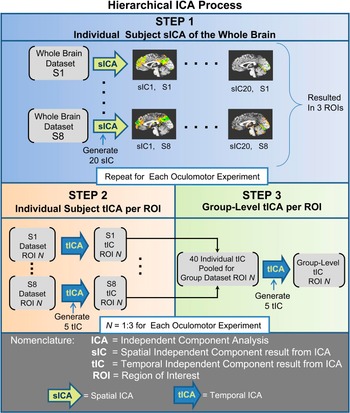
The hierarchical ICA process used in this study to determine the group-level temporal independent components can be divided into three steps. In the first step, “Individual Subject sICA of the Whole Brain” was used to identify task-related ROIs of high significance within individual subjects. Second, an “Individual Subject tICA per ROI” was computed for each subject, finding five tICs within specific ROIs identified in step 1. The third step was a “Group-Level tICA per ROI” in which the five tICs of each individual from step 2 were collected across the eight subjects to form a set of 40 time series (per ROI), from which a new set of five tICs were calculated to represent group-level information. The same set of steps was followed for each of the six oculomotor experiments. An overview of this analysis is shown in Fig. 2.
Hierarchical ICA process (repeated for each oculomotor experiment). Step 1: “Individual Subject sICA of the Whole Brain” was first conducted on the individual data sets, producing 20 sICs from which 3 ROIs of 20 voxels each were determined by visual inspection and z-score criteria. Step 2: “Individual Subject tICA per ROI” started with each 20 voxel ROI identified in Step 1 and produced five tICs per subject per ROI. Step 3: “Group-Level tICA per ROI” collected or pooled the five tICs from all of the eight subjects per ROI from Step 2. These 40 time series were entered into another tICA to generate five group-level tICs per ROI.

In the first step of the image processing, sICA was applied to a voxel time series from the entire brain (Fig. 2, Step 1). The standard Infomax algorithm, available through the software toolbox Group ICA of fMRI Toolbox, was implemented (Calhoun et al., Reference Calhoun, Adali, Pearlson and Pekar2001b). The GIFT software toolbox offers two options for determining the number of components: entering a fixed number to be computed [default is 20 independent components (ICs)] or allowing PCA to determine the number of components that accounts for a specified percent of total variance.
In this study, for consistency across subjects, the former method was selected. Several studies have investigated the influence of the PCA model order choice in fMRI ICA methods (Himberg et al., Reference Himberg, Hyvarinen and Esposito2004; Li et al., Reference Li, Adali and Calhoun2007; Kiviniemi et al., Reference Kiviniemi, Starck, Remes, Long, Nikkinen, Haapea, Veijola, Moilanen, Isohanni, Zang and Tervonen2009), generally recommending between 20 and 60 components depending on the fMRI data set. A different study that used a visual perception task studied 20 components. Twenty components described 99.5% of the total variance in their data set (Calhoun et al., Reference Calhoun, Adali, McGinty, Pekar, Watson and Pearlson2001a). In this study, we chose 20 sICs to account for a large percentage of total variance for individuals (>90% in each case) as well as the intersubject variability.
The primary purpose of the first step was to determine if common task-related functional activity was grouped together as a small number of sICs. All data were visually inspected to determine which spatial maps corresponded to the experimental block design by examining the time series associated with each sIC (through the GIFT toolbox). The results (in detail below) showed that the associated time series of two sICs followed the experimental block diagram across all six oculomotor experiments, consistently revealing activity in three common vision-related regions (the frontal and parietal lobes in one sIC and the cerebellar vermis in the second sIC). Due to the consistency of the spatial maps obtained across the six oculomotor experiments, we sought to investigate the temporal time series from the functional activity within the spatial maps. In each of the three physiological regions from the experimentally related sICs, an ROI was defined by extracting 20 voxels centered on the location of most significant activity, as quantified by the z-scores. Thus, equal-sized and highly significant ROIs from each individual could be entered into tICA in the next step. To determine the significance of activity within each voxel of a sIC, the GIFT toolbox calculated the z-score of voxels in each data set. For each sIC, we used a significance threshold of z-score >2.0 for display in overlays of the high-resolution anatomical image; this will be discussed in the Results section (Fig. 4).
For the second step, (“Individual Subject tICA per ROI,” as shown in Fig. 2, Step 2), tICA was performed using the Fast ICA program (Hyvarinen et al., Reference Hyvarinen, Karhunen and Oja2001; Oja & Yuan, Reference Oja and Yuan2006). In order to choose an appropriate number of tICs to be calculated, we first conducted a PCA of each 20 voxel ROI to calculate how many components were required to account for 90% of the variance. Depending on the subject, between two and five components were needed; hence, we computed five tICs for each ROI. We then validated that the tICA did produce at least one component, which was highly correlated with the pattern of the experimental task inducement. An example of this is given in Fig. 3A, which shows correlation in each of the five tICs of a single ROI with the experimental block design for the eight subjects in an experiment. For each subject, an asterisk marks the component with highest correlation to the block design. An example of the time series is shown in Fig. 3B.
(A) Example of eight subjects’ five tICs shown within each column (from one ROI of one of the oculomotor experiments) correlated with the experimental block design. The r value is denoted by the grayscale. The tIC per subject with highest correlation to the block design is marked with an “*.” The 40 individual tICs are entered into the “Group-Level tICA per ROI.” (B) Examples of tICs from two subjects, which had maximum correlation with the experimental block design.

The third step in our image analysis (Fig. 2, Step 3), “Group-Level tICA per ROI,” takes the collected 40 tICs from step 2 (such as those represented by the matrix in Fig. 3A) as the input data set for another tICA. For each ROI in this step, Fast ICA was again used to calculate five temporal components, which now represent group-level information across subjects to be used in the final analysis.
In summary, the strategy behind this hierarchical process was to specify ROIs involved in the task-activated paradigm first using sICA and then trimming each data set through the use of z-scores. Next, a multistage tICA was used to determine a time series response representing each ROI that most significantly followed the experimental design, first for individual subjects (conventional tICA) and then as a group-level tICA. The novelty of this hierarchical ICA process was in collecting the tICs of individuals produced in Step 2 to form a group-level data set as an input to another tICA for Step 3. The final tICs provided a statistically independent source set from which analysis with group-level statistical power can be made.
Identification of single group-level tIC for each ROI
After the hierarchical ICA process, the data set consisted of five group-level tICs per ROI per oculomotor experiment. For easier comparison, we wanted to determine which of the five group-level ICs was the “most common” when compared to the individual ICs for each oculomotor experiment and had the greatest correlation with the experimental block design. Using the Pearson coefficient (r) within each ROI, the five group-level tICs were correlated with the experimental block design (a square wave), as well as with each of the five individual tICs from each subject. The single group-level tIC, which had the greatest correlation (quantified using the Pearson correlation coefficient, r) with the individual tICs and the block design per ROI per oculomotor experiment, was used to compare the behavioral differences between the ROIs for each experiment. Finally, the group-level tIC with the greatest correlation to the individual subject tIC and the experimental design was filtered with a first-order Butterworth filter using a cutoff frequency of 0.1 Hz, implemented in Matlab.
Results
Before data analysis could begin, motion correction was performed as necessary. Six motion-related parameters were computed and corrected for each subject during each of the scans. The largest average degree of rotation was 0.1 deg ± 0.1 and 0.2 deg ± 0.1 in the pitch direction for the saccade and vergence data sets, respectively. The largest average amount of movement within a plane was 0.3 ± 0.2 mm and 0.3 ± 0.3 mm in the inferior to superior plane for the saccade and vergence data set, respectively. The functional data set resolution was 3.4 × 3.4 × 5 mm; hence, the average motion was much less than a voxel edge length. For our data set, head motion was not problematic; hence, all data were utilized for this analysis.
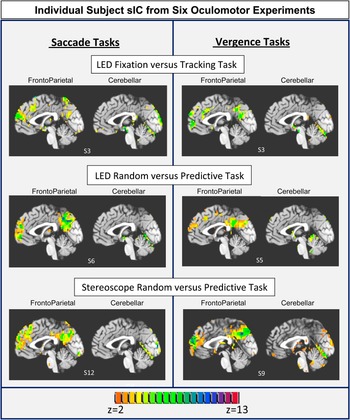
Fig. 4 shows a typical representation of the spatial maps of the two most common sICs, which were observed from the six different oculomotor experiments from Step 1 of the Hierarchical ICA process. The high-resolution anatomical image is shown with the functional overlay (only significant activity with a z-score >2.0) where each experiment type is represented. After careful inspection of the data sets for the six oculomotor experiments, each subject was determined to have shown functional activity in the frontal and parietal areas in one sIC and cerebellar vermis activation in a separate sIC. These time courses associated with these individual sICs followed the experimental task design. The most significant activation (quantified via the z-score) for these two sICs predominantly resided in the midsagittal slice (Talairach Coordinate Left/Right = 0). These two spatial components (frontoparietal and cerebellar) were consistently observed in all subjects for all six oculomotor experiments. The three ROIs (frontal, parietal, and cerebellar areas) in these maps were then investigated with Fast ICA, as described in Steps 2 and 3 of the hierarchical ICA.
Individual subject sICA. Typical representation of one subject’s ICs for each of the six oculomotor experiments. Saccade tasks are shown on the left and vergence tasks are shown on the right. The upper row is from the fixation versus random eye movement experiments stimulated with LED targets (experiments 1 and 2). The middle and bottom row data are from the random versus predictable eye movement experiments stimulated using LED targets (experiments 3 and 4) and the stereoscope (experiments 5 and 6), respectively. A high-resolution anatomical image is shown with functional data overlaid where only functional data with a z-score >2.0 are displayed. For all subjects studied, one sIC contained frontoparietal activation and a separate sIC contained cerebellar activation. Data are from the midsagittal slice (Talairach–Tournoux coordinates L/R = 0 mm).

The Group-Level tICA per ROI (Step 3 from Fig. 2) calculated a total of five tICs for the frontal, parietal, and cerebellar regions for each of the six oculomotor experiments. To identify which group-level tIC showed the most common behavior compared to each individual subject tIC set, a maximum correlation analysis was conducted. All five of the group-level tICs were correlated with the five individual subject tICs from each ROI in each oculomotor experiment. Since there was one set of group-level tICs and eight sets of individual subject tICs, eight maximum correlations were tabulated. Fig. 5 plots the mean of these maximum correlations ± 1 s.d. for each ROI and experiment using the Pearson correlation coefficient r value. The range in maximum correlations between the group-level tICs and individual subject tICs was r = 0.3–0.6, with an average and s.d. of r = 0.41 ± 0.07, r = 0.39 ± 0.05, and r = 0.41 ± 0.12 for the frontal, parietal and cerebellar components, respectively, from the six oculomotor experiments. The mean ± s.d. of maximum correlations between each group-level tIC with the experimental block design were r = 0.51 ± 0.04, r = 0.45 ± 0.08, and r = 0.42 ± 0.08 (range of r = 0.3–0.6) for the frontal, parietal, and cerebellar ROI for the six oculomotor experiments, respectively. Hence, these group-level tICs appear to be highly correlated both among the individual subject’s tICs and with the experimental block design.
Determination of which one of the five group-level tICs from each ROI had the greatest correlation with the five individual subject tICs. The Pearson correlation coefficients (r) are plotted as the average ± 1 s.d. Data from the saccade experiments are shown on the left and from the vergence experiments are shown on the right. The upper row plots are data from the fixation versus random eye movement experiments stimulated using LED targets (experiments 1 and 2). The middle row plots are data from the random versus predictable eye movement experiments stimulated using LED targets (experiments 3 and 4). The bottom row plots are data from the random versus predictable eye movement experiments stimulated using the stereoscope (experiments 5 and 6).

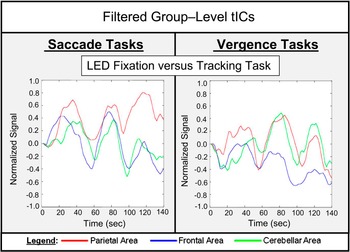
Fig. 6 plots the group-level independent components from the saccade (left plots) and vergence (right plots) fixation versus random eye movement experiments from the parietal (red lines), frontal (blue lines), and cerebellar (green lines) ROIs. One behavioral signal trend observed in these group-level tICs is that the cerebellar initial transient BOLD signal change is delayed in comparison to the initial transient BOLD signal change from the parietal and frontal regions. This could be described as a longer latency for a BOLD signal change in the cerebellum compared to that in the other regions.
Group-level tICs from the parietal (red lines), frontal (blue lines), and cerebellar (green lines) ROIs. The oculomotor task of fixation versus random tracking is shown with the saccade experiment in the left plot and vergence experiment in the right plot.

Discussion
Segregation of sICs
An important finding of this study was that for all six oculomotor experiments, one sIC contained frontoparietal functional activity and a separate sIC contained cerebellar vermis functional activity. The six experiments were composed of two types of cognitive tasks (fixation versus random eye movements and predictable versus random eye movements), studied with two types of eye movements (vergence and saccade eye movements) and two types of visual targets (LEDs and a stereoscope). This consistent segregation of frontoparietal and cerebellar sIC suggests a centrally shared neural resource is utilized within the saccade and vergence networks.
ICA has been conducted in other vision studies, which also report the existence of a frontoparietal sIC. (Calhoun et al., Reference Calhoun, Adali, McGinty, Pekar, Watson and Pearlson2001a; Dyckman et al., Reference Dyckman, Camchong, Clementz and McDowell2007). Dyckman et al. (Reference Dyckman, Camchong, Clementz and McDowell2007) studied three saccadic tasks: 1) fixation versus saccades, 2) fixation versus antisaccades (saccades to a location opposite the target), and 3) saccades versus antisaccades. The study did not image the cerebellum. They reported differentiation in two main components: one component located in the striatum and visual areas and a second in the parietal and frontal regions, with the latter delayed compared to the former. Using a similar visual stimulus of fixation versus saccade protocol, we also report segregation of frontal and parietal activity in a single sIC.
Calhoun et al. (Reference Calhoun, Adali, McGinty, Pekar, Watson and Pearlson2001a) studied a visual perception task, which is a more cognitively demanding task than the simple oculomotor tracking studied in our study. They reported that more regions were functionally active, and more sICs following the block design were observed. Interestingly, their visual perception study reported several components where one sIC contained frontoparietal activity and a second sIC contained cerebellar activity. For our visual tasks, we also report frontoparietal activity in one sIC and cerebellar activity in a separate sIC.
Differentiation in group-level tICs between the ROIs
We utilized a hierarchical ICA process to study group-level tICs in order to determine differences between the components originating from the parietal and frontal ROIs compared to those in the cerebellar ROI. We observed a delayed latency of the initial transient change in the BOLD signal of the cerebellar vermis tIC as compared to the parietal and frontal tICs. These signal variations could stem from differences in the neuronal behavior of the signal, from differentiation in the hemodynamic response due to neurovascular coupling or from a combination of both resulting in differences in the shape or temporal properties of the BOLD ROI specific signals.
Neuronal evidence of shared behavior between the parietal and frontal areas
Differences in neuronal firing rate may be due to differences in the functional connectivity and behaviors of the ROIs. A recent review by Wurtz (Reference Wurtz2008) discusses a potential framework for why the brain perceives stable images when actually a series of snapshots produced by saccadic eye movements is viewed. The aspect of the review most relevant to our research is the discussion of studies in support of a retinotopic hypothesis to explain how the brain may achieve visual stability. Within the frontal and parietal lobes, neurons have been identified which have shifting receptive fields. These neurons are hypothesized to provide anticipatory activity with each saccade and to be driven by a corollary discharge, also referred to as an efference copy (Wurtz, Reference Wurtz2008). Duhamel et al. (Reference Duhamel, Colby and Goldberg1992) showed that neurons in the parietal cortex changed or “shifted” their visual sensitivity in anticipation of the upcoming saccade, a process, which is termed a shifting receptive field. Specifically, single-cell neuronal evidence from nonhuman primates shows that neurons with shifting receptive fields have been reported from the lateral intraparietal (LIP) area (Duhamel et al., Reference Duhamel, Colby and Goldberg1992; Colby et al., Reference Colby, Duhamel and Goldberg1996; Batista et al., Reference Batista, Buneo, Snyder and Andersen1999; Kusunoki & Goldberg, Reference Kusunoki and Goldberg2003), as well as from cells within the FEF (Umeno & Goldberg, Reference Umeno and Goldberg1997, Reference Umeno and Goldberg2001; Sommer & Wurtz, Reference Sommer and Wurtz2006). There is also fMRI evidence for the presence of shifting receptive fields in the parietal area in the human brain (Medendorp et al., Reference Medendorp, Goltz, Vilis and Crawford2003) and within the frontoparietal areas (Merriam et al., Reference Merriam, Genovese and Colby2003, Reference Merriam, Genovese and Colby2007).
With regard to the results of this study, we therefore speculate that the shared shifting receptive field behavior observed in both the LIP and FEF may in part account for segregation of the parietal and frontal functional activity, which is spatially distinct, into a single sIC observed in our individual subjects. The group-level tICs for the parietal and frontal ROIs have similar temporal and behavioral/signal shape properties as well. Analogous research is not available for vergence, but perhaps similar mechanisms are employed since vergence and saccades share many neural network resources.
Neuronal evidence of different timescales for correction of error within the cerebellum
A myriad of information exists on the study of the cerebellar activity within saccadic eye movement research. Saccades reach angular velocities of 500 deg/s for a 20 deg stimulus in humans (Westheimer, Reference Westheimer1954) and have been modeled as a preprogrammed (also termed as a feedforward) system. Yet, the brain accurately guides the eyes to a target potentially through adaptive control (Zee et al., Reference Zee, Yee, Cogan, Robinson and Engel1976; Optican & Robinson, Reference Optican and Robinson1980; Quaia et al., Reference Quaia, Lefevre and Optican1999; Chen-Harris et al., Reference Chen-Harris, Joiner, Ethier, Zee and Shadmehr2008). During the last decade, many investigators studying saccadic eye movements have supported the idea that the cerebellum is utilized for motor learning, as observed via correction of errors through a gain adaptation mechanism (Desmurget et al., Reference Desmurget, Pelisson, Grethe, Alexander, Urquizar, Prablanc and Grafton2000; Ohyama et al., Reference Ohyama, Nores, Medina, Riusech and Mauk2006; Shutoh et al., Reference Shutoh, Ohki, Kitazawa, Itohara and Nagao2006; Thach, Reference Thach2007; Xu-Wilson et al., Reference Xu-Wilson, Chen-Harris, Zee and Shadmehr2009). The adaptive response to errors has been reported to have two or more timescales: a fast timescale that learns substantially from error but has poor retention and a slower timescale that learns little from error but has good retention (Ethier et al., Reference Ethier, Zee and Shadmehr2008).
In this present study, we observed a lag or increased latency in the initial transient behavior of the BOLD response in the cerebellar group-level tICs compared to the frontal and parietal group-level tICs (Fig. 6). As the experiment progressed, the temporal parameters between the three ROIs looked more similar. We therefore speculate that the cerebellar tIC may have an initial lag that diminishes potentially from the reported differences in timescales of motor learning within the cerebellum.
For the six oculomotor experiments, our results consistently isolate the cerebellar activity as a single sIC, which perhaps may arise from the temporal differences observed between the cerebellar group-level tIC and the frontal/parietal group-level tICs. The functionality of the cerebellum (implicated as the region where motor learning occurs via error reduction) may also be distinct from the shared behaviors observed in the frontal/parietal ROIs (implicated to have shared resources to maintain visual stability). These distinct neuronal behaviors may result in different shapes to the BOLD signal and support in part the segregation of the cerebellar from the frontoparietal functional activity within the oculomotor network using ICA.
Neurovascular coupling
Functional MRI provides an indirect neuronal measurement. Our study relied upon the quantification of the local blood oxygen level-dependent contrast; hence, differences in the neurovascular coupling mechanisms could potentially affect our results (Biswal et al., Reference Biswal, Kannurpatti and Rypma2007; Kannurpatti et al., Reference Kannurpatti, Motes, Rypma and Biswal2010). The BOLD signal changes are influenced by vascular factors, including vascular compliance (the tendency of arterial tissue to dilate in response to neural activity) (Harrison et al., Reference Harrison, Harel, Panesar and Mount2002; Iadecola, Reference Iadecola2002) and vascular density (the distribution of the capillary bed density over the cortex) (Huettel & McCarthy, Reference Huettel and McCarthy2001; Harrison et al., Reference Harrison, Harel, Panesar and Mount2002; Windischberger et al., Reference Windischberger, Lamm, Bauer and Moser2002). A recent study suggests that 40% of the variance within the BOLD fMRI signal from the cerebellum and brainstem can be described by the cardiac and respiratory physiologic signals (Diedrichsen et al., Reference Diedrichsen, Verstynen, Schlerf and Wiestler2010). Hence, it may be differences in neurovascular coupling that may in part explain the segregation of frontoparietal activity in one sIC and cerebellar activity into a separate sIC.
Previous studies summarizing differentiation between saccade and vergence data sets
This present research studied the commonality between the vergence and saccade data sets comprised of a simple fixation versus random eye movement task and a more cognitively demanding random versus predictive task using vergence and saccade eye movements. We have previously published detailed investigations in the differences between these data sets using the beta weights from a conventional GLM with a voxel-wise paired t-test. We will briefly summarize those results here for a comparison across methodologies. While our previous analysis showed which areas of activation were common and which were different within the vergence and saccade data sets (Alkan et al., Reference Alvarez, Alkan, Gohel, Douglas Ward and Biswal2010; Alvarez et al., Reference Alvarez, Alkan, Gohel, Douglas Ward and Biswal2010a), a GLM analysis does not reveal statistically independent spatial maps from which to investigate ROIs that may be consistently grouped together. Studying how functional activity that was observed within both the saccade and vergence data sets would be separated into different sIC, and how the temporal properties of the BOLD signal varied between sIC were the goals of this current paper.
Our previous research uncovered that more cortical areas (specifically, the inferior parietal area of Brodmann 39 and the superior ventral–lateral prefontal cortex) were functionally activated when prediction was elicited than when simple fixation versus random tracking tasks were performed (within both vergence and saccade data sets) (Alvarez et al., Reference Alvarez, Alkan, Gohel, Douglas Ward and Biswal2010a). However, during the fixation versus simple random tracking task, significant activation in the brainstem was observed, which was not apparent within the prediction data sets (Alkan et al., Reference Alvarez, Alkan, Gohel, Douglas Ward and Biswal2010) We speculate that this observation is due in part to the nature of the experimental design. For instance, the simple random tracking task data sets used fixation versus eye movements as opposed to the prediction experiments, which used eye movements throughout the experimental design. For the simple random tracking task, we observed activation in the midbrain within the vergence data set but not the saccade data set. In addition, we observed activation in the superior colliculus within the saccade data but not the vergence data. Since these areas were different between data sets, we suspected these regions would not appear within a common spatial map as this present study showed. This paper investigates the spatial maps that were common and suggests shared neural processes between the saccade and vergence neural circuits.
In our preceding studies, differentiation between the vergence and the saccade data sets was also observed within the FEF. The vergence functional activation was immediately adjacent and significantly more anterior compared to the saccade functional activation. Differentiation in FEF was observed in both the random tracking and the prediction data sets (Alkan et al., Reference Alvarez, Alkan, Gohel, Douglas Ward and Biswal2010; Alvarez et al., Reference Alvarez, Alkan, Gohel, Douglas Ward and Biswal2010a). Single-cell recordings from primates have also shown differentiation within FEF where vergence-encoding cells are located immediately anterior to the cells that encode for saccade eye movements (Gamlin & Yoon, Reference Gamlin and Yoon2000). Within this present study, we observed the BOLD signal from the frontal area was similar to that of the parietal area in both the vergence and saccade data sets revealed through the hierarchical ICA algorithm.
The hierarchical ICA algorithm shows that the temporal characteristics of the frontal and parietal ROIs are similar which our previous studies did not investigate. ICA belongs to a class of data-driven analyses that can yield information about similarities between ROIs, which the more conventional general linear models do not necessarily provide.
Vergence eye movements evoked using a stereoscope versus LED targets
Eye movement studies have documented the differences between vergence eye movements with variations in disparity and accommodative stimuli (Hung et al., Reference Hung, Semmlow and Ciuffreda1983; Lee et al., Reference Lee, Granger-Donetti, Chang and Alvarez2009; Kim et al., Reference Kim, Granger-Donetti, Vicci and Alvarez2010). Several types of stimuli were used within these studies to evoke vergence eye movements, which included: visual stimuli observed through a pinhole (no accommodation), a Distribution of Gaussian stimulus (negligible accommodation), stereoscope (constant accommodation), and physical LED targets located at different depths (varying accommodation). The amount of retinal disparity presented within each of these stimuli was the same. These studies showed that accommodative vergence does not influence the initial disparity vergence peak velocity. However, the accommodative vergence component begins approximately 100–200 ms after the latency seen in disparity-driven components as observed through a secondary increase in the s.d. within the velocity responses (Hung et al., Reference Hung, Semmlow and Ciuffreda1983; Lee et al., Reference Lee, Granger-Donetti, Chang and Alvarez2009; Kim et al., Reference Kim, Granger-Donetti, Vicci and Alvarez2010). Hence, observed differences in vergence eye movements are dependent upon the amount of accommodation presented. In addition, single-cell recordings have reported differentiation between accommodative and vergence responses. Within the posterior interposed nucleus of the cerebellum of rhesus monkeys, cells are modulated by disparity and/or blur stimuli eliciting accommodative and vergence responses. There was differentiation between cells where 34 of the 70 modulated activity during just vergence responses and 11 of the 70 modulated activity with accommodation stimuli. The remaining 25 of the 70 modulated their response to both accommodation and disparity movements (Zhang & Gamlin, Reference Zhang and Gamlin1998).
Integrating the results from the eye movement studies and the single-cell primate research, we hypothesized that we may observe differences between the stereoscope and LED data sets. We specifically searched for differences within the cerebellum. We did not observe statistically significant differences between the data sets generated from the stereoscope versus the LED visual stimuli. In the future, we plan to repeat the experiments using a within-subject design and a reduced FOV concentrating on the posterior interposed nucleus. It is unknown if fMRI, even with the reduced FOV, can observe this fine differentiation. Although these two vergence data sets (one evoked using a stereoscope and the other using LED targets) did not show significant differentiation, we did observe similar spatial maps when using sICA, which lends further support of common segregation of ROIs within the vergence and saccade visual circuits.
Summary
This study is the first to report segregation of frontoparietal and cerebellar sICs during a fixation versus random vergence tracking experimental task and during a random versus predictable eye movement task within the saccade and vergence systems using sICA of fMRI data. Our data confirm the finding of a frontoparietal sIC in a fixation versus saccade task reported by Dyckman et al. (Reference Dyckman, Camchong, Clementz and McDowell2007). Our study supports that saccade and vergence eye movements share common functional areas that are segregated into similar sICs suggesting shared central processing between the saccade and vergence neural circuits. The data suggest that the cerebellar tIC has a delayed latency for the initial transient change in the BOLD response compared to the frontal and parietal group-level tICs, which had more similar temporal properties. The differences in signal behaviors observed in the group-level tICs may be due in part to neuronal and/or neurovascular coupling differences, which result in temporal or signal behavioral shape differences of the tIC signal.
Acknowledgment
This research was supported in part by NSF CAREER BES-044713 to T.L.A. and NIH 5R01NS049176 to B.B.B.