1. Introduction
Tailings ponds are used around the world in mining and other industrial processes. They incorporate engineered dam and dyke facilities used for storage of tailings materials, with the long-term objective of enabling water to separate from the tailings and eventual capping/land reclamation. In the case of mined oil sands, the tailings consist of coarse sands, fine clays, silt, water, residual and unrecovered bitumen, naphtha, naphthenic acids, petroleum hydrocarbons and other extraction bi-products. These are deposited in the ponds as they are produced. Coarse sands form beaches upon discharge and some sediment to the pond bottom. Above this forms a gradient ranging from mature fine tailings (MFT) to fluid fine tailings (FFT), topped with a clear water zone. Tailing ponds are thus mostly stratified depthwise, with only slow lateral variations, and evolve over time scales of 1–10 years.
Our study is motivated by the bubble dynamics in oil-sand tailing ponds, as well as in other types of geo-materials. All oil-sand tailing ponds produce carbon dioxide ( $\textrm {CO}_2$) (Small et al. Reference Small, Cho, Hashisho and Ulrich2015). In operations where naphtha has been used as the diluent, anaerobic bio-degradation of naphtha produces both methane (
 $\textrm {CH}_4$) and
 $\textrm {CO}_2$. Similar mechanisms in geological materials, such as shallow marine terrestrial sediments and in some flooded soils, also lead to the formation of
 $\textrm {CO}_2$ and
 $\textrm {CH}_4$ bubbles. These materials are not all transparent, but evidence of bubbles is found by sampling and acoustic measurements (Boudreau Reference Boudreau2012). It has also been observed that bubbles can escape to the overlying water or the atmosphere (Leifer & Boles Reference Leifer and Boles2005; Walter et al. Reference Walter, Zimov, Chanton, Verbyla and Chapin2006). Gas emission is an evident environmental concern. There is also a range of fascinating fluid mechanical questions that arise.
Through the tailings deposition process and regular environmental changes in pressure and temperature (including freezing/thawing), it is clear that ponds undergo slow variations over large spatial (and temporal) scales. On a more local scale, bubble migration creates channel-like connecting conduits in the lower layer of the pond. Images collected from Base Mine Lake clearly show pockmarks on the interface of the water and FFT layer, providing evidence for associated chimneys below (Zhao et al. Reference Zhao, Tedford, Zare and Lawrence2021). They have examined this phenomenon experimentally by injecting bubbles into a two-layer Newtonian-viscoplastic fluid system. They observed that the rising bubbles create a ‘damaged’ pathway through the lower layer, entrain some of the lower fluid into the water layer and that water subsequently flows down the pathway.
The FFT layer has been characterized rheologically as a thixotropic yield stress fluid (Derakhshandeh Reference Derakhshandeh2016). Thus, bubble rise (or trapping) is highly dependent on the yield stress and structure of the material in which bubbles are formed. Formation of ‘damaged’ pathways, with or without water intrusion, makes this layer rheologically non-uniform and challenges predictions that have been made based on uniform fluid properties. Transient bubble motion in a viscoplastic material with spatially varying rheology has not been studied before to our knowledge, and our aim here is explore whether damaged pathways can be modelled in this way. Although we have an industrial and environmental motivation, the study has a much broader relevance. Experimentally, any objects moving through any viscoplastic fluids will leave behind a ‘damaged’ trail. This phenomenon has been observed in a number of studies investigating the motion of bubble in viscoplastic fluids (Dubash & Frigaard Reference Dubash and Frigaard2007; Sikorski, Tabuteau & de Bruyn Reference Sikorski, Tabuteau and de Bruyn2009; Lopez, Naccache & de Souza Mendes Reference Lopez, Naccache and de Souza Mendes2018; Zare & Frigaard Reference Zare and Frigaard2018; Pourzahedi, Zare & Frigaard Reference Pourzahedi, Zare and Frigaard2021). For example, in injecting a sequence of bubbles, subsequent ones follow the same trajectory as the first one and their size reduces and speed increases dramatically (Zare & Frigaard Reference Zare and Frigaard2018), i.e. this is not a negligible effect. Similar effects are found in experiments with settling particles and flows around obstacles.
Perhaps the most relevant studies are those concerning the flow around bubbles in viscoplastic materials. A significant number of fluids used in our daily life (toothpaste, hair gel and peanut butter, tile adhesive,…), as well as working fluids in geophysical and industrial settings, (basaltic lava, cement slurries, drilling fluids,…), are categorized as viscoplastic fluids (Balmforth, Frigaard & Ovarlez Reference Balmforth, Frigaard and Ovarlez2014; Coussot Reference Coussot2017). The key feature of viscoplastic fluids is their yield stress. More precisely if such fluids are subjected to a stress more than their yield stress they deform and flow, otherwise they exhibit a solid-like behaviour. The simplest constitutive law used to describe the behaviour of these materials is the Bingham fluid (Bingham Reference Bingham1922), which in tensorial form is given by
 \begin{gather} \hat{\tau} =\left[\hat{\mu}_p +\frac{\hat{\tau}_Y}{\hat{\dot{\gamma}}}\right]\hat{\dot{\gamma}} \Longleftrightarrow \hat{\tau} > \hat{\tau}_Y, \end{gather}
 \begin{gather}\hat{\dot{\gamma}}=0 \Longleftrightarrow \hat{\tau} \leq \hat{\tau}_Y. \end{gather}
Here,  $\hat {\tau }$ and
 $\hat {\dot {\gamma }}$ are the deviatoric stress and strain rate. The 2 model parameters are the plastic viscosity
 $\hat {\mu }_p$ and the yield stress
 $\hat {\tau }_Y$. The nonlinearity of the effective viscosity makes the prediction of the motion of bubbles in viscoplastic materials non-trivial. Discrimination between yielded and unyielded domains is a priori unknown, as are the yield surfaces delineating the yield domain.
A unique feature of bubbles in viscoplastic material is their entrapment. Bubbles may become entrapped when their buoyancy cannot overcome the resistance resulting from the yield stress of the material. The dependence of the critical bubble volume on the yield stress of the material has been showed in early studies such as Astarita & Apuzzo (Reference Astarita and Apuzzo1965). The authors performed a series of experiments with a range of non-Newtonian fluids and observed a sudden increase in the bubble velocity above a critical volume in viscoplastic fluids. Trapping is associated with the balance between yield stress and the buoyancy stress, captured in the dimensionless yield number  $Y$. The conditions under which bubbles remain static have been formulated using variational principles by Dubash & Frigaard (Reference Dubash and Frigaard2004), with crude estimates also made (Dubash & Frigaard Reference Dubash and Frigaard2007). The authors have found that the shape of bubble has significant effects on the bubble stopping conditions. Stein & Buggisch (Reference Stein and Buggisch2000) examined the stability of bubbles under external pressure oscillation theoretically and experimentally. They initially assume a spherical symmetry around a bubble, which is yielded due to the elasticity of the material, and solve for the flow in that region. Then they calculate the position of the yield surface from the perturbed velocity and stress fields, and finally the drag coefficient.
For computational studies, two techniques have been commonly used to resolve the nonlinearity of the constitutive equation: viscosity regularization and augmented Lagrangian techniques. Tsamopoulos and co-workers (Tsamopoulos et al. Reference Tsamopoulos, Dimakopoulos, Chatzidai, Karapetsas and Pavlidis2008) carried out an extensive computational study of axisymmetric steady bubble rise in a Bingham fluid. Their code was carefully validated for Newtonian fluids against both experimental and computational results. Although not a transient solution, their method iterates on the shape of the bubble using a mapping method until a steady solution is found. A regularization method was used in Tsamopoulos et al. (Reference Tsamopoulos, Dimakopoulos, Chatzidai, Karapetsas and Pavlidis2008). Later, the authors compared their results to those calculated using an augmented Lagrangian method (Dimakopoulos, Pavlidis & Tsamopoulos Reference Dimakopoulos, Pavlidis and Tsamopoulos2013a), finding quite similar results and extending the study to Herschel–Bulkley fluids. Other authors have since computed the transient behaviour of axisymmetric bubbles in Bingham fluids (Tripathi et al. Reference Tripathi, Sahu, Karapetsas and Matar2015; Karapetsas et al. Reference Karapetsas, Photeinos, Dimakopoulos and Tsamopoulos2019). Singh & Denn (Reference Singh and Denn2008) performed transient two-dimensional (2-D) computations for Stokes flows of Bingham fluids around bubbles. They explored entrainment and coalescence phenomena with multiple bubbles, the range of influence of adjacent bubbles and other effects of proximity. Here we also compute 2-D transient flows around bubbles. The choice of 2-D computations may appear strange for bubble motion. Due to the nonlinearity, fully 3-D transient computations are prohibitively expensive, even with regularized viscosity approaches. However, the phenomena we wish to study are asymmetric and the use of axisymmetric codes simply misses the phenomena of interest.
There are discrepancies between experimental and computational studies of bubble rise in viscoplastic fluids. First, there are deficiencies in constitutive laws such as the frequently used Bingham and Herschel–Bulkley yield-stress models. These models have no elasticity and both build-up and breakdown of structure are assumed to be reversible and instantaneous. Secondly, these constitutive deficiencies manifest in observably different behaviours. For example, experimental results show that the initial bubbles injected into a column of viscoplastic fluid tend to ‘damage’ the fluid as the bubble rises. This ‘damage’ manifests as memory (subsequent bubbles are of different size but follow the same path as the first bubble) and as a reduced drag. Plausibly, this is an elastic effect, i.e. resulting from the internal stress history. The effects of history and preferential path on subsequent bubbles are themselves topics of considerable interest, studied in different contexts (Mougin, Magnin & Piau Reference Mougin, Magnin and Piau2012; Lopez et al. Reference Lopez, Naccache and de Souza Mendes2018). Lopez et al. (Reference Lopez, Naccache and de Souza Mendes2018) inserted a rigid rod into the fluid at an angle and manually removed it to create a damaged zone. They then let the fluid rest for 24 h before injecting bubbles. Their results show that bubbles deviate towards the damaged zone and rise along the path of the damaged zone. Both the preferential path experiments and those deliberately creating a damaged path provide significant evidence for how history effects may lead to formation of a non-uniform rheological medium and conduit structures in the lower strata of tailing ponds.
To avoid history effects, many researchers study only the passage of a single bubble through the fluid (typically Carbopol). For example, in Dubash & Frigaard (Reference Dubash and Frigaard2007), the bubble column was emptied, the fluid sheared and the column refilled, i.e. between each bubble. In Sikorski et al. (Reference Sikorski, Tabuteau and de Bruyn2009) the authors report extensively mixing the fluids for a week before their experiments and at times during the experiments. In Lopez et al. (Reference Lopez, Naccache and de Souza Mendes2018) and Wang et al. (Reference Wang, Lou, Sun, Pan, Zhao and Liu2019) the fluid is mixed in situ following each bubble rise. Despite these precautions, there are still discrepancies with the computational results. In particular, experimental bubbles tend to form pointed tails as they rise, which has been attributed to either viscoelasticity or to the injection conditions. In Pourzahedi et al. (Reference Pourzahedi, Zare and Frigaard2021) this phenomenon has been studied using a complex layered structure, through which we are able to eliminate the effects of bubble injection but still find similar bubble shapes. It appears that newer visco-elasto-plastic rheological models may be able to represent this tail feature effectively (J. Tsamopoulos, private communication 2021).
In this study, we investigate the flow field around the bubbles rising in a medium with non-uniform rheology. As discussed above, the non-uniformity can be caused by motion of an object through a viscoplastic fluid, leaving behind a ‘damaged’ path. In tailing ponds, damaged paths are created by the rise of bubbles that are generated by anaerobic bio-degradation of naphtha. The rate of bubble generation varies due to many parameters, such as temperature, pressure and naphtha availability. Hence, the non-uniformity may arise on large length scales or time scales due to operational and/or seasonal variation. Here, we target more local variations such as may correspond to preferential pathways in large expanses of otherwise uniform yield-stress fluid. The notion that these pathways are somehow ‘damaged’ is modelled most simply by assuming that the pathways are Newtonian and of lower viscosity than the effective viscosity of the surrounding yield-stress fluid. Although one could experiment with different models for pathway generation (and/or water invasion of channels), there are many possible approaches and we postpone that complexity.
Here, we start with the simplest representative cases: the motion of a bubble rising in a yield-stress fluid enclosing a conduit of Newtonian fluid. We have investigated the transient shape and the trajectory of bubbles. We look at bubbles initiated within the conduit (e.g. as in a bubble invasion experiment) and also bubble placed off centre (e.g. as a study of proximity effects on bubbles moving or trapped in the FFT). The results are obtained using a combination of computational and experimental methods.
The paper starts by introducing the methodology. The flow equations and description of the numerical algorithms are given in § 2.1. A brief explanation of our experimental procedure is given in § 2.2. Our experiments are presented with the numerical results, to exemplify the different scenarios via proof-of-concept experiments. Benchmark results for the steady-state rise of single bubbles in a Bingham fluid, over a range of Archimedes and Bond numbers are presented in § 3 together with other benchmark results on the numerical algorithm. The main results of our study, focused on three specific scenarios, are presented in § 4 as follows. First, the motion of a bubble initially positioned in a narrow layer of Newtonian fluid surrounded by a yield-stress fluid is investigated in § 4.1. In § 4.2, the trajectory of a bubble placed in the vicinity of a layer of Newtonian fluid in a yield-stress fluid is studied. The rising trajectory of a bubble placed in an angled Newtonian layer crossing a yield-stress fluid is presented in § 4.3. The paper ends with a brief summary of results and conclusions; see § 5.
2. Methodology
Two methodologies are used in this study. First, we compute the motion of 2-D bubbles in a yield-stress fluid with varying rheology. The choice of 2-D computations contradicts the 3-D nature of the phenomena of interest. However, due to the nonlinear behaviour of the fluids, 3-D computations are prohibitively expensive. The 2-D computations allow the study of asymmetrical effects in the flow, that are key. The second method used is experimental.
2.1. Governing equations and computational method
Our main interest is in phenomena that are driven by rheological and buoyancy effects. Our bubble flows are initiated from rest and although the bubble motions may become inertial, the bubble-rise distances of interest are relatively small. Consequently, all fluids are considered incompressible in our study. The flow around a rising bubble is governed by the momentum and mass balances, which are made dimensionless. We scale all lengths with the equivalent radius,  $\hat {R}_b$, of a circular bubble of the same area. We scale velocities with
 $\hat U$, obtained by balancing buoyancy and viscous forces, i.e.
 $\hat U={\hat {\rho }\hat {g}\hat {R}_b^2}/{\hat {\mu }_p}$, where
 $\hat{\rho}$ is the density,
 $\hat {g}$ is the gravitational acceleration (acting in direction
 $\boldsymbol{e}_{\boldsymbol{g}}$), and
 $\hat {\mu }_p$ is the plastic viscosity of the surrounding viscoplastic fluid. Pressure and other stresses are scaled with
 $\hat {\rho }\hat {g}\hat {R}_b$. The scaled momentum and continuity equations are given by
 \begin{gather} \rho Ar [\boldsymbol{u}_t+\boldsymbol{u} \boldsymbol{\cdot} \boldsymbol{\nabla}\boldsymbol{u}]={-}\boldsymbol{\nabla} p + \boldsymbol{\nabla} \boldsymbol{\cdot} \boldsymbol \tau + \frac{k \boldsymbol n \delta_s}{Bo} + \rho \boldsymbol{e_{g}}, \end{gather}
 \begin{gather}\boldsymbol{\nabla} \boldsymbol{\cdot} \boldsymbol u=0, \end{gather}
where  $\boldsymbol u, p, \boldsymbol \tau$ denote the velocity, pressure and deviatoric stress, respectively.
The flow is governed principally by 3 dimensionless numbers. Two of these are the Archimedes number ( $Ar={\hat {\rho }^2\hat {R}_b^3\hat {g}}/{\hat {\mu }_{p}^2}$), and the Bond number, (
 $Bo={\hat {\rho }\hat {g}\hat {R}_b^2}/{\hat {\sigma }_s}$), where
 $\hat {\sigma }_s$ is the surface tension coefficient. A volumetric force formulation has been adopted for the surface tension, and this term appears on the right-hand side of the Navier–Stokes equations, where
 $k$ is the mean curvature,
 $\boldsymbol n$ the normal unit vector and
 $\delta _s$ is a surface Dirac
 $\delta$-function that is non-zero only on the interface. Dimensionally, this term is
 $\hat {\boldsymbol {f}}= \hat {\sigma }_s k \boldsymbol {n} \delta _s$, where
 $\boldsymbol {n} \delta _s$ is approximated from
 $\boldsymbol {\nabla } C$, which is the gradient of volume fraction. In the numerical scheme, this term is evaluated using height functions (Popinet Reference Popinet2009).
The bubble is modelled using a volume of fluid (VoF) method. Equations (2.1) and (2.2) remain valid throughout the flow. In the liquid phase, the scaled density is  $\rho = 1$ and in the bubble
 $\rho = \rho _b \ll 1$. The bubble is also assigned a small constant Newtonian viscosity
 $\hat {\mu }_b$. Thus, the constitutive law within the bubble is
 \begin{equation} \boldsymbol{\tau}(\boldsymbol u)=m_b {\boldsymbol{\dot{\gamma}}}(\boldsymbol{u}), \end{equation}
for  $m_b = \hat {\mu }_b/\hat {\mu }_p \ll 1$, and where
 $\dot {\gamma }(\boldsymbol {u})$ is the strain rate tensor
 \begin{equation} {\boldsymbol{\dot{\gamma}}}(\boldsymbol{u})= \boldsymbol{\nabla} \boldsymbol u +(\boldsymbol{\nabla} \boldsymbol{u})^{\textrm{T}}. \end{equation}
The bubble density is fixed at  $\rho _b = 0.001$. The bubble viscosity ratio
 $m_b$ varies with the selected
 $Ar$, as we consider
 $Ar$ to vary through changing the plastic viscosity. Nevertheless, for all
 $m_b$ studied we have
 $m_b \ll 0.002$.
The liquid phase is a Bingham fluid modelled by
 \begin{equation} \boldsymbol{\tau}(\boldsymbol u)= \left[1+Y\frac{1-\textrm{e}^{{-}N |\dot{\gamma}(\boldsymbol{u})|} }{|{\dot{\gamma}}(\boldsymbol{u})|}\right]{\boldsymbol{\dot{\gamma}}}(\boldsymbol{u}), \end{equation}
where the yield number ( $Y$) is defined as
 \begin{equation} Y=\frac{\hat{\tau}_{Y}}{\hat{R}_b\hat{\rho}\hat{g}}. \end{equation}
Here,  $\hat {\tau }_{Y}$ denotes the yield stress of the Bingham fluid and
 $Y$ represents the competition between yield and buoyancy stresses. Equation (2.5) is a commonly used smooth regularization of the exact Bingham constitutive equation proposed by Papanastasiou (Reference Papanastasiou1987). The regularization parameter
 $N \gg 1$ controls the closeness of approximation to the exact Bingham fluid model:
 $1/N$ represents a small (scaled) strain rate below which the fluid becomes very viscous, i.e. for
 $N |\dot {\gamma }(\boldsymbol {u})| \ll 1$, we find at leading order that (2.5) becomes
 \begin{equation} \boldsymbol{\tau}(\boldsymbol u) \sim NY {\boldsymbol{\dot{\gamma}}}(\boldsymbol{u}) . \end{equation}
In dimensional terms the strain rate and  $1/N$ are scaled with
 $\hat U /\hat {R}_b = \hat {\rho }\hat {g}\hat {R}_b / \hat {\mu }_p$.
Later in our paper we investigate phenomenologically the effects on bubble motion of ‘damage’ to the gel, by considering included regions of purely Newtonian fluid, as in our experiments. Here, the two liquids are also modelled using the VoF formulation. Both are considered miscible as well as iso-dense ( $\rho = 1$). Thus, there is no additional interfacial term required in (2.1). Although miscible, the experimental time scale and length scales are such that the Péclet number between liquids is extremely large and molecular diffusive effects can be neglected, i.e. the VoF model is physically appropriate. Where we have Newtonian liquid in our flows, this is modelled by
 \begin{equation} \boldsymbol{\tau}(\boldsymbol u)=m {\boldsymbol{\dot{\gamma}}}(\boldsymbol{u}), \end{equation}
where the viscosity ratio  $m=\hat {\mu }_N / \hat {\mu }_{p}$, and
 $\hat {\mu }_N$ denotes the viscosity of the Newtonian fluid.
Our simulations are computed in a large rectangular domain ( $100 \times 100$). Boundary conditions for the simulation are no slip on the walls at both the sides and the top of the domain. At the bottom of the domain (
 $y=0$) the pressure is set to zero as is the
 $y$-derivative of the normal velocity. The fluids are initially static. The initial bubble shape is circular and placed in the lower part of the flow domain, away from the boundaries. Within the Bingham fluid significant strain rates are confined to the vicinity of the bubble. These yielded zones are estimated through a series of benchmark computations for different
 $Y$,
 $Ar$ and
 $Bo$; see § 3. The width of the domain is significantly larger than the yielded zone width. The height of the domain is tall enough to allow for transients of interest to be captured.
The VoF method is combined with a quadtree adaptive mesh refinement technique to accurately track the interfaces between the two or three phases. The local mesh refinement densifies the grid in regions of strong spatial variations of the velocity, fluid concentrations and the strain rate  $|\dot {\gamma }(\boldsymbol {u})|$. The algorithm is implemented in the open source multi-phase flow solver Basilisk (based on the algorithms of the former Gerris), which is specifically suited to such applications (Popinet Reference Popinet2003, Reference Popinet2009; Fuster & Popinet Reference Fuster and Popinet2018). The system of equations is resolved using a time-splitting projection method described in Popinet (Reference Popinet2009). A physically motivated maximum timestep is imposed and further controlled via a Courant-Friedrichs-Lewy (CFL) constraint. The velocity advection term is estimated using the Bell–Colella–Glaz second-order upwind scheme at the intermediate timestep. The values of viscosity, density and pressure at the intermediate timestep are also used.
Basilisk uses the interpolation error between a field value at a grid point belonging to a grid level n and its interpolated value from a coarser grid level n-1 as a criterion to either coarsen or refine the grid locally, by merging 4 squares into a parent square or slicing a square into 4 sub-squares in two dimensions, respectively. The grid is refined or coarsened depending on whether this interpolation error is larger or smaller than  $10^{-3}, 10^{-3}, 10^{-9}$ for velocity, concentrations and strain rate, respectively. The domain is initially divided into
 $128 \times 128$ cells. Each of these may subdivided according to the refinement, to a maximum of 9 quadtree levels. Spurious currents are also minimized by using a height function method to estimate the interface curvature. Basilisk has been widely validated against analytical, numerical and experimental interfacial flows. Basilisk is frequently used for Newtonian bubble flow calculations, including flows significantly more challenging than those studied here (Balla et al. Reference Balla, Tripathi, Sahu, Karapetsas and Matar2019; Berny et al. Reference Berny, Deike, Séon and Popinet2020; Zhang et al. Reference Zhang, Dabiri, Chen and You2020).
In benchmarking our code we have experimented with various values of  $N$. For extreme
 $N$ the rapidly changing effective viscosity results in convergence problems, as is often reported. As we increase
 $N > 10^4$ we find only minor changes in the terminal velocity of the computed bubbles; see figure 1, computed for
 $Ar = 50$,
 $Bo = 5$. To explore convergence with respect to
 $N$, we regard the solution at
 $N = 5 \times 10^5$ as the converged numerical solution and compute the relative error of the
 $L^2$ norm of the solution
 \begin{equation} d \lVert U\rVert_{L^2} =\frac{\lVert U_{N=5 \times 10^5} - U_{N}\rVert_{L^2}}{\lVert U_{N=5 \times 10^5}\rVert_{L^2}}, \end{equation}
as  $N$ is increased from
 $N=10^2$, see the inset of figure 1. As the quadtree mesh refinement procedure is automated, it can be slightly different for different
 $N$. Thus, to find the relative error, we have mapped the solution obtained with different values of
 $N$, onto a fixed mesh with constant spatial spacing. For
 $N \geq 3 \times 10^4$ we see that relative error of the velocity field does not change appreciably: the
 $L^2$ norm of the relative error is
 ${\sim } 10^{-3}$. This constant discrepancy is attributed to the interpolation error caused by mapping of data. For the remainder of the computations of the paper we use
 $N = 5 \times 10^4$.
The variation of the magnitude of the bubble-rise terminal velocity calculated with different values of  $N$ for (
 ${\bigcirc}$)
 $Ar=50, Bo=5$, (
 $\square$)
 $Ar=500, Bo=5$, (
 $\triangle$)
 $Ar=1, Bo=50$. The
 $L^2$ norm of deviation of the velocity solutions for
 $Ar=50, Bo=5$ with a range of
 $N$ from the solution with
 $N = 5(10^5)$ is plotted in the inset.

2.2. Experimental set-up and material
A series of experiments have also been performed to visualize the effects of a thin channel of Newtonian liquid on a bubble rising in a column of a viscoplastic fluid. Our experiments are conducted in an acrylic column with height 49.5 cm and width 9.7 cm (square cross-section). In order to introduce the Newtonian fluid, two narrow tubes with inner diameters of 9.7 and 19 mm and outer diameters of 12 and 25.5 mm, respectively were used. We also used a drinking straw with diameter of  ${\sim }5$ mm and negligible wall thickness. In each experiment, the tube of desired size is first placed inside the acrylic box in the desired position/angle and is sealed against the bottom wall of the box. The box is filled with the viscoplastic fluid. Then, water was poured into the tube, dyed to aid in visualization. Finally, the tube has been pulled up slowly from the column. The fluids have similar densities, the viscoplastic fluid is held static by its yield stress and the configuration is observed to remain stable and static during this operation. We then injected bubbles into the column using a syringe pump at a rate of 5 ml min
 $^{-1}$ to start the experiment. The size of bubbles varies in the range 8–18 mm. The apparatus is shown later in the experimental results and described in more detail in Pourzahedi et al. (Reference Pourzahedi, Zare and Frigaard2021).
The motion and shape of bubbles were recorded using a DSLR camera. The results are presented in spatio-temporal images in § 4. These are collated (using the difference between images) to form spatio-temporal figures, shown later. The yield-stress fluid used in our experiments is a 0.15 % wt Carbopol solution, which is widely used as a model viscoplastic fluid for experiments. The flow curve of the material, i.e. the stress–strain rate relation, is measured by a shear stress controlled ramp-up and ramp-down test and is illustrated in figure 2. The material exhibits elastic behaviour below the yield point and shear-thinning behaviour above the yield stress. Thixotropic and viscoelastic effects are minimal at the concentrations that we use, which are fairly typical for bubble propagation experiments (Dubash & Frigaard Reference Dubash and Frigaard2007; Lopez et al. Reference Lopez, Naccache and de Souza Mendes2018; Pourzahedi et al. Reference Pourzahedi, Zare and Frigaard2021). Preparation details are as in Zare & Frigaard (Reference Zare and Frigaard2018).
Flow curves for the Carbopol 0.06 % and 0.15 % solutions are measured by a stress controlled ramp-up and ramp-down test. The triangles and circles denote the data obtained for the Carbopol 0.06 % and 0.15 %, respectively. The fluid properties are found by the Herschel–Bulkley fit as  $\hat {\tau }_{Y}=14.61$ Pa,
 $n=0.39$ and
 $\hat {k}=8.8$ Pa s
 $^n$ for the 0.15 % solution and
 $\hat {\tau }_{Y}=0.2$ Pa,
 $n=0.57$ and
 $\hat {k}=0.39$ Pa s
 $^n$ for the 0.06 % solution.

3. Bubble rise in a Bingham fluid
We first consider the rise of a single 2-D bubble in a Bingham fluid, to establish the reliability of the computational method and provide benchmark results for later researchers. With the exception of Singh & Denn (Reference Singh and Denn2008), who treated non-inertial bubble flows, we have not found results for 2-D bubble motions. Here, we fix  $Y=0.1$, which is below the critical values
 $Y_c$ at which a 2-D bubble is trapped by the yield stress (Chaparian et al. Reference Chaparian, Izbassarov, De Vita, Brandt and Tammisola2020), and we release the bubbles from a circular initial shape. One reason for considering
 $Y < Y_c$ is that the main phenomena of interest for our study are transient. Secondly, the use of a regularization method (2.5) is not ideal for studying the limit
 $Y \to Y_c^-$. Comparisons between solutions computed using regularization and those using a (slower but more accurate) augmented Lagrangian algorithm have been made by Dimakopoulos, Pavlidis & Tsamopoulos (Reference Dimakopoulos, Pavlidis and Tsamopoulos2013b) for axisymmetric bubble computations.
Our bubbles are initially static and released with a circular shape. They rise and deform, eventually reaching a steady terminal velocity ( $U_{t}$) and shape. We study a range of
 $Ar$ and
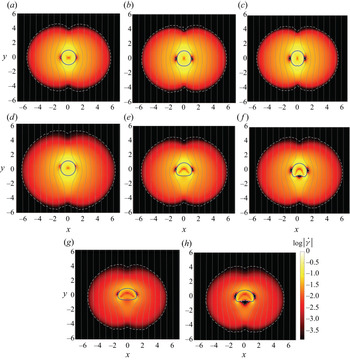
 $Bo$, presenting the results at the final steady-state condition in figure 3. In these figures we plot the bubble shape, the streamlines and the contour of the yield criterion. The latter is defined as the level set of
 $|\dot {\gamma }(\boldsymbol {u})|$, for which
 $|\tau (|\dot {\gamma }(\boldsymbol {u})|)| = Y$. The shaded colour maps present
 $\log |\dot {\gamma }(\boldsymbol {u})|$. As expected, our results confirm that the flow around the bubble is limited to within a yielded region of fluid. The size and shape of the yield surfaces as well as the bubble deformation depend on
 $Ar$ and
 $Bo$. The steady-state shape and the computed terminal velocity
 $U_t$ and other numerical values are tabulated in table 1.
Map of Steady flow field and bubble shapes in a Bingham fluid ( $Y=0.1$) as a function of the Bond and Archimedes numbers; (a)
 $Ar=1, Bo=0.01$, (b)
 $Ar=1, Bo=5$, (c)
 $Ar=1, Bo=50$, (d)
 $Ar=50, Bo=0.01$, (e)
 $Ar=50, Bo=5$, (f)
 $Ar=50, Bo=50$, (g)
 $Ar=500, Bo=5$, (h)
 $Ar=500, Bo=50$. The blue line represents the bubble interface. The contours represent
 $\log |\dot \gamma |$, while the streamlines and the yield surfaces are plotted with grey lines and white dashed lines, respectively. The parameters used for numerical simulations and quantified results regarding the shape and terminal velocity of the bubble are given in table 1.

The viscosity ratio ( $m_b$), terminal velocity (
 $U_{t}$) and aspect ratio of bubble (
 $AR=\text {height/width}$), for cases shown in figure 3, are listed here. Terminal velocities with
 $(^*)$ are obtained based on the augmented Lagrangian method (described in Chaparian et al. Reference Chaparian, Izbassarov, De Vita, Brandt and Tammisola2020) and are reported here for the sake of comparison with our numerical results. Note that in all of these simulations, the yield number is
 $Y=0.1$, the regularization parameter is fixed at
 $N=5(10^4)$ and the density ratio is
 $\rho _{b}=0.001$.

For larger  $Ar$, the role of inertia is more significant and the yield surfaces are not fore–aft symmetric. As
 $Bo$ increases, the surface tension is not large enough to retain the shape of the bubble as circular. At small
 $Ar$, the bubble elongates along its axis of gravity and takes an elliptical shape (see figure 3c), while at larger
 $Ar$, the bubble is deformed to a more oblate shape under the effect of inertia. Our computational results at low
 $Ar$ resemble the shapes of the non-inertial bubbles computed by Singh & Denn (Reference Singh and Denn2008). For the larger
 $Ar$ and
 $Bo$, a region of low strain rate appears at its rear. The bubble is eventually flattened at its rear and a quasi-triangular unyielded wake region forms at its rear (figures 3(g) and 3(h)), the size of which increases with
 $Ar$. A further interesting point is that the strain rate vanishes close to the bubble equator, which in almost all cases leads to the formation of unyielded ‘ears’ attached to the sides of bubbles. Similar features are observed in Singh & Denn (Reference Singh and Denn2008) and Chaparian et al. (Reference Chaparian, Izbassarov, De Vita, Brandt and Tammisola2020). Qualitatively, the range of shapes and the parametric changes are similar to those in previous computations of axisymmetric bubbles (Tsamopoulos et al. Reference Tsamopoulos, Dimakopoulos, Chatzidai, Karapetsas and Pavlidis2008; Dimakopoulos et al. Reference Dimakopoulos, Pavlidis and Tsamopoulos2013b; Tripathi & Sahu Reference Tripathi and Sahu2018).
Our computations retain left–right symmetry and evolve smoothly towards the steady shape, suggesting stability. This process also appears to be stable with respect to the initial conditions. In figure 4 we show the evolution of a bubble for  $Ar=1, Bo=5, Y=0.1$, in which an initial inverted teardrop shape is assumed. As observed the bubble evolves to the same steady shape of an initially circular bubble; see figure 4(b). Recent experiments using a system of layered fluids have also found that the terminal shape and velocity in a yield-stress fluid layer are not strongly dependent on the initial bubble configuration (Pourzahedi et al. Reference Pourzahedi, Zare and Frigaard2021).
Evolution of shape of a bubble and flow field around it as it rises in a Bingham fluid. The bubble initially has an inverse teardrop shape. The results are obtained for  $Ar=1, Bo=5, Y=0.1$, at (a)
 $t=1$, (b)
 $t=5$, (c)
 $t=60$. The contours and lines are defined the same as those plotted in figure 3.

Lastly, we have benchmarked our numerical algorithm by comparing our results for steady-state rising bubbles with those obtained from a steady-state augmented Lagrangian based algorithm. The augmented Lagrangian method provides more accurate computation of the yield surface, but has only been implemented for steady flows. Briefly, we extract the terminal bubble shape from our transient computations and use this interface for a steady-state computation. Thus essentially, the comparison is between resolution of the regularized Bingham–Navier–Stokes system (in a converged steady flow) and a non-regularized Bingham–Navier–Stokes system, for the same interface geometry. The comparison is made directly in figure 5 for two different cases, showing both results in both (a) and (b) of the same figure. The discrepancies are mainly in the position of the yield surface away from the bubble surface and the differences are quite similar to those for axisymmetric bubbles computed in Dimakopoulos et al. (Reference Dimakopoulos, Pavlidis and Tsamopoulos2013b). In addition, the terminal velocity obtained based on these two models differs by less than five per cent.
Comparison between results obtained from a steady-state augmented Lagrangian method (Chaparian et al. Reference Chaparian, Izbassarov, De Vita, Brandt and Tammisola2020)  $(i)$, and those obtained from our numerical simulations
 $(ii)$ , for (a)
 $Ar=1, Bo=50, Y=0.1$, and (b)
 $Ar=50, Bo=5, Y=0.1$. The contours and lines are defined the same as those plotted in figure 3.

4. Results
We explore three different set-ups in which bubble rise in a viscoplastic fluid is affected by the presence of a thin channel of Newtonian fluid. This is motivated by the scenarios discussed in § 1 and by different observations. First, gas invasion or bubble-rise experiments through yield-stress fluids, such as in Zare & Frigaard (Reference Zare and Frigaard2018) and Pourzahedi et al. (Reference Pourzahedi, Zare and Frigaard2021), characteristically affects the rheology of the fluid in the vicinity of where the first bubbles pass. Typically, successive bubbles follow an identical vertical pathway where the fluid has been sheared by the previous bubbles. Although undoubtedly the result of elasticity or thixotropy, a simple model for the history effect of the prior bubble passage is to assume that the yield stress of the fluid has been ‘damaged’.
A second more direct analogy comes from the development of entrained water channels within a gel layer, as observed by Zhao et al. (Reference Zhao, Tedford, Zare, Frigaard and Lawrence2019), when bubbles exit a gelled layer into an overlaying water layer. Although more direct, the precise mechanisms underlying this phenomenon are not yet understood. Thus, we use the Newtonian layer as a proxy for a ‘damaged’ yield-stress fluid layer.
4.1. Bubble rise in an embedded Newtonian layer
To explore the effect of a ‘damaged’ yield stress on bubble motion we consider a thin vertical layer of Newtonian fluid surrounded by a yield-stress fluid. The bubble is initially circular and positioned at the centre of the Newtonian layer, with all fluids at rest. The viscosity ratio is fixed at  $m=1$ so that we investigate the elimination of yield-stress and shear-thinning effects within a local channel.
We present results for  $Ar=50, Bo=5$ and
 $Y=0.1$ in figure 6. The thickness
 $L$ of the Newtonian channel is the initial bubble radius,
 $L=1$. The flow contours, yield surfaces and the streamlines for
 $Ar=50, Bo=5, Y=0.1$ at
 $t=50$ and
 $t=350$ are illustrated. The flow field is plotted in terms of contours of
 $\log |\dot \gamma |$, with the lower bound for the colour scale equal to the critical value of shear rate at which the yield stress is attained for the scaled Bingham–Papanastasiou model. Streamlines are also shown as solid lines with grey colour and the yield surface with a broken line.
Flow around a bubble rising in a layer of Newtonian fluid, with thickness of  $L=1$, surrounded by a Bingham fluid. The results were obtained for
 $Ar=50, Bo=5, Y=0.1$ at
 $t=0,50,350$, from (a) to (b). Terminal velocity and aspect ratio are
 $U_t=0.08$ and
 $AR=0.7$, respectively. The contours and lines are defined the same as those plotted in figure 3.

The bubble deforms from its initially circular shape into a chestnut shape. As the bubble rises, a film of viscous fluid drains around the bubble and, over time, the bubble rises entirely within the Newtonian layer. The viscous Newtonian layer apparently provides a lower dissipation path than the surrounding yield-stress fluid for the bubble. The terminal velocity of the bubble,  $U_t=0.08$, is higher than that of the bubble in a uniform Bingham fluid, (
 $U_t=0.06$) and lower than that of the bubble in a uniform Newtonian fluid
 $U_t = 0.126$.
Interestingly, on comparing the size of yielded region with that obtained for a bubble in a uniform Bingham fluid at the same parameters (figure 3e), we see that a larger area of the Bingham fluid has been yielded here. This appears to be counter-intuitive from the perspective of lubrication, i.e. as the less viscous Newtonian layer might be thought of as localizing the strain rates and hence confining the stress: apparently this does not happen. The larger stress field is presumably the result of the higher velocity of the bubble and consequently higher shear rate at the interface of the two liquids, compared with the air–viscoplastic fluid interface.
The other effect observed is on the bubble shape. Figure 7 shows shapes of the steady bubble rise in a uniform Newtonian, uniform Bingham fluid and in the Newtonian layer, which have aspect ratios  $AR=0.28, 0.84, 0.7$, respectively. The bubble deforms more in the Newtonian layer than in the uniform Bingham fluid, but the far field Bingham fluid still acts to constrain the deformation. We see that the shape is very different from the bubble in a uniform Newtonian fluid.


In studying the steady bubble rise in § 3, we found that the buoyancy force is not enough to yield the fluid surrounding the bubble at  $Y =0.25$ for
 $Ar=50,\ Bo=5$, i.e. the bubble is trapped. Large
 $Bo > 1$ suggests that surface tension is not important and we may compare
 $Y =0.25$ with the exact critical yield number for a circular bubble with no surface tension (
 $Y_c=0.171$), as computed in Chaparian & Tammisola (Reference Chaparian and Tammisola2020). Here, however, we find that if the bubble is surrounded partly by the Newtonian fluid channel it may escape and move up. Figure 8 shows the flow field around the bubble for
 $Ar=50,\ Bo=5,\ Y=0.25$.
Flow around a bubble rising in a layer of a Newtonian fluid, with thickness of  $L=1$, surrounded by a Bingham fluid. The results were obtained for
 $Ar=50, Bo=5, Y=0.25$ at
 $t=0,125,200,450$, from (a) to (c). Terminal velocity and aspect ratio of the bubble at the steady-state condition are
 $U_t=0.05$ and
 $AR=1.346$, respectively. The contours and lines are defined the same as those plotted in figure 3.

Interestingly, during the initial time steps, the bubble deforms and elongates in order to fit into the Newtonian layer. The shape of bubble in figure 8 is quite different from figure 6, although the buoyancy and surface tensions are the same. By increasing  $Y$, the bubble gets more elongated within the Newtonian layer and its aspect ratio increases. This is effectively due to the higher yield stress of the surrounding fluid constraining the deformation of the Newtonian channel. Consequently, we find a smaller yielded zone around the viscous layer. It is expected that by increasing
 $Y \to \infty$, the interface between the viscous and yield-stress fluids effectively becomes rigid. In this case the bubble must deform by initially shrinking and elongating so that it may move upwards in the Newtonian channel.
For a bubble rising in a capillary tube/channel, capillary blockage can occur when surface tension effects dominate. Here, due to the modest  $Bo$, the bubble is able to change shape and migrate. However, by reducing the width
 $L$ of the embedded channel from
 $L=1$ progressively down to
 $L=0.5$ it becomes progressively difficult for the buoyancy to overcome capillary effects, the terminal velocity reduces and we find that, for a layer width
 $L=0.5$, the bubble does not rise, at least within the accuracy of our numerical scheme. The terminal velocities calculated, together with the terminal bubble shape, are plotted against
 $L$ in figure 9.
The variation of terminal velocity (a) and shape of bubble (b) rising in a Newtonian layer, with thickness of  $L = 0.6, 0.7,0.8,0.9, 1$ for
 $Bo=5$ and thickness of
 $L = 0.5$ for (
 $\blacklozenge$)
 $Bo=50$ and (
 $\bullet$, cyan)
 $Bo=10$, surrounded by a Bingham fluid. The results are obtained for
 $Ar=50, Y=0.25$.

In order to alleviate the capillary blockage at  $L=0.5$, we increase
 $Bo$ (at fixed
 $Ar$ and
 $Y$). As
 $Y$ is fixed, this corresponds to a reduced surface tension. The bubble becomes more elongated along the Newtonian layer and the terminal velocity drops. A qualitative comparison between the stress fields obtained for these two cases suggests that the size of the yielded region decreases by increasing
 $Bo$. The higher terminal velocity and longer bubble in
 $Bo=50$ results in a lower drag coefficient in comparison with that of
 $Bo=10$. The recirculation zone behind the bubble makes an indentation at the lower side of bubble for
 $Bo=50$.
4.2. Effects of an offset Newtonian layer
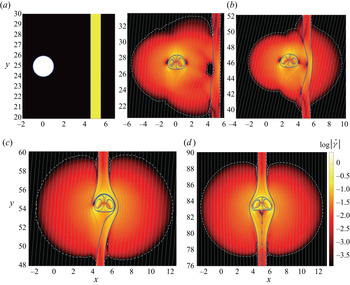
The second scenario that we consider is the effect of the Newtonian layer on bubbles that are nearby. In the industrial context, does the presence of the Newtonian channel affect the stability or movement of distant bubbles? We have investigated this scenario computationally for  $Ar=50,\ Bo=5,\ Y=0.1$ and again in a Newtonian layer of width
 $L=1$. The bubble is initially positioned in the yield-stress fluid at a centre-to-centre distance of,
 $\varLambda =5$. As observed in figure 3(e), the width of the yielded envelope around a single bubble in a uniform yield-stress fluid (for
 $Ar=50,\ Bo=5,\ Y=0.1$) extends to
 $x \approx \pm 5$. Therefore, we expect that the bubble will ‘feel’ the Newtonian layer at its periphery.
The flow field and streamlines are shown in figure 10 at various times. The bubble initially deforms to a shape close to that of figure 3(e), but migrates laterally towards the Newtonian layer as it rises. Evidently the bubble senses the Newtonian layer via the stress field. The images show the approach and encapsulation of the bubble within the Newtonian layer. During the approach the Newtonian layer is deformed/squeezed. The fluid to the right of the channel is initially unaffected but yields as the bubble approaches. Finally the bubble rises vertically in the Newtonian layer as in figure 6, where  $\varLambda = 0$.
Flow around a rising bubble initially positioned in the yield stress fluid at a centre-to-centre distance of,  $\varLambda =5$, to a Newtonian layer. The results were obtained for
 $Ar=50, Bo=5, Y=0.1$ at
 $t=0,50,400,550,900$, from (a) to (d). Terminal velocity and aspect ratio of the bubble at the steady-state condition are
 $U_t=0.08$ and
 $AR=0.7$, respectively. The contours and lines are defined the same as those plotted in figure 3.

A related question to the effect of the Newtonian layer is the effect of other bubbles on both stability and motion. This has been studied by Singh & Denn (Reference Singh and Denn2008), who show that, for sufficiently large spacing, two bubbles of a size that would individually be stable do not feel each other and remain trapped. Similar effects are found for trapped buoyant particles. Therefore, we question whether by extending  $\varLambda$ we reach a critical distance beyond which there is no influence of the Newtonian layer on the bubble motion.
We have computed the bubble motion for Newtonian layers placed at  $\varLambda =5,7.5,10,12.5,15$. We show the trajectory of the bubble centre in figure 11. It is expected that the bubble rises without deviating toward the Newtonian layer for
 $\varLambda >5$, and this does happen for
 $\varLambda = 12.5, 15$. However, the results show that the bubble moves significantly towards the Newtonian channel at
 $\varLambda =7.5$, and there is a very marginal effect at
 $\varLambda =10$. Precise determination of a critical offset distance is difficult with the Bingham–Papanastasiou regularization, since the low shear rate flows are modelled as very viscous Newtonian flows, for which the stress decays very slowly with distance and the Newtonian channel must always induce a slight asymmetry in the ‘unyielded’ flow field around the bubble.
Trajectories of a bubble rising through a Bingham fluid which encompasses a thin vertical layer of a Newtonian fluid. The bubble is initially positioned at a distance of  $\varLambda = 5, 7.5, 10, 12.5$ from the viscous layer. The dimensionless parameters are fixed at
 $Ar=50, Bo=5, Y=0.1$.

4.2.1. Illustrative experiments
We have performed a series of illustrative experiments with the methodology described in § 2.2. The purpose of the first series of experiments is to visualize the motion of a bubble injected into a column of Carbopol in which a vertical channel of reduced viscosity has been placed. The channel is either water or a lower concentration of Carbopol. Three experiments have been performed for this case and the results are shown in figure 12.
Spatio-temporal images of bubble motion in a fluid column consisting of Carbopol 0.15 % and a (a) 12 mm tube of water (dyed blue); (b) 25.5 mm tube of water (dyed green); (c) 25.5 mm tube of Carbopol 0.06 % (dyed green). The results are obtained from experiments.

In the first experiment, a narrow water tube (with a diameter of  ${\sim }12\ \textrm {mm}$) is inserted within the column of 0.15 %-Carbopol and near the right wall of the tank. The bubble starts to rise in a vertical path without ‘feeling’ the water channel. We speculate that the yielded envelope around the bubble does not extend to the viscous channel, hence the bubble path is unaffected by the water channel. Indeed strangely we observe that the bubble path becomes slightly deviated toward the left side of the column; see figure 12(a). The Carbopol column is filled slowly using a funnel and, in all the experiments, its neck has been positioned on the left side of the column. This may produce a mild history effect from residual stresses of the filling process.
In the second test, we have placed a wider water tube (outer diameter 25.5 mm) on the right side of the column and have injected a significantly larger bubble than in the first experiment. We observe that bubble starts immediately to drift to the right side and enters the less viscous green fluid; see figure 12(b). A plausible explanation is that the yielded region is now larger and overlaps with the Newtonian channel. The resulting stress field affects the symmetry of the flow and the bubble drifts toward the water tube. We note the significant change in bubble shape on entering the water channel.
We have repeated the second experiment by placing a lower Carbopol concentration, 0.06 %, instead of water in the column of Carbopol 0.15 %. The spatio-temporal plot of the injected bubble motion is shown in figure 12(c). Again, the bubble moves into the less viscous channel. We note that the bubble is smaller than in figure 12(b) but released a similar lateral distance away ( $\varLambda$ in our computations). It is noticeable that the bubble enters the less viscous channel lower down than in figure 12(b). The smaller bubble does have smaller vertical velocity component, which might allow more time for the lateral propagation. We note that this scenario is of interest in the context of a large expanse of gelled fluid (e.g. a tailing pond) in which local rheology variations are quite natural, e.g. due to aging, different deposits and different settling history.
The main discrepancy between the experimental and computational results shown, apart from dimensionality, is in the shape of the bubble rising in Carbopol. The bubble develops a pointed shape at its lower end in Carbopol which markedly contradicts behaviour observed in the computational results. The inverted teardrop shape is likely due to the elasticity of the Carbopol, which is not present in the Bingham model that has been used in this study. The tail is not always present, e.g. it has been shown that bubbles do not develop a tail in yield-stress fluids at high  $Ar$ (Lopez et al. Reference Lopez, Naccache and de Souza Mendes2018; Pourzahedi et al. Reference Pourzahedi, Zare and Frigaard2021). In this context, we note that the bubble in Carbopol 0.06 % looks similar to the bubble in the water tube and loses its tail, see figures 12(b) and 12(c). A slightly different feature of experiments vs computations is that the surface tension of yield stress fluids is not always easily measured and is not readily variable, i.e. we do not typically study wide ranges of
 $Bo$ independent from other parameters.
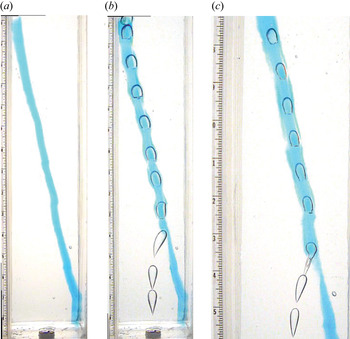
We have further investigated the shape of bubbles in a viscous channel surrounded by a yield-stress fluid. Based on our computational results, we expect that the bubble becomes elongated in a narrow viscous layer; see figure 9. To explore this we have positioned a narrow water tube (outer diameter 5 mm) near to the injection point, inside our column of Carbopol of concentration 0.15 %; see figure 13(a). The spatio-temporal images of the injected bubble as it rises through the column are shown in figure 13(b). As observed, the bubble immediately after detachment deviates toward the water channel. It becomes encapsulated in the Newtonian channel, the shape elongates and loses its tail. The shape near the top of the column is qualitatively similar to the bubbles in figure 9: prolate with a flat lower side. The volume of bubble in this experiment is  $2065\pm 110\ \textrm {mm}^3$ and its rise velocity in the Newtonian tube is
 $544.8 \pm 27\ \textrm {mm}\ \textrm {s}^{-1}$. This velocity is almost two times larger than the terminal velocity of a bubble with the same size rising in a large expanse of water, following the relation of Davies & Taylor (Reference Davies and Taylor1950). Probably, the confinement to the tube reduces the drag on the bubble, i.e. due to having a smaller frontal area.
Experimental results obtained for a bubble rising inside a 5 mm tube of water (dyed blue) enclosed by Carbopol 0.15 %. The layout of the fluid column is shown in (a). The spatio-temporal images of the motion of the first and a subsequent bubble are shown in (b) and (c), respectively.

As successive bubbles are injected, they also orient towards the position of the water conduit. As observed by Zhao et al. (Reference Zhao, Tedford, Zare and Lawrence2021), each bubble pushes water up to the free surface. As a result, the lower part of the water conduit is depleted and contains only sheared Carbopol. Bubbles follow the same ‘damaged’ or low resistance path. However, now the bubble shape does not change at the lower depths (angular tail) until it begins to enter the water column from below, after which the blunted prolate shape is again attained; see figure 13(c).
4.3. Angled layers
We now consider the effects of angled layers. Apart from the possibility of water entrainment, other formation mechanisms are plausible. First, as we have seen above, bubbles will move laterally towards a Newtonian channel in their migration. Each such migration leaves an angled pathway that will be remembered in the gel, and potentially influence adjacent bubbles. Thus, over time in the setting of a large expanse of gelled fluid, we may envision networks of angled ‘damaged’ pathways leading towards the same vertical channel through the gel. Secondly, again in the context of a large expanse of gelled fluid, we might expect external factors such as freezing/melting, additional deposition of tailings, etc. to induce stresses/strains in the static gel at many different alignments.
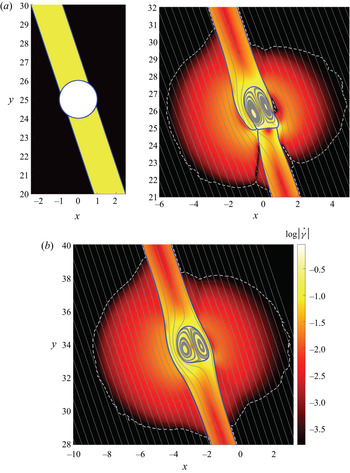
An example of a computation for  $Ar=50,\ Bo=5,\ Y=0.25$ is shown in figure 14. Here,
 $L = 0.95$ and the layer has been angled at
 $\theta =72.5^\circ$ (from horizontal). As discussed in the previous section, at this
 $Y$ the bubble cannot rise in the pure yield-stress fluid, but it does rise along a vertical Newtonian layer by adjusting its shape slightly. Here, we see that in the angled layer the bubble also rises, but evidently an asymmetric velocity field is generated. The bubble moves closer to the upper side of the layer, as might be expected. The Newtonian fluid that is displaced around the bubble thus moves predominantly around the lower side of the bubble. This has the interesting effect of a larger yielded region in the viscoplastic fluid on the lower side of the Newtonian layer.
The flow and motion of a rising bubble in a viscous layer crossing a yield-stress fluid at  $\theta =72.5^\circ$. The results were obtained for
 $Ar=50, Bo=5, Y=0.25$ at
 $t=0, 45, 200$, from (a) to (b). The terminal speed of the bubble is
 $U_t=0.055$. The contours and lines are defined the same as those plotted in figure 3.

It is evident that there is a competition between buoyancy and the yield stress in keeping the bubble within the Newtonian layer. The trajectory of bubbles for a range of  $Y$ values are plotted in figure 15 for
 $Ar=50, Bo=5$ and at the same angle. At
 $Y =0.25$ and
 $Y =0.2$, the buoyancy is not big enough to push the bubble vertically outside the Newtonian channel; instead, it rises along the inclined channel where there is less resistance. By decreasing the yield number to
 $Y=0.1$, buoyancy is able to move the bubble trajectory partly above the Newtonian layer. Interestingly, the bubble still propagates parallel to the Newtonian layer!
Trajectory of bubbles placed inside an angled layer of viscous fluid ( $\theta =72.5^\circ$) which is crossing the domain of a yield-stress fluid. The same computational scenario as explained in figure 14 was repeated here for different values of
 $Bo$ and
 $Y$, as indicated.

Decreasing the surface tension (increasing  $Bo$), affects the shape change but the bubble still propagates within the Newtonian layer at
 $Y=0.2, 0.25$; see figure 15. In all of these cases, the Newtonian viscosity is the same as the plastic viscosity of the viscoplastic fluid,
 $m=1$. By increasing
 $m$, we increase the resistance of the Newtonian layer and the bubble rises outside of the angled layer (for
 $Y=0.1$). In figure 15 we see that the Newtonian layer still exerts a considerable effect on the trajectory. Curiously, the bubble trajectory deviates linearly from that of the channel over the range computed. Presumably, this linear deviation is local and once sufficiently distant from the Newtonian layer the rise trajectory will become vertical.
Whereas, at  $Y=0.25$, in the absence of a Newtonian layer the bubble would be trapped in the viscoplastic, the same is not true at
 $Y=0.1$. The bubble trajectory for
 $Ar=50, Bo=5, Y=0.1$ in figure 15 is thus non-trivial in moving partially outside the Newtonian layer. We explore this delicate balance more in figure 16, where we consider the effects of different angled Newtonian layers on the motion.
Spatio-temporal images of bubble rise in a tilted viscous layer crossing a yield-stress fluid. The variation of shape and trajectory of bubble with the angle of viscous layer (from horizontal) is shown here. The dimensionless flow parameters are fixed at  $Ar=50, Bo=5, Y=0.1$.

The results show that, for  $\theta \geq 60^\circ$, the bubble rises in the Newtonian layer, albeit partly extending outside. For smaller
 $\theta$, the contribution of buoyancy component, perpendicular to the Newtonian layer, becomes more significant and moves the bubble out of the Newtonian layer. However, since the Newtonian layer still affects the stress field, the flow around the bubble is asymmetric and the bubble still deviates from the vertical direction.
We illustrate similar behaviour experimentally. In this experiment, a tube of blue coloured water with outer diameter of 12 mm is placed in our column of Carbopol 0.15 %, at an angle  $\theta \approx 74^\circ$; figure 17(a). Figure 17(b) shows the passage of the first bubble. Interestingly, the bubble rises up and ‘feels’ the Newtonian channel, changes its path and initially moves to the right. As it enters the water channel, it re-routes and follows the angled path. As with the computations, the bubble is oriented to the upper side of the tube, due to buoyancy. In figure 17(c) we show the spatio-temporal images of a subsequent bubble.
Experimental results obtained for a bubble rising in a yield-stress fluid that encompasses a tilted Newtonian channel. (a) The layout of the fluid column: a tube of blue dyed water (with outer diameter of 12 mm) is placed in Carbopol 0.15 %, at an angle of  $\theta =73.6^\circ$; (b,c) spatio-temporal images of the first bubble and a subsequent bubble rising through domain.

Whereas figure 15 explores the influence of inclined layers on mobile bubbles (i.e.  $Y=0.1<Y_c$), such as might be created by prior bubble motion, lower in a tailing pond other mechanisms might be present. For example, temperature, atmospheric pressure or geomechanical stresses may induce faults/crevices within the FFT/MFT channels, or close to the interface with coarse sand, into which less viscous liquids may be squeezed. Thus, channels with slowly varying near horizontal inclinations may interconnect laterally. In figure 18 we show migration of bubbles laterally along such channels, computed for
 $Ar=50,\ Bo=5,\ Y=0.25$ with a Newtonian layer angled at
 $\theta =10$ and
 $20^\circ$. The larger
 $Y$ confines the bubble to within the channel. Conceptually, such channel networks provide a means for smaller bubbles generated deep in the sediment to migrate and accumulate in a way that may eventually yield the surrounding fluid.
Spatio-temporal images of bubble rise in a tilted viscous layer crossing a yield-stress fluid. The dimensionless flow parameters are fixed at  $Ar=50,\ Bo=5,\ Y=0.25$.

5. Summary
When successive bubbles migrate through a yield-stress fluid they preferentially follow the pathway of previous bubbles. Conceptually at least, the stresses induced by the preceding bubbles result in rheological changes within the fluid (whether via elasticity or thixotropy), such that the resistance of the fluid is reduced. These ‘damaged’ pathways are believed to be very relevant to the mechanisms by which gas bubbles can be released from oil-sand tailing ponds and other geological materials, such as shallow marine terrestrial sediments and some flooded soils.
Here, we have ignored the damage mechanism and modelled the preferential pathway by considering a Newtonian fluid conduit embedded within a viscoplastic main phase. Bubbles released centrally within the channel migrate upwards along the Newtonian channel. The Newtonian fluid flows down and around the bubble as it rises, deforming the surrounding viscoplastic fluid. The terminal bubble shapes are different than in either a pure Newtonian or pure viscoplastic fluid column. For increased yield stress the outer viscoplastic deforms less. The bubble may still propagate at yield-stress values for which it would be trapped in a pure viscoplastic fluid column. As the width of the Newtonian channel is decreased, the bubbles elongate. We find a critical width below which capillary blockage occurs, i.e. there is a second trapping mechanism.
Next, we explored the effects of damaged pathways on bubbles that are relatively close but positioned fully within the viscoplastic fluid. Bubbles moving alone in a viscoplastic fluid cause it to yield only within a finite envelope. We find that the influence of the stress field extends significantly further than this yielded envelope. Bubbles feel the Newtonian channel and migrate towards it. In the context of a broad region of dispersed similar bubbles in a tailing pond, this conjures the image of a network of pathways converging into nearby chimneys extending deep into the pond. This localization is both worrying, from the perspective that bubbles migrate/release easier, and promotes optimism from the perspective of controlling emissions. If the objective is to purge the pond of gas, a converging network is ideal. If the objective is to retain gas in the pond, disrupting/blocking chimneys or localized remixing are methods worth exploring.
In the last section of results we explored the effects of path inclination on preferential migration. The main observation is that, even for strongly inclined pathways, the influence is strong. While the pathways due to prior bubbles and attraction of nearby bubbles are close to vertical, we can imagine that larger scale pond gradients, e.g. due to tailing deposit operations, freezing/thawing, pond depth variations, etc. may all result in stress defects and hence preferential pathways oriented closer to horizontal. We have not yet fully explored the effects of such pathways, but results such as figure 18 are enticing.
Methodologically, our computations have used a VoF implementation within the Basilisk adaptive framework. The bubble surface is tracked effectively and many other authors have used this code for a range of bubble flows. Although there are other ways to track the interface, we feel this aspect is perfectly adequate for the flows considered. We have developed benchmark results for single bubbles and explored convergence with respect to the parameter  $N$. Whether the regularization approach is adequate for all the flows one could consider is a different question. For example, in studying the effects of channel proximity on adjacent bubbles, the low shear rates deliver a very viscous fluid for which the stress decays slowly. Computations using the augmented Lagrangian method do deliver yielded regions outside of which there is no flow and would be better suited to giving definitive answers to some of the questions studied, albeit at additional computational cost.
The experiments illustrate clearly that the phenomena we study do actually occur, motivating further study by either method. Longer-term future directions include attempting to model the initial preferential path formation using more complete rheological models.
Funding
This research was made possible by collaborative research funding from NSERC and COSIA/IOSI (project numbers CRDPJ 537806-18 and IOSI Project 2018-10). Experimental infrastructure was partly funded by the Canada Foundation for Innovation and the BC Knowledge Development Fund, grant number CFI JELF 36069. This funding is gratefully acknowledged. This computational research was also enabled by infrastructure provided from Compute Canada/Calcul Canada (www.computecanada.ca).
Declaration of interests
The authors report no conflict of interest.