Introduction
A large literature has examined the personality antecedents of criminal and/or antisocial behavior (Krueger et al. Reference Krueger, Schmutte, Caspi, Moffitt, Campbell and Silva1994; Miller & Lynam, Reference Miller and Lynam2001; Jones et al. Reference Jones, Miller and Lynam2011; Yu et al. Reference Yu, Geddes and Fazel2012; Morizot, Reference Morizot, Morizot and Kazemian2015). In a recent thorough review, Morizot (Reference Morizot, Morizot and Kazemian2015) noted the wide diversity of personality traits associated with risk for criminal and antisocial behavior including extraversion (+), neuroticism (+), agreeableness (−), conscientiousness (−), psychoticism (+), disinhibition (+), effortful-control (−), irritability (+), impulsivity (+) and callousness (+). For example, in the Pittsburgh Youth Study extraversion was shown to predict higher risk for delinquency while agreeableness, conscientiousness and openness predicted a lower risk (John et al. Reference John, Caspi, Robins, Moffitt and Stouthamer-Loeber1994). Pratt & Cullen (Reference Pratt and Cullen2000) conducted a meta-analysis of 21 empirical studies examining the effects of self-control on criminal offending and concluded that, in spite of measurement differences across studies, self-control has a significant effect on criminal offending and related behaviors. Traits reflective of social competence may reduce risk for criminal behavior (CB) (Clausen, Reference Clausen1993; Stouthamer-Loeber et al. Reference Stouthamer-Loeber, Loeber, Wei, Farrington and Wikstrom2002; Epstein et al. Reference Epstein, Renk, Duhig, Bosco and Phares2004). Morizot also reviewed the limited evidence that certain personality traits might predispose to specific subtypes of CB such as the relationship between low self-control and violent offences (Morizot, Reference Morizot, Morizot and Kazemian2015).
Given the strength of the association between personality and CB, it is important to gain insight into its causes. One useful approach is multivariate twin studies which can decompose the sources of correlation of two traits such as personality and CB into its genetic and environmental components. While twin studies have examined personality and various measures of aggression or psychopathy (e.g. Bezdjian et al. Reference Bezdjian, Tuvblad, Raine and Baker2011), we are aware of only one prior study that has examined the association between personality measures and registered CB (Kendler et al. Reference Kendler, Patrick, Larsson, Gardner and Lichtenstein2013).
As part of the evaluation for military service attended by 95% of Swedish males at the ages of 18–20 years (years 1969–2008), a trained psychologist rated individuals on the basis of a personal structured, standardized interview, a range of available records (such as school grades and prior test results) and certain predefined sections (experiences from school, work experiences, leisure time, home environment and emotional stability). On the basis of these scales, every individual was graded on a nine-point scale, with higher values indicating better functioning. The main purpose of this test, according to military authorities, was to predict an individual's ability to cope with stressful situations such as those that might occur in combat. In previous publications, this scale has been referred to as ‘stress susceptibility’ (Nilsson et al. Reference Nilsson, Nyberg and Ostergren2001), ‘psychological functioning’ (Nilsson et al. Reference Nilsson, Nilsson, Ostergren and Rasmussen2004), and ‘psychological strength’ (PS) (Leboeuf-Yde et al. Reference Leboeuf-Yde, Larsen, Ahlstrand and Volinn2006). We here adopt the latter term.
The goal of this report was to clarify the magnitude and nature of the association between PS and CB in a national sample of Swedish males. We examine total CB and two severe CB subtypes: violent CB and recurrent CB (defined as five or more lifetime registrations). We first examine, in a subset of the sample available to us, the association between five assessed traits (social maturity, interest, psychological energy, home, and emotional control) and lifetime CB using logistic regression. Second, we explore the association between PS and lifetime CB using logistic regression in our entire sample. Third, we examine, using Cox models, the predictive relationship between PS and first registration for these forms of CB. Fourth, we perform a univariate twin analysis for PS. Fifth, we explore bivariate twin models for PS and CB to determine the degree to which the PS–CB associations result from common genetic v. environmental factors.
Method
We linked nationwide Swedish registers via the unique 10-digit identification number assigned at birth or immigration to all Swedish residents. The identification number was replaced by a serial number to ensure anonymity. The following sources were used to create our dataset: the Total Population Register, containing data such as year of birth, sex, and annual data on place of residences; the Swedish Mortality Register, containing dates of death; the Twin Register, including information of known zygosity; the Crime Register, containing information on all convictions in lower court from 1973 to 2011; and the Swedish Conscription Register including information of the evaluation from 1969 to 2008.
Sample
We included all males in the conscription register with a valid assessment of PS between the ages of 17 and 25 years. From the Swedish Twin Registry, we selected all twin pairs with birth years from 1958 to 1991 with known zygosity and a registration in the conscript register. This resulted in 2507 monozygotic (MZ) and 2244 dizygotic (DZ) twin pairs and more than 80%, 2357 of the MZ and 2193 of the DZ pairs, had a valid PS assessment in both twins. The birth years were selected to agree with previously published twin analyses on CB (Kendler et al. Reference Kendler, Maes, Lönn, Morris, Lichtenstein, Sundquist and Sundquist2015). As detailed elsewhere (Lichtenstein et al. Reference Lichtenstein, de Faire, Floderus, Svartengren, Svedberg and Pedersen2002), zygosity in the same-sex pairs from the twin registry was assigned using standard self-report items from mailed questionnaires which, when validated against biological markers, were 95–99% accurate. This is an indirect screening for level of cooperation because at least one of the pair had to return a questionnaire to the twin registry and cooperation was lower in subjects with CB; thus the prevalence is lower in this group.
Measures
Our measure of CB was taken from officially recorded data on criminal convictions. Therefore, our measure of CB is biased toward the most severe types of offending and does not reflect criminal offending that goes undetected by the criminal justice system. For the purposes of simplicity, we refer to criminal convictions as CB throughout this paper.
We assessed total CB and two subtypes. Violent CB was defined by the following criminal conviction types: (aggravated) assault, illegal threats, intimidation and illegal coercion, threats or violence against a police officer, (aggravated) robbery, murder, manslaughter or filicide, kidnapping, arson, sexual crimes (excluding prostitution and the buying of sexual services but including child pornography). For the exact law and chapters see Kendler et al. (Reference Kendler, Larsson Lönn, Morris, Sundquist, Långström and Sundquist2014). Recurrent CB was defined as having five or more independent registrations in the criminal registry. When more than one criminal action is registered at the same date, this is counted as one crime. For the analyses based on time to event we used the date of the first crime and fifth crime, respectively. In the case of a missing date of a crime, this is replaced by the date of conviction.
PS is designed to measure the ability to cope with psychologically stressful situations and is assessed on a 1 to 9 graded scale corresponding to a categorized normal distribution centered at 5. The PS score is assigned by a psychologist who conducts with every conscript a semi-structured conversation that average 20–25 min. The psychologists conducting the interview are specially trained and their performance does not vary from region to region, because training is conducted nationally. The interview is in a free form in which the conscript describes his everyday life. There are five predefined sections (experiences from school, work experiences, leisure time, home environment, and emotional stability) though the order can vary. Background information such as school grades, job experiences and test results are provided to the interviewer in advance.
From conscription examinations only from the years 1969–1970, the registry also provided us with five single items, measuring social maturity, interest, psychological energy, home, and emotional control, on a 1–5 scale. These five items were included as a part of the assessment procedure for PS during 1969–1970. Each category corresponds to a categorized normal distribution.
The Swedish army has collected data validating the predictive power of the PS scale (Carlstedt, Reference Carlstedt1999). It strongly predicted quality of military performance in both enlisted men and officers in the Air Force, under battle conditions and for support troops. For example, for enlisted men serving in the Air Force, a rating of a good performance was given to only 30% of those rated a 3 and 75% of those rated an 8 on the PS scale (the lowest and highest scores for which sufficient numbers were available) (Carlstedt, Reference Carlstedt1999). There is also a strong association between PS scores and the probability of conscripts being accepted into the military: 1–2.0%, 2–14.3%, 3–38.7%, 4–58.1%, 5–66.6%, 6–70.5%, 7–73.6%, 8–75.1% and 9–76.1%.
Statistical analyses
To reveal possible latent dimensions of the five single items, measuring social maturity, interest, psychological energy, home, and emotional control, we first conducted an exploratory factor analysis using principal component analysis. We assessed the association between PS as well as the five single items measured above on the one hand and our three types of CB on the other utilizing logistic regression. Due to different follow-up times, we adjusted for year of birth by added this as a linear term to the model. Next, to investigate whether PS predicted future CB in a population not showing the respective behavior prior to conscription, we used a Cox regression approach, modeling the time to first event. The Cox regression assumes that those censored due to death and the age at the end of the follow-up period have the same risk for CB as individuals with equivalent covariates who are not censored. The relative risk of a first criminal action decreased for all three outcomes as a function of follow-up time. We restricted the follow-up time to a maximum of 20 years as very few individuals were registered for a first CB after 40 years of age. For this follow-up period the proportionality assumption was almost fulfilled so that valid estimates of the hazard ratios (HRs) could be obtained. However, in a final model we also allowed for the association to change over time by adding a log (time) variable to the model. The statistical analyses were performed using SAS 9.3 (SAS Institute, 2011). Finally, we utilized classical twin modeling assuming three sources of liability to the respective criminal phenotype and PS: additive genetic (A), shared environment (C), and unique environment (E). The model assumes that MZ twins share all their genes while DZ twins share on average half of their genes identical by descent, and that the shared environment, reflecting family and community experiences, is the same within each twin pair. Unique environment includes random developmental effects, environmental experiences not shared by siblings, and random error. The model is based on the idea of an underlying liability to each crime phenotype, only measured as a binary outcome, and a PS measured by nine categories. PS is assumed to be normally distributed and the probability to find in the respective category can be represented by the threshold for the lowest category and then a linear increase for each subsequent category. The correlation within each pair is represented by the proportion of variance explained by the genes (A) they share, i.e. 1 for MZ twins and 0.5 for same-sex DZ twins, and shared environmental factors (C). The polychoric correlation is a parameter in a multivariate normal distribution and we set up the likelihood function so that the parameter estimates are the values giving it its maximum value. We used both univariate and bivariate models. The bivariate model is set up as a Cholesky decomposition where the first factor loads on both PS and the crime phenotype while the second loads only on the latter. The method can handle missing items and include individuals and pairs without a PS assessment who still contribute to the CB estimates. Path estimates from the bivariate model are rescaled into correlations, which have no directional interpretation.
For both our univariate and bivariate twin models, we present estimates from the full ACE models with 95% confidence intervals (CIs). This is in line with recommendations based on simulations that show parameter estimates from the full model are typically more accurate than those from submodels even if the latter provide a better model fit (Sullivan & Eaves, Reference Sullivan and Eaves2002). Models were fit in OpenMx software (Boker et al. Reference Boker, Neale, Maes, Wilde, Spiegel, Brick, Spies, Estabrook, Kenny, Bates, Mehta and Fox2011).
Results
Sample and personality assessment
Total PS scores were available on 1 653 721 young men, assessed at a mean age of 18.3 (s.d. = 0.7) years. Scores for the five single items, measuring social maturity, interest, psychological energy, home, and emotional control, were available on 24 524 of these who underwent the conscription examination in the years 1969–1970. Among those providing the five single items, all the five items were substantially intercorrelated, with correlations ranging from +0.33 to +0.64 (online Supplementary Table S1). An exploratory factor analysis produced evidence for a single factor (Eigen values of 2.9, 0.73, 0.56, 0.47 and 0.32) with the following loadings: social maturity +0.82, interest +0.75, psychological energy +0.83, home +0.63, and emotional control +0.78. This factor explained 58.6% of the variance.
Association between PS and onset of CB before v. after conscription
We next examined the association between first registration for CB and age at the conscription examination during which PS was assessed. As seen in online Supplementary Table S2, in individuals with low PS, a large proportion of first criminal registrations occurred before conscription. We therefore used two approaches to evaluate the PS–CB association. First, we utilized logistic regression and examined all CB registrations, regardless of whether they occurred before or after conscription. Second, we examined the prediction of future first CB registrations for total and violent CB from PS scores utilizing Cox models, thereby censoring all individuals whose onset of those forms of CB preceded conscription. Although the results from these Cox models will be biased because of the exclusion of individuals with early-onset CB, we reduced the risk of reverse causality when assessing the nature of the PS–CB association. For recurrent CB, we initially required only that the 5th criminal registration occurred after conscription, but (see below) we explored the impact of varying that definition.
Logistic regression analyses
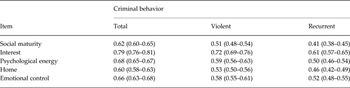
Table 1 depicts the odds ratios (ORs) for the association between total, violent and recurrent CB and the five single items in the subsample of the conscript registry where these are available. For simplicity, we examine only linear models where ORs reflect the impact of a one-point change in a five-point scale. Each of the five items robustly predicts each criminal outcome with considerable consistency in these associations. The social maturity and home items have either the first or second strongest association across our three criminal outcomes and the interest item is always the weakest.
Association between total, violent and recurrent criminal behavior and five items included in the psychological strength assessment from conscript examinations in 1969–1970 assessed by logistic regression (n = 24 524)

Data are given as odds ratio (95% confidence interval).
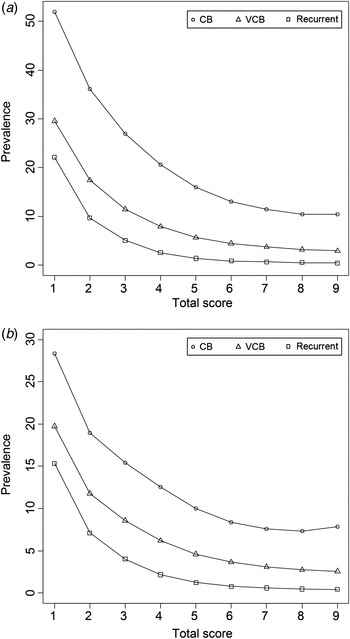
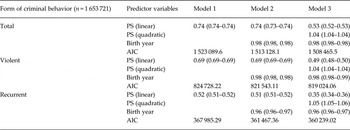
Turning to our entire sample, Fig. 1a depicts the association between lifetime total, violent and recurrent CB, and PS score. Focusing initially on the linear effect (model 1 in Table 2), and looking at total lifetime CB, the OR for total CB per point on the PS scale was 0.74. Thus each increasing point on the PS scale was associated with a 26% reduction in the odds of CB. The association between PS score and risk for violent CB was stronger (OR = 0.69) and stronger still for recurrent CB (OR = 0.52). For each of these forms of CB, birth year was also a significant predictor but produced minimal change in the linear effect of PS (model 2). In model 3, we added a quadratic effect of PS which was significant for total, violent and recurrent CB. These quadratic effects well capture the patterns seen in Fig. 1a . The association between PS and all forms of CB is considerably stronger at lower than at higher levels of PS.
(a) Lifetime prevalence of total criminal behavior (CB), violent CB (VCB) and recurrent CB as a function of the psychological strength score. (b) Prevalence of total CB, VCB and recurrent CB after conscription as a function of the psychological strength score. For recurrent CB, up to four convictions prior to conscription were permitted.

Logistic regression analyses of entire sample total PS score

Data are given as odds ratio (95% confidence interval) or as AIC.
PS, Psychological strength; AIC, Akaike's information criterion.
Cox regression analyses
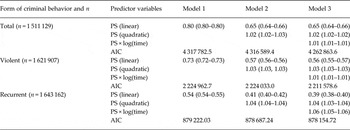
Fig. 1b displays the association between PS and total, violent and recurrent CB occurring only after conscription. As seen in Table 3, the HR calculated from a linear Cox regression model (model 1) was 0.80, 0.73 and 0.54 for prospectively predicting, respectively, total, violent and recurrent CB. Compared with our findings from logistic regression, these results show an expected attenuation in the PS–CB relationship resulting from the censoring of the early-onset criminal offenders. We then, in model 2, added a quadratic function to the Cox model which was also significant for all three of our CB outcomes, most strongly for recurrent CB. This is consistent with the results of the raw data seen in Fig. 1b . Finally, we tested for violations of the proportionality in the Cox models and they were significant for all CB outcomes, most strongly for recurrent CB. These results mean that the impact of PS on risk for CB was stronger in the earlier than in the later years of follow-up.
Cox regression analyses predicting first onsets of total, violent and recurrent criminal behavior from the PS scores

Data are given as odds ratio (95% confidence interval) or as AIC.
PS, Psychological strength; AIC, Akaike's information criterion.
Univariate twin analysis of PS
The polychoric correlations for PS in MZ and DZ twin pairs were, respectively, +0.72 (s.e. = 0.01) and +0.49 (s.e. = +0.02). Parameter estimates for the full ACE model were: a 2 53.5 (95% CI 45.8–61.6), c 2 18.2 (95% CI 10.8–25.3) and e 2 28.2 (95% CI 26.3–30.4).
Bivariate twin analyses of PS and CB
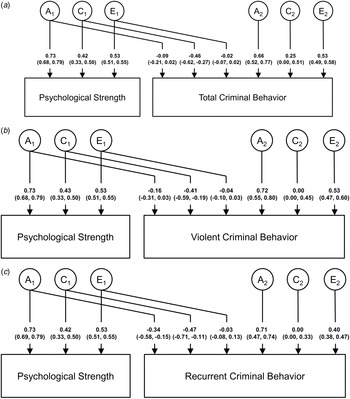
We fitted Cholesky decomposition models to PS and total, violent and recurrent CB. These analyses utilized all criminal convictions regardless of age at first registration. The within-individual phenotypic correlations for PS and total CB, violent CB and recurrent crime were −0.27 (s.e. = 0.02), −0.32 (s.e. = 0.02) and −0.44 (s.e. = 0.01), respectively. As seen in Fig. 2a , the ‘cross-path’ from the shared environmental effects common to PS and to total CB (−0.46) is substantially stronger than the genetic (−0.09) and individual-specific environmental cross-paths (−0.02). If we turn to the path estimates for violent and recurrent CB (Figs 2b and c ), we see first that the magnitude of the shared and individual specific environmental cross-paths are similar to that seen for total CB. However, the genetic cross-path for violent CB (−0.16) is modestly and for recurrent CB (−0.34) much stronger than that seen for total CB (−0.09).
Parameter estimates and 95% confidence intervals from the full bivariate Cholesky decomposition for psychological strength and total criminal behavior (a), violent criminal behavior (b) and recurrent criminal behavior (c). ‘A’ stands for additive genetic effects, C for ‘shared environmental effects’ and E for ‘individual-specific environmental effects’. The subscript ‘1’ refers to the genetic and environmental factors common to both psychological strength and total, violent or recurrent criminal behavior, respectively. The subscript ‘2’ refers to the genetic and environmental factors unique to total, violent or recurrent criminal behavior, respectively.

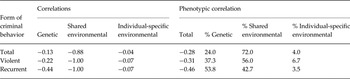
These modeling results are quantified in two other informative ways in Table 4. First, we examined genetic and environmental correlations, all of which are negative. The shared environmental correlations are very high between PS and total CB (−0.88) and estimated at unity (−1.00) for both violent and recurrent CB. The individual-specific environmental factors are similar and quite small (−0.04 to −0.07) for the three criminal groups. The genetic correlation between PS and total CB is quite modest (−0.14) and is stronger for both violent CB (−0.22) and especially for recurrent CB (−0.44).
Parameter estimates from bivariate twin models for psychological strength and total, violent and recurrent criminal behavior

Second, we used the parameter estimates from model fitting to decompose the phenotypic correlation between PS and total, violent and recurrent CB. Of note, as predicted from the logistic and Cox regression models, the total phenotypic correlation between PS and criminal outcomes was weakest for total CB, intermediate for violent CB and highest for recurrent CB. The proportion of the phenotypic correlation resulting from common individual-specific environmental risk factors is very modest and similar across our three criminal classes. However, as we move from total, to violent and then to recurrent CB, we see a steady increase in the proportion of the phenotypic correlation resulting from genetic risk factors common to both PS and CB, and a parallel decline in the proportion due to shared environmental risk factors.
Discussion
We addressed five questions in this report, all with the goal of further understanding the magnitude and nature of the relationship between PS measured at the ages of 18–20 years in Swedish male recruits and risk of registration for total CB and two severe subtypes: violent and recurrent. We review each of these questions in turn.
We first examined the association with five single items used as part of the PS assessment (social maturity, interest, psychological energy, home, and emotional control) that were available to us on a subsample of our entire cohort. While there were differences in the predictive effects of the items, each was independently predictive of our three forms of CB. Furthermore, further supporting the validity of the PS measure, a factor analysis revealed a one-factor structure with substantial loadings from all five items.
Second, we explored the association between PS scores and lifetime CB in our entire sample. Consistent with prior evidence of a substantial relationship between personality and CB (Morizot, Reference Morizot, Morizot and Kazemian2015), we found robust associations. From our linear model, every point on the nine-point PS scale was associated with a 26, 31 and 48% decrease in odds for total, violent and recurrent CB. However, we showed, for the first time to our knowledge, that the association between a personality-like measure – PS – and CB was not solely linear. The change in risk for CB for a given change in personality was much greater at lower than at higher levels of PS. Indeed at PS levels of 7 and higher, increasing PS had a negligible further impact on reduction of risk for CB.
Third, we examined the ability of PS to prospectively predict CB using Cox models. Although this required the censoring of a substantial proportion of those with low PS scores (because their first criminal registration preceded their conscription examination), the results were only modestly attenuated from those obtained using the logistic regression models. Every additional PS point was associated with a 20, 27 and 46% decrease in future risk for total, violent and recurrent CB. These results are important because they make it unlikely that information about prior criminal convictions influenced the PS scores assigned by the interviewer, thereby biasing upward the PS–CB association. Furthermore, they rule out the possibility that the experience of a criminal conviction could have had an indirect impact on the individual's behavior at the interview in such a way as to produce a lowered PS score.
However, examining a prospective risk for recurrent CB poses a methodological problem. Individuals with recurrent CB typically start offending at young ages and a sample whose first conviction occurred after the age of 18 years would be atypical (Wolfgang et al. Reference Wolfgang, Figlio and Sellin1972; Moffitt et al. Reference Moffitt, Caspi, Rutter and Silva2002). In our main analyses, we therefore permitted individuals to have up to four convictions prior to conscription and dated their ‘onset’ for recurrent CB at the age of their 5th conviction. This, however, reduces our ability to claim a true prospective prediction. In particular, the psychologist who interviewed them and assigned their PS score could have had access to their official criminal record. To explore the possible biases introduced by our approach, we fitted simple linear Cox models to models where we permitted up to three, two, one and no convictions prior to conscription for our definition of recurrent CB. The HRs for PS were, respectively, 0.55 (95% CI 0.55–0.56), 0.57 (95% CI 0.56–0.57), 0.58 (95% CI 0.57–0.59) and 0.59 (95% CI 0.58–0.59). These results are reassuring in that they suggest that our initial estimates of the predictive association between PS and recurrent CB were probably not substantially biased by possible knowledge of prior convictions during the PS assessment process.
Fourth, we conducted a univariate twin analysis of the PS score. How typical are our results compared with those found for standard personality traits? In a widely cited review, Bouchard & Loehlin (Reference Bouchard and Loehlin2001) wrote:
Thus for broad traits at the level of Eysenck's three factors or the Big Five, the twin data have fairly consistently suggested heritabilities in the .40–.60 range and little or no effect of shared family environment (p. 252).
The estimated heritability of PS (54%) is thus well within the range of typical personality traits (Loehlin, Reference Loehlin1992; Bouchard, Reference Bouchard1994; Loehlin et al. Reference Loehlin, McCrae and Costa1998). However, the large preponderance (but not all; Matteson et al. Reference Matteson, McGue and Iacono2013) of studies of typical personality dimensions (Loehlin, Reference Loehlin1992; Bouchard, Reference Bouchard1994; Loehlin et al. Reference Loehlin, McCrae and Costa1998) report no evidence for shared environmental effects. We find an estimate for c 2 of 18% for PS. We do not know whether our evidence for shared environment for PS, unlike for most other personality traits, reflects some aspect of this measure (e.g. an assessment including aspects of the home environment), the assessment method (interview v. questionnaire) or the large sample and hence power to detect modest c 2 effects (Neale et al. Reference Neale, Eaves and Kendler1994).
Fifth, we utilized a Cholesky model applied to MZ and DZ twin pairs to decompose the PS–CB association into its genetic and environmental components. For all three forms of CB, the individual-specific environment contributed very little to the covariance of PS and any of the CB measures. By contrast, both genetic and shared environmental factors were together responsible for the large bulk of the PS–CB correlation. These results argue against a direct causal link between PS and CB, and are more consistent with a ‘liability index’ model in which PS reflects genetic and shared environmental factors which also in turn make an impact on the risk for CB.
Most interestingly, the relative importance of genetic and environmental factors in the PS–CB association changed as a function of the severity of the CB outcome. For total CB, the ratio of the PS–CB correlation due to shared environmental v. genetic factors was exactly 3:1. By contrast, for violent and recurrent CB, these ratios were 1.5:1 and 0.75:1, respectively. Another way to describe these findings is to note that the genetic correlation between PS and CB increased rather dramatically as a function of the severity of the CB phenotype. These results provide a quite interesting example of shifts both in the magnitude of phenotype correlations between one risk factor and subtypes of an outcome variable and the sources of that correlation. That is, PS both has a stronger overall correlation with more severe criminal outcomes and a higher proportion of that correlation is driven by genetic factors. We are unaware of parallels in prior work on the association of personality and CB.
Limitations
These results should be interpreted in the context of five potential methodological limitations. First, the Swedish Crime Register contains only data on criminal convictions. As seen in most other countries, in Sweden a majority of most crimes are not officially reported or do not result in a conviction. In the 2008 National Swedish Crime Victim Survey, the proportion of crimes reported to the police ranged from 14% for sexual offences to 55% for serious assaults (Swedish National Council for Crime Prevention, 2008). Bias might arise if the probability that a committed crime is reported, or that a reported crime leads to a conviction, differs across social strata or between members of pairs of MZ v. DZ twins.
Second, our measure of personality was unconventional and we unfortunately have no easy way to map PS onto better-studied personality trait systems. We would postulate, from a perspective of the now dominant ‘big five’ model of personality (John, Reference John and Pervin1990), that a high PS score reflects high agreeableness (social maturity), high conscientiousness (social maturity) and low neuroticism (emotional control). Each of these personality traits indeed correlates with low risk for CB (John et al. Reference John, Caspi, Robins, Moffitt and Stouthamer-Loeber1994; Pratt & Cullen, Reference Pratt and Cullen2000; Morizot, Reference Morizot, Morizot and Kazemian2015). Less clearly, high PS might reflect high openness (interest) and high extraversion (energy) which have more ambiguous associations with CB risk. What we can say about our PS measure is that it has strong validity in its ability to predict acceptance into the military, the quality of performance once in the military and, in our own data, CB.
Third, given the strong association between PS and military service, the prospective association between PS and CB could be an effect not of the conscript's personality but of the military service itself (Laub & Sampson, Reference Laub and Sampson2006). We therefore added military service as a dichotomous predictor variable to our logistic regression analyses. While it was significantly protective for total, violent and recurrent CB, its addition produced virtually no change in the PS–CB ORs.
Fourth, we cannot rule out the possibility that CB that did not result in arrest and conviction, self-reported by the conscript, made an impact on their PS score and thereby upwardly biased the PS–CB association.
Finally, we were only able to include same-sex twins whose zygosity was known as a result of at least one member responding to a mailed questionnaire. (This was not needed for opposite-sex twins.) As expected, CB was associated with a reduced probability of returning questionnaires so the rates of CB were lower in males and females from same-sex v. from opposite-sex pairs. This is a form of ‘concordance-dependent’ ascertainment where the probability of known zygosity will be lowest in pairs concordant for CB, intermediate in those discordant for CB and highest in those where neither twin has CB. Simulations suggest that with the level of differential ascertainment expected in our data, biases in parameter estimates are likely to be modest and most likely to produce underestimations of a 2 and c 2 and overestimation of e 2 (Kendler & Eaves, Reference Kendler and Eaves1989).
Supplementary material
For supplementary material accompanying this paper visit http://dx.doi.org/10.1017/S0033291715001403
Acknowledgements
This project was supported by the Ellison Medical Foundation and the Swedish Research Council to K.S., the Swedish Research Council for Health, Working Life and Welfare (in Swedish: Forte; registration no: 2013–1836) to K.S., the Swedish Research Council to J.S. as well as ALF funding from Region Skåne awarded to J.S. and K.S.. Nancy Murphy Ph.D. and Christopher Patrick Ph.D. provided helpful comments on earlier versions of this manuscript.
Declaration of Interest
None.