Depression and anxiety have a high prevalence in women during pregnancy and the postpartum period (Vesga-Lopez et al., Reference Vesga-Lopez, Blanco, Keyes, Olfson, Grant and Hasin2008). The co-morbidity between anxiety and depression is higher than with any other mental disorder (Kendler et al., Reference Kendler, Walters, Neale, Kessler, Heath and Eaves1995). During pregnancy, depressive symptoms at the second trimester are predictive of high anxiety levels at the third trimester, which in turn predicts depressive symptoms in the postpartum period (Heron et al., Reference Heron, O’Connor, Evans, Golding and Glover2004; Skouteris, Wertheim, Rallis, Milgrom, & Paxton, Reference Skouteris, Wertheim, Rallis, Milgrom and Paxton2009). Overall, depressive and anxiety disorders during pregnancy seem to be important risk factors for postpartum depression (Grant, McMahon, & Austin, Reference Grant, McMahon and Austin2008; O’Hara & Swain, Reference O’Hara and Swain1996; Sutter-Dallay, Giaconne-Marcesche, Glatigny-Dallay, & Verdoux, Reference Sutter-Dallay, Giaconne-Marcesche, Glatigny-Dallay and Verdoux2004) and to adverse child outcomes (Dunkel Schetter & Tanner, Reference Dunkel Schetter and Tanner2012). Nevertheless, depression and anxiety have been pointed out as being among the most overlooked diagnoses in primary care settings with true prevalence rates 5 to 10 times higher than those usually reported (Bergink et al., Reference Bergink, Kooistra, Lambregtse-van den Berg, Wijnen, Bunevicius, van Baar and Pop2011). Thus, screening for these disorders during pregnancy and postpartum is warranted.
For depression, the Edinbugh Postnatal Depression Scale (EPDS) has been tested for women in the postnatal period (Areias, Kumar, Barros, & Figueiredo, Reference Areias, Kumar, Barros and Figueiredo1996; Cox, Holden, & Sagovsky, Reference Cox, Holden and Sagovsky1987). Most studies testing the EPDS with a gold standard were undertaken with postpartum women, while few have done it with pregnant women (Gibson, McKenzie-McHarg, Shakespeare, Price, & Gray, Reference Gibson, McKenzie-McHarg, Shakespeare, Price and Gray2009). Cross-cultural variation is demonstrated by different EPDS cut-offs ranging from 10 (Adewuya, Ola, Dada, & Fasoto, Reference Adewuya, Ola, Dada and Fasoto2006) to 14/15 for pregnancy (Murray & Cox, Reference Murray and Cox1990) and from 7 (Chaudron et al., Reference Chaudron, Szilagyi, Tang, Anson, Talbot, Wadkins and Wisner2010) to 11/12 for the postpartum (Benvenuti, Ferrara, Niccolai, Valoriani, & Cox, Reference Benvenuti, Ferrara, Niccolai, Valoriani and Cox1999).
For anxiety, the State-Trait Anxiety Inventory (STAI-S/T) original cut-off proposed by Spielberger, Gorsuch, and Lushene (Reference Spielberger, Gorsuch and Lushene1970) was used in most studies during the perinatal period. It was considered to be valid for antenatal use, since it reflects situation specific anxiety in high-risk compared to low-risk clinics (Gunning et al., Reference Gunning, Denison, Stockley, Ho, Sandhu and Reynolds2010), nevertheless its reliability and validity for the pregnancy and postpartum period has been tested in very few studies which could lead to interpretation errors and incomparable data (Meades & Ayers, Reference Meades and Ayers2011).
Psychometric studies on general anxiety questionnaires are therefore needed. The lack of studies on this issue may be due to the fact that the STAI was not designed to provide a diagnosis of anxiety disorder. In one of those few studies, the best cut-off of the STAI-S for Australian childbearing women was found to be 40 for the prediction of postnatal anxiety and mood disorders (Grant et al., Reference Grant, McMahon and Austin2008), that matches the original cut-off (Spielberg et al., Reference Spielberger, Gorsuch and Lushene1970). Despite that, several different cut-offs for STAI were used in childbearing women.
During the antenatal period, a score of 40 or more was found to predict infant difficult temperament (Austin, Hadzi-Pavlovic, Leader, Saint, & Parker, Reference Austin, Hadzi-Pavlovic, Leader, Saint and Parker2005) while after childbirth it was found to be associated with a compromised quality of maternal behaviors during mother-infant interaction (Nicol-Harper, Harvey, & Stein Reference Nicol-Harper, Harvey and Stein2007).
Considering the fact that both EPDS and STAI have been used extensively to assess depression and anxiety during the prenatal and postnatal period, there is a lack of studies attesting their psychometric properties for screening caseness against a clinical diagnostic interview. Attending to the psychological and physiological changes that occur during this period, the establishment of appropriate clinical cut-offs is relevant for screening and research purposes. The validation of these user-friendly measures could promote the widespread screening of depression and anxiety during pregnancy and the postpartum periods as part of routine antenatal and postnatal care.
To our knowledge, this is the first study testing both the EPDS and STAI-S criterion validity against a diagnostic clinical interview (gold standard) in women before and after birth. This study aimed to test the screening performance of EPDS and STAI-S in detecting depressive (major and minor depression disorders and episodes, dysthymia) and anxiety disorders (except specific phobias), respectively, at pregnancy and postpartum.
Method
Participants
Participants were derived from a larger study recruited in an Obstetrics Out-patients Unit (Oporto, Portugal) aimed to study anxiety and depression symptoms from early pregnancy to three months postpartum among women with low medical risk pregnancies and their partners. Women screening positive on EPDS (≥ 9, n = 44), STAI (≥ 45, n = 12) or both (n = 34) during pregnancy were selected, as well as matched controls (n = 58) based on socio-demographic characteristics, such as parity, age, socio-economical occupational and marital status. In total, 148 women were selected during pregnancy and 99 completed the postpartum assessment.
The great majority of the participants were Portuguese (90.5%) and Caucasian (91.9%). More than half of the participants were aged between 30 and 39 years old (M = 28.0; SD = 6.2), were married or cohabiting (84.8%), and lived with the partner without any other family members in the household (77.8%); and had no other child (56.8%).
Procedures
This study is part of a larger research that was conducted according to prevailing ethical principles and received previous approval from the Maternity Hospital Ethical Commission. A random sample of pregnant women recruited in an Obstetrics Out-patients Unit (Oporto, Portugal) completed the STAI-S and EPDS during pregnancy (at 8-14, 20-24 and 30- 34 weeks) and at three months postpartum and provided socio-demographic information. The exclusion criteria were not reading or writing Portuguese and multiple gestations. Further details on study design are described elsewhere (Figueiredo & Conde, Reference Figueiredo and Conde2011).
Women screening positive on EPDS (EPDS ≥ 9) or STAI-S (STAI-S ≥ 45) at any of the three time points during pregnancy and matched controls were administered the SCID about one week later by an interviewer blind to the EPDS and STAI-S scores.
The drop-out rate from pregnancy to postpartum was of 33.1%. To test for potential attrition bias we compared baseline data for women who withdrew after childbirth versus women who continued participating in the study and tested whether demographics were associated with drop out using independent samples t-tests and Pearson χ 2 tests. We found no significant differences between both groups on EPDS and STAI-S mean scores during pregnancy, as well as no significant association between prevalence of depression or anxiety diagnoses, prevalence of women who exceeded the cut-off values in one or both measures, age, parity, or marital status and group membership (all p > .05).
Measures
Socio-demographic questionnaire
Information about the participants (e.g., age, ethnicity, nationality, occupational and marital status, household arrangements, education level, medical and obstetrical history, psychological well-being and substances consumption).
State Anxiety Inventory
The State Anxiety Inventory is a twenty-item self-report scale designed for measuring the temporary condition of “state anxiety” (anxiety in a specific situation) (STAI-S/T: Spielberger, Gorsuch, Lushene, Vagg, & Jacobs, Reference Spielberger, Gorsuch, Lushene, Vagg and Jacobs1983). Several studies have been using this instrument during pregnancy (e.g., Figueiredo & Conde, Reference Figueiredo and Conde2011; Teixeira, Figueiredo, Conde, Pacheco, & Costa, Reference Teixeira, Figueiredo, Conde, Pacheco and Costa2009). STAI-S Portuguese version has shown good internal consistency (Cronbach’s α = .87–.93) (Biaggio, Natalicio, & Spielberger, Reference Biaggio, Natalicio, Spielberger, Spielberger and Dias-Guerrero1976). In the present study, the internal consistency of the STAI-S for pregnancy and postpartum was excellent (Cronbach’s α = .91 and .92, respectively).
Edinburgh Postnatal Depression Scale
The Edinburgh Postnatal Depression Scale (EPDS: Cox et al., Reference Cox, Holden and Sagovsky1987) is a self-report questionnaire composed of 10 items scored on a 4 point Likert scale (0-3), designed to assess postpartum depression. This scale addresses the intensity of depressive symptoms within the previous seven days and has been used in several studies both with pregnant and postpartum women, namely in Portugal (Areias et al., Reference Areias, Kumar, Barros and Figueiredo1996; Figueiredo & Conde, Reference Figueiredo and Conde2011; Figueiredo, Pacheco, & Costa, Reference Figueiredo, Pacheco and Costa2007; Teixeira et al., Reference Teixeira, Figueiredo, Conde, Pacheco and Costa2009; Gorman et al., Reference Gorman, O’Hara, Figueiredo, Hayes, Jacquemain and Kammerer2004). EPDS Portuguese version has shown good internal consistency (Cronbach’s α = .85) (Figueiredo et al., Reference Figueiredo, Pacheco and Costa2007). In the present study, the EPDS showed good internal consistency for pregnancy and postpartum (Cronbach’s α = .82 and .88).
Structured Clinical Interview
The Structured Clinical Interview for DSM-IV (SCID; First, Spitzer, Gibbon, & Williams, Reference First, Spitzer, Gibbon and Williams1997) is a semi-structured interview based on DSM-IV criteria for the diagnoses of mental disorders included on Axis I. The SCID has been validated for Portugal (Gorman et al., Reference Gorman, O’Hara, Figueiredo, Hayes, Jacquemain and Kammerer2004).
Data Analysis
Descriptive analyses were performed for demographic characteristics and scores on EPDS and STAI-S according to SCID diagnosis. Anxiety and depression caseness was based on the diagnoses provided by the SCID. Anxiety caseness included anxiety disorders, except specific phobias. Depression caseness included major and minor depression disorders and episodes, as well as dysthymia. To examine whether the EPDS and STAI-S can distinguish between depression and anxiety caseness, univariate analysis of variance (ANOVA) followed by Scheffé post hoc tests were conducted comparing the four diagnostic groups: no diagnosis, depression caseness, anxiety caseness and co-morbid depression and anxiety caseness for pregnancy and the postpartum period.
Receiver operating characteristics (ROC) curve analyses were performed to determine the screening performance of the EPDS and the STAI-S in identifying women with depression and anxiety caseness, respectively, for both pregnancy and postpartum. The area under the curve (AUC) provides an estimate of the overall diagnostic ability of the instrument with higher values indicating greater classification accuracy. The AUC of 0.5 represents classification by chance, whereas AUC of 0.7 is considered “acceptable”, 0.8 as “excellent” and 0.9 as “outstanding” (Hosmer & Lemeshow, Reference Hosmer and Lemeshow2000). Sensitivity, specificity, positive predictive values (PPV) and negative predictive values (NPV) for each EPDS and STAI-S cut-off scores were also computed. The EPDS scores were compared to the anxiety caseness, whereas the STAI-S scores against the depression caseness by additional ROC analyses to further examine the diagnostic ability of these instruments. The optimal cut-off score to each instrument and assessment period was determined by identifying the closest value to the intersection of the ROC curve with the diagonal line from the upper left to the lower right side of the graph. At this value an optimal balance between sensitivity and specificity is achieved (Bland, Reference Bland2000).
Data were analysed with IBM SPSS 19 Windows version (PASW Statistics for Windows, SPSS Inc, Chicago) and MedCalc 12.3.0.
Results
During pregnancy, 38 women (25.7%) were included on the depression caseness category and 35 women (23.6%) on the anxiety caseness since they were diagnosed with at least one depression or anxiety disorder, respectively. Twenty-one and six women met diagnostic criteria for major and minor depressive episodes respectively, while one filled the criteria for major depression disorder. One woman had both a major depressive episode and bulimia and nine had co-morbid anxiety diagnoses. Furthermore, 26 women were diagnosed with an anxiety disorder including generalized anxiety disorder (GAD) (n = 16), agoraphobia (n = 6), GAD and agoraphobia (n = 1), panic disorder (n = 1), panic disorder with agoraphobia (n = 1) and obsessive-compulsive disorder (n = 1). Other diagnoses included specific phobias (n = 8) and grief (n = 1).
At 3 months postpartum, 23 women (23.5%) were included on the depression caseness category and 14 women (14.1%) on the anxiety caseness. Nine and six met criteria for major and minor depressive episodes, respectively, two were diagnosed with major depression disorder and one with dysthymia. Five cases had co-morbid depression and anxiety diagnoses. Moreover, nine women filled the criteria for an anxiety disorder at the postpartum including GAD (n = 3), agoraphobia (n = 2), panic disorder, panic disorder with agoraphobia, obsessive-compulsive disorder and social phobia (n = 1). Other diagnoses included specific phobias (n = 4) and grief (n = 1).
Screening performance of EPDS and STAI-S
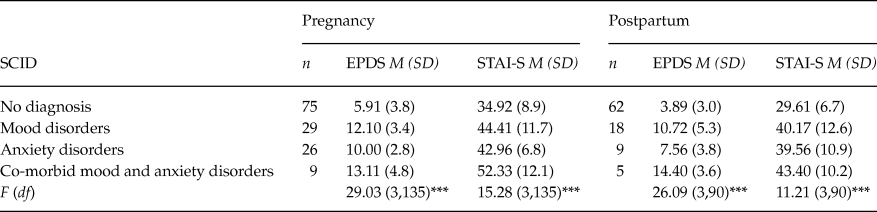
Prenatal and postnatal EPDS and STAI-S scores according to DSM-IV-TR diagnostic criteria To explore the ability of the EPDS and the STAI-S to discriminate among the psychiatric diagnoses, univariate ANOVAs with psychiatric diagnosis as the independent variable (no diagnosis vs. mood disorders vs. anxiety disorders vs. co-morbid depression and anxiety) were conducted. The results of this analysis are displayed in Table 1. Overall differences were found in EPDS and STAI-S mean scores across the four psychiatric diagnoses during pregnancy (F(3, 135) = 29.03 and F(3, 135) = 15.28, p < .001) and at postpartum (F(3, 90) = 26.09 and F(3, 90) = 11.21, p < .001). Scheffé post hoc tests revealed that women with no psychiatric diagnosis had significantly lower EPDS and STAI-S scores than the other groups with mood, anxiety or co-morbid depression and anxiety (all p < .05). However, no differences were found between the three psychiatric diagnoses groups on EPDS and STAI-S total scores (all p > .05).
EPDS and STAI-S scores according to SCID diagnosis at pregnancy and postpartum

Note: Women with other diagnoses at pregnancy (n=9) and at the postpartum (n = 5) were excluded from these analyses.
*** p < .001.
Diagnostic accuracy of the EPDS during pregnancy and postpartum
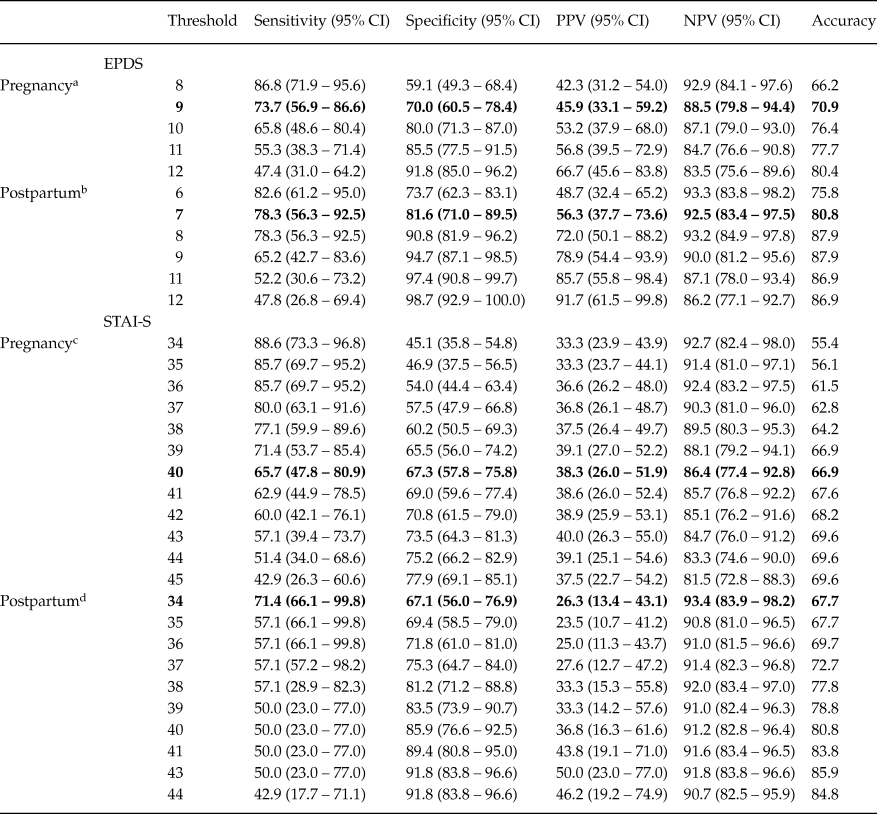
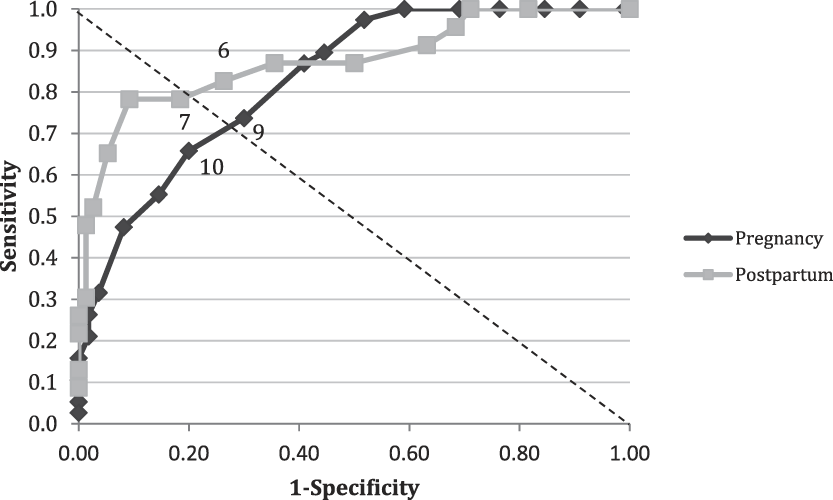
Table 2 and Figure 1 show the results of the ROC analysis in differentiating depression caseness from non-depression (including normal cases and all the other psychopathological disorders) for pregnancy and the postpartum. The AUC for the total score of the EPDS was .83 (95% C.I. = .76-.899, p < .001) for pregnancy and .88 (95% C.I. = .78-.97, p < .001) for postpartum, indicating an excellent classification accuracy power. The optimal balance between sensitivity and specificity was achieved at a cut-off ≥ 9 for pregnancy (sensitivity = 73.7% and specificity = 70.0%). For the postpartum, a lower cut-off score of ≥ 7 seemed to be appropriate (sensitivity = 78.3% and specificity = 81.6%). At these cut-offs 70.9% and 80.8% of women were correctly classified.
Diagnostic performance of EPDS and STAI-S for detection of depression and anxiety caseness, respectively (%)

Note: PPV Positive predictive value, NPV Negative predictive value; a n = 148; 38 included in the depression caseness; b n = 99; 23 included in the depression caseness; c n = 148; 35 included in the anxiety caseness; d n = 99; 14 included in the anxiety caseness. Values in bold represent the most adequate balance between sensitivity and specificity.
ROC curve. Depression1 at pregnancy and postpartum versus non-depression.
1Depression versus non-depression: pregnancy (n = 38 versus n = 110), postpartum (n = 23 versus n = 76).

To examine the screening ability of the EPDS to detect women with or without an anxiety disorder, ROC analyses with anxiety caseness as the criterion were conducted. The AUC for pregnancy was .71 (95% C.I. = .62-.79, p < .001) and .78 (95% C.I. = .64-.91, p = .001) for the postpartum.
Diagnostic accuracy of the STAI-S during pregnancy and postpartum
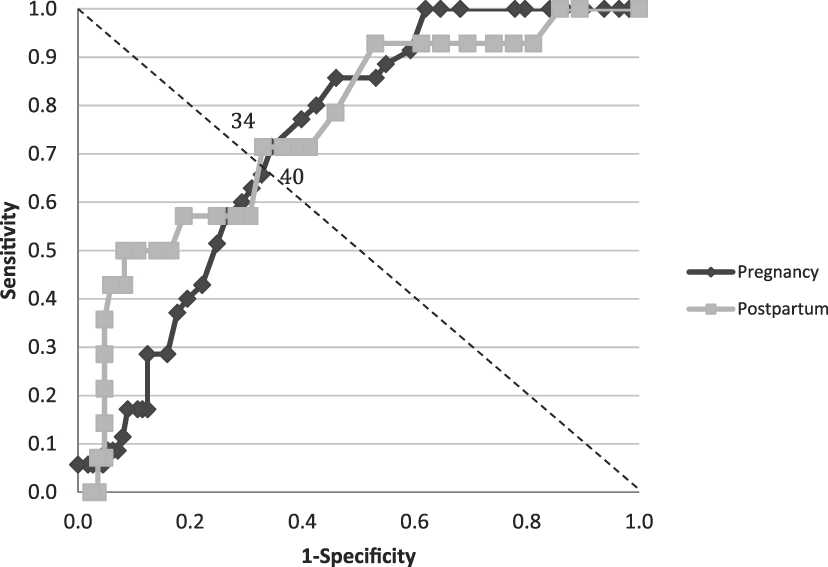
Table 2 and Figure 2 show the results of the ROC analyses in differentiating anxiety caseness from non-anxiety (including normal cases and all the other psychopathological disorders) for pregnancy and the postpartum. The AUC for the total score of the STAI-S was .73 (95% C.I. = .65-.81, p < .01) for pregnancy and .76 (95% C.I. = .62-.89, p < .05) for postpartum. The optimal balance between sensitivity and specificity was achieved at a cut-off ≥ 40 for pregnancy (sensitivity = 65.7% and specificity = 67.3%). A lower cut-off score (34) was found to be the optimal score for screening anxiety caseness at the postpartum (sensitivity = 71.4% and specificity = 67.1%). At these cut-offs 66.9% and 67.7% of women were correctly classified.
ROC curve. Anxiety2 at pregnancy and postpartum versus non-anxiety.
2Anxiety versus non-anxiety: pregnancy (n = 35 versus n = 113), postpartum (n = 14 versus n = 85).

Additional ROC analyses were conducted to examine the screening ability of STAI-S using depression caseness as the criterion. The AUC for pregnancy was .72 (95% C.I. = .62-.81, p < .001) and for the postpartum was .75 (95% C.I. = .64-.86, p < .001).
Discussion
The results of the present study show that the EPDS and the STAI-S were both reasonably valid instruments for identifying maternal depressive and anxiety disorders during pregnancy and the postpartum period in a community sample of women.
At pregnancy and postpartum periods, the EPDS has demonstrated a high level of diagnostic ability in distinguishing between depressed and non-depressed women, whereas STAI-S revealed an acceptable diagnostic ability in distinguishing between anxious and non-anxious women. The EPDS performed satisfactorily as a diagnostic instrument of anxiety disorders at both time periods. Previous studies had suggested that at least some items of the EPDS could be used to detect anxiety disorders (e.g., Mathey, Reference Matthey2008; Rowe, Fisher, & Loh, Reference Rowe, Fisher and Loh2008). Similarly, STAI-S was found to be as accurate to detect anxiety disorders as to detect depressive disorders in the postpartum as it has already been found for other periods of the life course (Kvaal, Ulstein, Nordhus, & Engedal, Reference Kvaal, Ulstein, Nordhus and Engedal2005).
This indicates that depressive and anxiety disorders during pregnancy and the postpartum periods are probably not independent clinical entities. Previous studies had already reported that the EPDS does not distinguish depression from anxiety disorders in the postpartum period (Rowe et al., Reference Rowe, Fisher and Loh2008), nor does the STAI-S in clinical samples of adults and older adults (Kennedy, Schwab, Morris, & Beldia Reference Kennedy, Schwab, Morris and Beldia2001; Kvaal et al., Reference Kvaal, Ulstein, Nordhus and Engedal2005). An overlap between depression and anxiety symptoms has been consistently recognized (e.g., Kennedy et al., Reference Kennedy, Schwab, Morris and Beldia2001; Meades & Ayers, Reference Meades and Ayers2011). Some empirical and theoretical explanations have been proposed to explain this finding. First, although the EPDS was originally designed to measure depression (Cox et al., Reference Cox, Holden and Sagovsky1987), some studies have demonstrated the existence of an anxiety dimension (Mathey, Reference Matthey2008; Pop, Komproe, & Van Son, Reference Pop, Komproe and Van Son1992; Reichenheim, Moraes, Oliveira, & Lobato, Reference Reichenheim, Moraes, Oliveira and Lobato2011). However, the separate use of this subscale is not recommended (Brouwers, van Baar, & Pop, Reference Brouwers, van Baar and Pop2001; Pop et al., Reference Pop, Komproe and Van Son1992; Reichenheim et al., Reference Reichenheim, Moraes, Oliveira and Lobato2011; Rowe et al., Reference Rowe, Fisher and Loh2008). Second, there is also some evidence that postpartum depression has prominent anxious features (Hendrick, Altshuler, Strouse, & Grosser, Reference Hendrick, Altshuler, Strouse and Grosser2000). Third, several authors suggest that STAI is also sensitive to depressive disorders (Kennedy et al., Reference Kennedy, Schwab, Morris and Beldia2001; Kvaal et al., Reference Kvaal, Ulstein, Nordhus and Engedal2005). Fourth, Clark, and Watson (Reference Clark and Watson1991) proposed that anxiety and depression have a common dimension called general distress or negative affect.
For EPDS, the optimal cut-off score was 9 for pregnancy and 7 for the postpartum. These are somewhat lower cut-offs than suggested in previous studies carried out during pregnancy (e.g., Adewuya et al., Reference Adewuya, Ola, Dada and Fasoto2006), but within the range of published cut-offs for the postpartum (Chaudron et al., Reference Chaudron, Szilagyi, Tang, Anson, Talbot, Wadkins and Wisner2010). This may be at least partly explained by the inclusion of minor depressive disorders and episodes besides major depressive disorders. Lower optimal cut-offs scores and lower sensitivity have been reported when minor depression disorders were included (Chaudron et al., Reference Chaudron, Szilagyi, Tang, Anson, Talbot, Wadkins and Wisner2010; Eberhard-Gran, Eskild, Tambs, Opjordsmoen, & Samuelsen, Reference Eberhard-Gran, Eskild, Tambs, Opjordsmoen and Samuelsen2001; Matthey, Barnett, Kavanagh, & Howie, Reference Matthey, Barnett, Kavanagh and Howie2001). Moreover, in the depressed caseness group of our sample most women had less severe diagnosis of depression. The sensitivity of the EPDS at pregnancy and postpartum period for the optimal cut-off score are low but comparable to those found in other validation studies (Eberhard-Gran et al., Reference Eberhard-Gran, Eskild, Tambs, Opjordsmoen and Samuelsen2001; Gibson et al., Reference Gibson, McKenzie-McHarg, Shakespeare, Price and Gray2009).
For the STAI-S, the optimal cut-off score was 40 for pregnancy and 34 for the postpartum. The cut-point for pregnancy is consistent with previous reports (Grant et al., Reference Grant, McMahon and Austin2008), although higher sensitivity, specificity and negative predictive value, but lower positive predictive value was reported. The existing differences may be partly explained by the differing time span in which STAI-S was administered. In the present study, state anxiety was assessed during pregnancy, whilst Grant et al. (Reference Grant, McMahon and Austin2008) assessed anxiety only in the last trimester of pregnancy. At the optimal cut-off scores for pregnancy and postpartum period, the sensitivity of the STAI-S for anxiety disorders was moderate. Therefore, additional screening for anxiety disorders with specific self-report measures during the perinatal period may be recommended as previously suggested by others (Muzik et al., Reference Muzik, Klier, Rosenblum, Holzinger, Umek and Katschnig2000; Ross & McLean, Reference Ross and McLean2006).
Considering that depressive and anxiety disorders in women are common mental disorders during pregnancy and the postpartum and the potential for impact on the fetus/ infant health and development (Dunkel Schetter & Tanner, Reference Dunkel Schetter and Tanner2012), the use of valid, reliable and easy to complete short self-report instruments is recommended. Screening for depressive and anxiety disorders using EPDS and STAI-S during the prenatal period as part of the routine care may provide an easy and low cost strategy to detect and provide adequate treatment and simultaneously to identify those who are at-risk for these disorders at the postpartum period. However, this study shows that both EPDS and STAI-S miss a significant number of cases and generate a considerable proportion of false positives as most screening instruments (Gibson et al., Reference Gibson, McKenzie-McHarg, Shakespeare, Price and Gray2009).
The reported results should be interpreted in the context of several limitations. First, the similarity in baseline characteristics between those lost to follow-up and those remaining in the study to the end is not sufficient to exclude the possibility of attrition bias. In fact, recent studies suggest that postpartum depression is associated to miss postpartum follow-up (Lobato, Bruner, Dias, Moraes, & Reichenheim, Reference Lobato, Bruner, Dias, Moraes and Reichenheim2012). Second, given the lower sensitivity, specificity and PPV at the optimal cut-off of the STAI-S during pregnancy and postpartum, we cannot exclude the possibility that the SCID criteria for anxiety disorders were applied less strictly than the Mini- Plus Neuropsychiatric Interview in another study where STAI-S was used at the third trimester of pregnancy (Grant et al., Reference Grant, McMahon and Austin2008). Third, the small sample size (with only 14 anxiety cases postpartum) is also a limitation that might have resulted in poor statistical power to distinguish between cases and non-cases of anxiety disorders with the STAI-S.
Even with these limitations, this longitudinal study demonstrates that EPDS and STAI-S are reasonably valid screening tools for depression and anxiety disorders for use during pregnancy and postpartum.
This work was supported by the Operational Program Science and Innovation 2010 (POCI 2010) of the Community Support Board III and by the European Community Fund FEDER. (POCI/SAU-ESP/56397/2004; Anxiety and depression in women and men during the transition to parenthood: Effects on fetal and neonatal behavior and development).