I. INTRODUCTION
The development of new steels or forming processes involves many works on microstructure evolution including the processes of dynamic recovery or recrystallization, static recovery, or recrystallization, grain growth, etc. Modeling for these processes is an effective approach to predict microstructure evolution. Therefore, many works aim to find the most suitable models for the processes. As the key to modeling static recrystallization (SRX) is to determine SRX volume fraction, the microstructure observation or double deformation technique has been developed for this purpose. Since the former one is tedious and time consuming, the latter one has been widely used. However, there are many methods such as 0.2% offset, 2% offset, 5% total strain, back extrapolation, mean flow stress, and area measurement methods available to analyze the stress–strain curves resulting from the double deformation technique. And different methods may lead to different results. Some researchers find that 0.2% offset method can estimate SRX softening fraction of a Nb microalloyed steel very well. Reference Li, Maccagno, Bal and Jonas1 While it has been revealed in Ref. Reference Sun and Hawbolt2 that the softening fraction determined by using 0.2% offset method consists of both recovery and recrystallization softening and SRX actually occurs when the softening fraction reaches 0.2. It is found in Ref. Reference Chang, Shi and Jiang3 that the SRX volume fraction for a low carbon steel determined by using 2% offset method is consistent with metallographic examination and that determined by using 0.2% offset method is much larger. Consequently, some researchers suggest the 2% offset method to analyze the data from double deformation test to exclude the recovery. Moreover, other researchers propose the 5% total strain method to measure the degree of recrystallization. Reference Perttula and Karjalainen4 It is reported elsewhere Reference Cui and Shong5 that the result from 0.2% offset method is consistent with that from mean flow stress method and the value from back extrapolation method is lower. However, it is also reported that mean flow stress method can give a better estimation of SRX fraction than offset method and back extrapolation method. Reference Laasraoui and Jonas6 Although there are differences between back extrapolation method and other methods, some authors still favor back extrapolation method. Reference Choquet, Le Bon, Perdrix and McQueen7,Reference Andrade, Akben and Jonas8 Although the methods mentioned above have got widely used, some researchers have pointed out that the measurement of yield stress or flow stress is not very sensitive to a subtle change in precipitation while area measurement method is more sensitive to the strain energy change due to precipitation. Reference Hong, Kang and Park9 Therefore, they prefer to use area measurement method to measure SRX volume fraction and this method has been used elsewhere. Reference Chen, Zhou and Tang10 At present, there is still no agreement on method selection to evaluate SRX volume fraction. It all depends on whether microstructure evolution can be fully reflected on the flow behaviors of material.
In the present study, the 0.2% offset, 2% offset, 5% total strain, mean stress, and area measurement methods to calculate SRX volume fraction were discussed. The methods were further discussed based on the experimental curves from double isothermal compression tests performed on a low carbon microalloyed steel by using a Gleeble-3800 thermal mechanical simulator (Dynamic Systems Inc., New York, New York). The experimental curves were analyzed by using the mentioned methods to calculate SRX volume fraction and the results were systematically compared to justify the methods.
II. THEORY AND METHOD
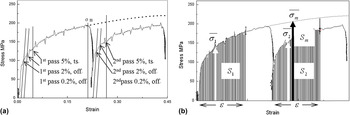
It is the difference in the physical parameters of the double deformation that permits the calculation of SRX volume fraction. In the first pass deformation, work hardening process plays a dominant role in austenite. At the stage of isothermal holding, softening process caused by static recovery or recrystallization occurs. Dislocation movement and rearrangement contributes to the recovery process. And new grain formation indicates the occurrence of recrystallization. All the processes lead to a decrease in the effect of work hardening produced in the first pass. After the isothermal holding, the second pass occurs, which can produce a new work hardening. The accumulation of the work hardening in the two passes results in a higher stress. Therefore, the differences in flow stress or yield stress in the two passes are caused by austenite softening that occurs during the isothermal holding. Figure 1 presents the determination of the parameters for the methods. The 0.2% offset, 2% offset, and 5% total strain methods are based on the difference in flow stress. And the mean flow stress and area measurement methods are based on the difference in strain energy. However, all the methods can be expressed as:
 $${X_{{\rm{re}}}} = {{{D_{\rm{S}}} - {D_2}} \over {{D_{\rm{S}}} - {D_1}}}\quad .$$
Determination of the parameters to calculate the softening fraction by (a) the 0.2% offset, 2% offset, and the 5% total strain methods. (b) The mean flow stress and strain energy method.

Table I presents the parameters in details. The description of the methods can be found elsewhere. Reference Cui and Shong5,Reference Hong, Kang and Park9
The parameters corresponding to the calculation methods.

Double isothermal compression tests were performed on a low carbon microalloyed steel by using a Gleeble-3800 thermal mechanical simulator to further discuss the methods. The chemical composition of the experimental steel is: C 0.15, Mn 1.6, Si 0.3, S 0.037, P 0.051, Cu 0.05, Ni 0.1, V 0.05, Ti 0.02, N 0.0183 and balance Fe. All numbers are given in wt%.
The samples were 8 mm in diameter and 12 mm in length. All the samples were reheated at 1150 °C for 3 min, followed by cooling at a rate of 5 °C/s to the deformation temperature ranging from 800 °C to 950 °C and held there for 60 s. Double compression tests were conducted at a strain rate of 5 s−1 and various time intervals between two passes were selected. Prior to the second pass deformation, some samples were directly quenched to room temperature to study the precipitate and microstructure evolution.
The compression specimens were sectioned along the longitudinal compression axis, then ground and polished, and finally etched with an abluent solution of saturated picric acid for about tens of seconds. The microstructures were examined by optical microscopy and carbon extraction replicas of the treated specimens were examined by transmission electron microscopy.
III. RESULTS AND DISCUSSION
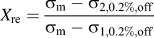
There are two offset methods (0.2% offset and 2% offset) to calculate softening fraction. Under the assumption of the same results from the two methods, the following equation can be obtained:
 $${X_{{\rm{re}}}} = {{{\sigma _{\rm{m}}} - {\sigma _{2,0.2\% ,{\rm{off}}}}} \over {{\sigma _{\rm{m}}} - {\sigma _{1,0.2\% ,{\rm{off}}}}}} = {{{\sigma _{\rm{m}}} - {\sigma _{2,2\% ,{\rm{off}}}}} \over {{\sigma _{\rm{m}}} - {\sigma _{1,2\% ,{\rm{off}}}}}}\quad .$$
Equation (2) can be transformed into:
 $${X_{{\rm{re}}}} = {{{\sigma _{2,2\% ,{\rm{off}}}} - {\sigma _{2,0.2\% ,{\rm{off}}}}} \over {{\sigma _{1,2\% ,{\rm{off}}}} - {\sigma _{1,0.2\% ,{\rm{off}}}}}}\quad .$$
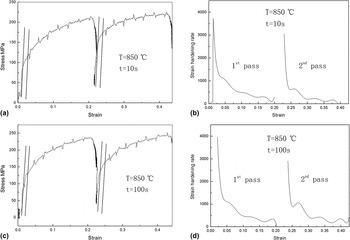
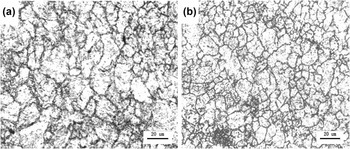
Figure 2 presents the characteristic curves of the tested steel. It can be seen from the experimental curve in Fig. 2(a) that the stress increases exponentially with the strain while the strain hardening rate exhibits exponential decay trend. The comparison of the strain hardening rates in the two passes shows that the strain hardening rate in the first pass is larger than that in the second pass, Fig. 2(b). So the increasing rate of the stress in the first pass is faster, which leads to a smaller SRX volume fraction in Eq. (3). Therefore, the different results from the two offset methods can be explained by the difference in the strain hardening rate in the two passes. And it is not uncommon that the softening fraction by 0.2% offset is often larger. Reference Sun and Hawbolt2,Reference Zhao, Zhang and Wu11 As the two offset methods were performed on the experimental curve in Fig. 2(a) to obtain the softening fraction, the resultant softening fraction was determined as 57.61% by 0.2% offset and 37.75% by 2% offset, respectively. The deviation of the results is consistent with the previous work. Reference Chang, Shi and Jiang3 Figure 3 presents the microstructure of the tested steel deformed at 850 °C. It can be seen that the SRX volume fraction is around 37%. Therefore, 2% offset method can give a better evaluation of the SRX volume fraction for the tested steel, and this method has been used widely. Reference Zhao, Zhao, Li and Lu12
Characteristic curve of the steel under different deformation conditions (a and c) stress–strain curve; (b and d) strain hardening rate corresponding to the two passes.

Austenite of the sample deformed and held for (a) 10 s (b) 100 s.

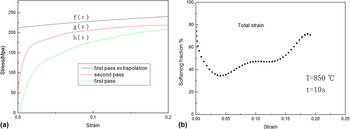
As the experimental curve from the double compression test (Fig. 2) is fitted with a polynomial, it is easy to obtain the extrapolated continuous first curve. The extrapolated curve and the curve for the second pass are shifted to the curve for the first pass. Figure 4(a) presents the resultant curves. As the three curves are fitted with 3rd or 7th order polynomial, the corresponding expressions of f(ε), g(ε), and h(ε) can be obtained, which permits the following data processing. In the present work, the 5% total strain method is extended to total strain method. In this case, the stress in a wide rate instead of at a specific point (5%) will be considered. With the expressions of f(ε), g(ε), and h(ε), Eq. (1) can be transformed into:
 $${X_{{\rm{re}}}} = {{f\left( \varepsilon \right) - h\left( \varepsilon \right)} \over {f\left( \varepsilon \right) - g\left( \varepsilon \right)}}\quad .$$
Total strain method to calculate softening fraction (a) the three flow stress curves (b) relation between softening fraction and strain.

It can be seen that the softening fraction can be regarded as a function of strain and the corresponding curve is shown in Fig. 4. The softening fraction determined by 5% total strain method can be found on the curve and it is 41.39%, a little higher than that by 2% offset method. Moreover, the curve exhibits a growing trend with increasing strain, which lies in the difference strain hardening rate in the two passes. And the lower strain hardening rate in the second pass contributes to higher softening fraction.
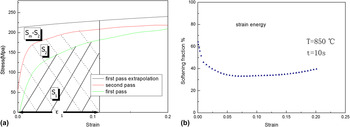
Since strain hardening rate designates stress increasing rate, the stress increasing rates in the two passes are different. And the stress changing has to be considered to perform area measurement method. As the strain increases from 0 to ε1, the areas under the curves in Fig. 5(a) can be expressed by S m, S 2, and S 1, respectively. Since the area can be given by the integral of the flow stress, the softening fraction can be obtained by the area measurement method as:
 $${X_{{\rm{re}}}} = {{\int_0^{{\varepsilon _1}} {f\left( \varepsilon \right){\rm{d}}\varepsilon } - \int_0^{{\varepsilon _1}} {g\left( \varepsilon \right){\rm{d}}\varepsilon } } \over {\int_0^{{\varepsilon _1}} {f\left( \varepsilon \right){\rm{d}}\varepsilon } - \int_0^{{\varepsilon _1}} {h\left( \varepsilon \right){\rm{d}}\varepsilon } }}\quad ,$$
where, ε1 is a specific strain for the calculation.
Strain energy method to calculate softening fraction (a) determination of strain energy (b) relation between softening fraction and strain.

As mean flow stress can be given as:
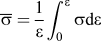 $\overline \sigma = {1 \over \varepsilon }\int_0^\varepsilon {\sigma {\rm{d}}\varepsilon }$
, Eq. (5) can be transformed into:
 $${X_{{\rm{re}}}} = {{{1 \over {{\varepsilon _1}}}\int_0^{{\varepsilon _1}} {f\left( \varepsilon \right){\rm{d}}\varepsilon } - {1 \over {{\varepsilon _1}}}\int_0^{{\varepsilon _1}} {g\left( \varepsilon \right){\rm{d}}\varepsilon } } \over {{1 \over {{\varepsilon _1}}}\int_0^{{\varepsilon _1}} {f\left( \varepsilon \right){\rm{d}}\varepsilon } - {1 \over {{\varepsilon _1}}}\int_0^{{\varepsilon _1}} {h\left( \varepsilon \right){\rm{d}}\varepsilon } }}\quad .$$
It can be seen from Eqs. (5) and (6) that area measurement method is consistent with mean flow stress method.
To determine the effect of strain on the softening fraction by area measurement method, the expressions corresponding to the three curves in Fig. 4(a) have to be found out. The three curves were fitted with 7 order polynomial to get a high precision. With the assistance of integral operation, the softening fraction by area measurement method (strain energy) can be expressed as a function of strain and the corresponding curve is shown in Fig. 5(b). To facilitate the comparison, the similar analysis of the stress–strain curve of the tested steel deformed at 850 °C and the time interval of 100 s was carried out. Figure 6(b) presents the resultant curves.
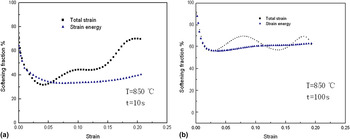
Comparison of total strain and strain energy methods to calculate softening fraction (a) T = 850 °C, t = 10 s (b) T = 850 °C, t = 100 s.

It can be seen in Fig. 6 that the softening fraction by area measurement method is around 100% initially, and then meets a fast drop, and finally tends to be steady when strain reaches a specific value. As the tested steel concerned, the specific strain was determined as around 10%. It can be concluded that there is a critical strain for area measurement method. Once the strain is larger than the critical value, the softening fraction tends to be a constant regardless of the strain.
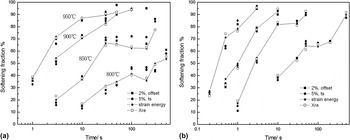
2% offset, 5% total strain, area measurement, and microstructure examination methods were performed on the stress–strain curves of the tested steel deformed under various conditions to compare the results. Based on the analysis above, the strain for the calculation by area measurement method has to be large enough. The strain was set to 20% or 30% corresponding to the pass strain of 22% or 35%. Figure 7 presents the results from the four methods.
Softening fractions obtained by using 2% offset, 5% total strain and strain energy methods (a) pass strain of 22% (b) pass strain of 35%.

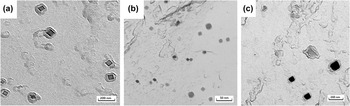
It can be seen that both higher temperature and longer time interval contribute to softening process of the tested steel. The softening curves of the tested steel deformed at 800 °C or 850 °C exhibit platforms while no platforms can be observed on the softening curves at the deformation temperature of 900 °C or 950 °C and the softening curves exhibit sigmoidal shape. Interrupt quenching test revealed that there were precipitates in the tested steel deformed at the temperature of 800 °C or 850 °C. Figure 8 presents the morphology of the precipitates. In Fig. 8(a), the precipitation particles in the initial holding (time interval of 10 s) are quadrate and are mainly about carbonitride of titanium by energy dispersive spectroscopy (EDS) analysis. Considering the size of the particles, it can not play a pinning effect in recrystallization process. With longer holding times to 100 s, the particles become spherical and fine about several to tens of nanometers. By EDS analysis, the particles are mainly about carbonitride of vanadium. The precipitated particles can play an inhibition role in softening, Reference Zhao, Zhao, Li and Lu12 which leads to a platform on the softening curve. In Fig. 7, X re designates the SRX volume fraction by microstructure examination method. It can be seen that the results from 2% offset and 5% total strain methods have a high agreement. Compared with the results from microstructure examination, the two methods can give a good estimation of the SRX volume fraction for the tested steel deformed at 900 °C or 950 °C, which is consistent with the previous work. Reference Fernández, López and Rodríguez-Ibabe13
The precipitations of the tested steel deformed at 850 °C and held for (a) 10 s, pass strain of 22%; (b) 100 s, pass strain of 22%; (c) 100 s, pass strain of 35%.

However, there are deviations among the results from the four methods performed on the tested steel deformed at the temperature of 800 °C or 850 °C, where the softening curve exhibits platform. The SRX volume fraction by area measurement method is lower than the value determined by 2% offset or 5% method and it agrees well with the one by microstructure examination. In this case, the area measurement method can predict the SRX volume fraction well. Lower SRX volume fraction by area measurement method can be related to dislocation pinning effect of the precipitated particles. Dislocation movement is inhibited by the particles, which contributes to a higher stress in the second pass and results in a larger strain energy or area. Consequently, the softening fraction by area measurement method is smaller.
Total strain or area measurement method has been performed on the stress–strain curves of the tested steel deformed at 850 °C and time interval of 10 s or 100 s. Figure 6 presents the resultant curves. It is known from the analysis above that precipitates do not play a pinning effect at 850 °C and time interval of 10 s. The resistance of dislocation movement is weak in the absence of precipitates. So the effect of strain hardening is not marked in the second pass. Therefore, the softening fraction by total strain method increases with increasing strain. However, the particles precipitated at the time interval of 100 s can play an inhibition role in SRX softening. In this case, the dislocation pinning effect contributes to higher stress in the second pass, which tends to reduce the softening fraction. So the resultant softening fraction tends to be steady.
Comparing the softening fractions of the tested steel deformed at a pass strain of 22% and 35%, it can be concluded that the pinning effect of the precipitates can be reduced by applying a larger strain. As can be seen in Fig. 8, the precipitates are resolved due to larger strain and longer holding time. Therefore, the pinning force exerted by the precipitates is lower than the driving force for recrystallization. It is calculated that the recrystallization volume fraction is around 100% and full recrystallization occurs under this condition. Weak pinning effect of the precipitates leads to lower stress in the second pass. It is worth to note that the softening fractions resulting from 2% offset, 5% total strain, area measurement, or mean flow stress methods tend to be consistent due to the decrease in pinning effect.
IV. CONCLUSIONS
The methods to calculate austenite SRX volume fraction mainly consist of 0.2% offset, 2% offset, 5% total strain, mean flow stress, and area measurement methods. The stress–strain curves from double deformation test were analyzed by using the methods. Different methods may result in different results. In the present work, double isothermal compression test was performed on a low carbon microalloyed steel. Based on the stress–strain curves, the softening fractions at the pass intervals were analyzed by using different methods and discussion of the methods were carried out, which was summarized as follows:
-
(1) The softening fractions resulting from the 0.2% offset and 2% offset methods are different, which can be explained by the difference in strain hardening rate in the two passes. The value resulting from the 0.2% offset method is larger than the one from 2% offset method. And the 2% offset method is more suitable to calculate SRX for the tested steel.
-
(2) 2% offset and 5% total strain methods have a high agreement. When performing total strain method, the resultant softening fraction is not a constant with increasing strain. With the increasing strain, it is around 100% initially, and then meets a fast drop, and finally tends to increase. The softening fraction resulting from area measurement method is also around 100% initially, and then meets a fast drop with increasing strain. But it tends to be steady after strain reaches a critical value. Therefore, the strain used to perform the area measurement method has to be large enough.
-
(3) The mean flow stress and area measurement methods are consistent. 2% offset, 5% total strain, and area measurement methods were performed on the stress–strain curves of the tested steel deformed under various conditions to compare the results from the three methods. Two cases should be considered: (i) the results from the three methods agree well in the absence of precipitates and (ii) the results from area measurement method are smaller compared with the ones from the other two methods when SRX is retarded due to the occurrence of precipitation. And area measurement method can predict the SRX volume fraction well, which can be proved by the microstructure examination.
-
(4) 2% offset, 5% total strain and area measurement methods tend to be consistent when performed on the stress–strain curves of the tested steel deformed at a larger pass strain of 35%. And the deviations between 2% offset (or 5% total strain) and area measurement methods can be reduced.